Climate factors and food availability shape the altitudinal migration of birds in the Xiling Snow Mountains, China
Abstract
Many bird species in montane regions display altitudinal migration, but so far, the underlying ecological driving mechanisms are not clear. We studied the altitudinal migration behavior patterns and factors influencing altitudinal migration in the Xiling Snow Mountains, which are part of the Hengduan mountain range in southwest China. We recorded the local bird diversity, the seasonal change of: the average temperature (AT), the average humidity (AH), the average invertebrate biomass (AIB), and the amount of plant food sources (PFS) at two study sites (∼1300 and ∼2100 m a.s.l.) during two migration seasons from September 2022 to May 2023. During our surveys, we recorded 96 bird species in total. Among these, 15 altitudinal migrants were identified. The most common family among altitudinal migrants was Leiothrichidae. AT, AIB, and PFS had a significant positive correlation with the monthly number of individuals (MNI) several bird species, implying that increasing temperatures and an increasing abundance of invertebrates and PFS possibly induced upward migration of altitudinal migrants and vice versa. AH possibly only played a minor role in influencing altitudinal migration, since it exhibited no significant correlation with the MNI. Furthermore, we found that the upward migration temperature range of altitudinal migrants ranged between 9.8°C and 13.9°C during spring and the downward migration temperature range ranged between 12.2°C and 7.9°C during autumn. In conclusion, our study and several other studies revealed that the same environmental factors influenced the altitudinal migration patterns of birds in the Hengduan Mountains.
INTRODUCTION
Altitudinal migration is a common migration type among birds in subtropical and temperate mountainous regions. For most bird species in mountain ranges, altitudinal migration likely occurs to some extent (Boyle 2017; Hsiung et al. 2018). Altitudinal migrants usually migrate to high elevations during spring to breed and then migrate to low elevations during autumn to overwinter due to changing environmental factors (Rappole 2013; Hsiung et al. 2018). Birds are tracking numerous environmental factors along an elevational gradient, such as the seasonal change of: the average temperature (AT), the average humidity (AH), the average invertebrate biomass (AIB), and the amount of plant food sources (PFS). Environmental factors change rapidly along an elevational gradient, much faster than along the latitude gradient, which causes different migration patterns of birds compared to latitudinal migration (Körner 2007; Jones et al. 2014; Pratt et al. 2017). Climate factors such as AT and AH limit a species’ elevational distribution and migration range due to each species’ physiological tolerances (McCain 2009; Peters et al. 2016). On a further note, altitudinal migrant birds are under increasing pressure to shift their thermal niche upward due to the rapid increase of temperature due to climate change (Tingley et al. 2012; Freeman & Class Freeman 2014; Elsen & Tingley 2015). Furthermore, increasing temperatures also increase the abundance of invertebrates and vice versa. As most altitudinal migrant bird species are invertivores and omnivores (part of their diet consists of invertebrates) (Barçante et al. 2017), AIB may also be an important ecological driver for explaining the altitudinal migration of birds (Gutiérrez & Wilson 2014; Supriya et al. 2019; Araújo et al. 2022). Moreover, AT affects the seasonal photosynthetic activity (Tan et al. 2015) and thus affects the seasonal availability of PFS such as berries, flowers, and seeds. As the diet of many bird species consists of plant food sources to some degree (Barçante et al. 2017), PFS may also influence the altitudinal migration of birds (Solórzano et al. 2000; Kimura et al. 2001).
The Hengduan Mountains are one of the world's 36 biodiversity hotspots (Habel et al. 2019) with high bird species diversity and endemism (Wu et al. 2013, 2017). Due to the large elevation gradient (>7000 m) of the Hengduan Mountains, which are situated between the Sichuan Basin (∼500 m) and the Qinghai–Tibet Plateau (∼4500 m), and distinct seasonal changes of a subtropical climate (Wu et al. 2013), altitudinal migration is very common among birds in this region, making this mountain range highly suitable for studying altitudinal migration. However, we still know very little about the migration patterns and ecological factors influencing the altitudinal migration of birds in the Hengduan Mountains. We therefore chose the Xiling Snow Mountains, which are part of the Hengduan mountain range in southwest China, as the study area. This region is a nature reserve with roads/trails, which are optimal for conducting line transects located at both elevations. To our knowledge, we are the first research team to study the altitudinal migration behavior patterns and factors influencing altitudinal migration in the Xiling Snow Mountains. Similar studies have been conducted by Cheng et al. (2022) and Haase et al. (2023) on the eastern slope of Mt. Gongga and by Liang et al. (2021) in the Gaoligong Mountains, which are all located in the Hengduan mountain range. However, previous studies did not consider the invertebrate biomass and the amount of PFS as ecological drivers of altitudinal migration. We therefore additionally studied these factors and their influence on the altitudinal migration of birds. Moreover, due to climate change, we need to intensively study the altitudinal migration behavior patterns and the migration temperature of altitudinal migrant birds to effectively protect them.
In this article, we collected and analyzed our data from the Xiling Snow Mountains to study: (1) the bird diversity in this area; (2) which bird species exhibit altitudinal migration behavior; (3) the relationship between altitudinal migration with AT, AH, AIB, and PFS.
MATERIALS AND METHODS
General survey methods
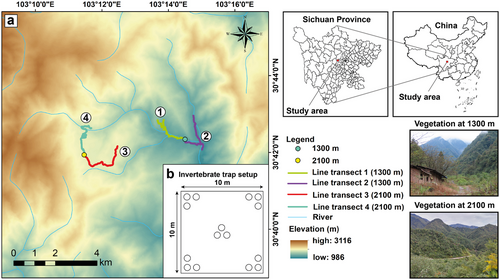
We conducted research in the Xiling Snow Mountains (30°39ʹ–30°45ʹN, 103°09ʹ–103°17ʹE) at two study sites (∼1300 and ∼2100 m a.s.l.) (Fig. 1a). We only set up two study sites, because the remaining terrain was too steep and inaccessible. The study site at 1300 m is located in the evergreen broad-leaf forest and agroforestry belt, and a village with several hotels is located at 1300 m. Furthermore, the study site at 2100 m is located in the evergreen broadleaf and deciduous broadleaf mixed forest belt, with several hotels and a sightseeing spot and ski resort being located at 2100 m (Fig. 1a). At least two experienced researchers conducted the experiments at the same time. Due to the large elevation gradient and changing environmental factors, we assumed that some bird species would conduct upward migration during the breeding and downward migration during autumn (Morrissey et al. 2004; Boyle 2017; Hsiung et al. 2018). Bird species in this system migrate between 300 and over 4000 m in elevation, but this varies greatly from species to species. We conducted research in spring from March to May and in autumn from September to November. We only conducted research during these months, because during summer and winter, the bird population remains rather stable at both elevations and migration occurs only seldom (Rappole 2013; He et al. 2022).
Line transect method
We surveyed the study area at the end of September/beginning of October, end of October, end of November/beginning of December 2022, and at the beginning of March, April, and May 2023. Each survey lasted for 12 days (6 per elevation). We set up two line transects at each study site; each 3 km in length (Fig. 1a). At the 1300 m study site, the elevation of line transect 1 ranged from 1310 to 1600 m, line transect 2 ranged from 1220 to 1310 m, and the total elevation range amounted to 380 m. Additionally, at the 2100 m study site, the elevation range of line transect 3 ranged from 2120 to 2150 m, line transect 4 ranged from 1960 to 2120 m, and the total elevation range amounted to 190 m. The elevation ranges of the two study sites were different because it was already quite difficult to set up four line transects with an equal length of 3 km, so an equal surveyed elevation range could not be accounted for. However, the high elevation range of line transect 1 was largely caused by the end of the line transect ascending rapidly in elevation.
Each line transect was surveyed three times, mostly in the morning (8:00 to 10:00 a.m.). Only one line transect was walked per day since birds were most active during the morning and the weather conditions were usually best in the morning. Later on, it usually started to rain or it got very foggy. Therefore, in the late afternoon/evening, fewer birds were active. Bird species were identified using direct sighting or bird calls. The species name, sex, number of individuals, type of observation (direct sighting or bird call), elevation, date, time, vegetation zone, and line transect number were recorded.
Altitudinal migration intensity formula
Sampling methods of environmental factors
To analyze the relationship between the altitudinal migration of birds with AT and AH, a COS-04-X (Kongsaien) automatic temperature and humidity recorder was installed at each study site in a shaded and dry place. Temperature and humidity were automatically recorded every 30 min. AT and AH were calculated by averaging the temperature and humidity values during which line transects were walked (mostly between 8:00 and 10:00 a.m.) for each survey day. Then, these values were averaged among the 6 survey days per elevation and survey month. Furthermore, to analyze the relationship between the altitudinal migration of birds with AIB, we trapped ground insects using insect traps. We did not sample arboreal invertebrates due to the logistical constraints. Five plots with 15 insect traps each (Fig. 1b) were installed at each study site during each survey month. The plots were located at least 50 m apart. The insect traps were made out of plastic cups buried in the ground, half-filled with a mixture of five parts 75% alcohol and one part glycerol. The insect traps were installed for 5 days each. After that, the invertebrates of each plot were combined and separated from dirt and other residues and then carefully identified using a stereomicroscope (Nikon SMZ 745T). Then, the combined invertebrate biomass of each plot was measured and AIB was calculated. Moreover, to analyze the relationship between the altitudinal migration of birds with PFS, we systematically recorded PFS such as berries, flowers, and seeds along each line transect one time per survey month using 1 m2 as unit. For example, a tree with 1 m2 of densely packed flowers was recorded as 1 m2 of PFS. Berries were recorded on the ground, bushes, and trees. Flowers and seeds were only recorded on bushes and trees. We only recorded PFS that are known to be eaten by birds according to https://birdsoftheworld.org/bow/home.
Statistical analysis
We then calculated a linear regression with quadratic components between the MNI of altitudinal migrant bird species with AT, AH, AIB, and PFS to investigate the influence of environmental factors on MNI. We used quadratic terms since it is plausible that a median level of these environmental factors may better predict the altitudinal migration of birds.
Furthermore, the migration time of altitudinal migrants was determined by comparing the changes in the number of individuals per elevation and survey month for each altitudinal migrant species. For determining an estimated migration temperature range, we used the following method: For example, if a bird species migrated to high elevations from March to May, the AT at low elevations during March and April was used as upward migration temperature range, and the average temperature at high elevations during April and May was used as appearance migration temperature range. In addition, the downward migration temperature during autumn was calculated at high elevations, and the appearance migration temperature range during autumn was calculated at low elevations instead. If a bird species only migrated between 2 survey months, then the migration temperature range was only determined for 1 month at low and high elevations each instead. All statistical analyses were performed in R 4.3.0. Graphs were drawn using OriginPro 2022 and R 4.3.0.
RESULTS
Bird community composition and seasonal community composition change
In total, 11 orders, 39 families, 96 species, and 2544 individuals were recorded during the surveys in the Xiling Snow Mountains. Passerine species were distributed among 28 families (71.8%) and 79 species (82.3%). Non-passerine species were distributed among 10 orders (90.9%), 10 families (28.2%), and 17 species (17.7%). Muscicapidae (Old World flycatchers, 18 species, 18.8%), Phylloscopidae (leaf warblers, 11 species, 11.5%), and Leiothrichidae (laughingthrushes, 6 species, 6.3%) had the most species (Supporting Information).
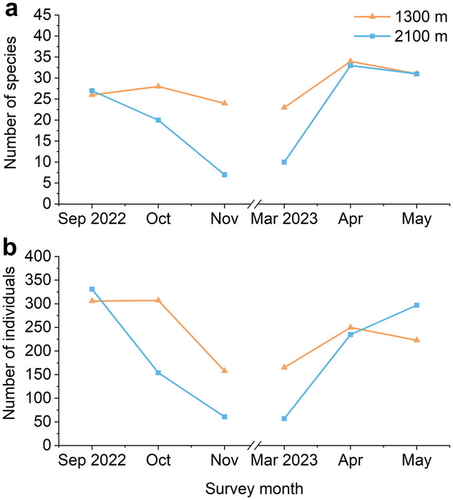
The number of species per elevation and survey month (Fig. 2a) showed distinct seasonal changes. During autumn, the number of species at 1300 m decreased only slightly, but the number of species at 2100 m decreased rapidly instead. Moreover, during spring, the number of species increased rapidly both at 1300 and 2100 m. The number of species at 1300 m was considerably higher than the number of species at 2100 m in October and November 2022 and March 2023. The number of individuals per elevation and survey month (Fig. 2b) showed similar patterns. During autumn, the number of individuals at 1300 and 2100 m decreased rapidly and vice versa. Moreover, during September 2022 and May 2023, the number of individuals at 2100 m was even higher than at 1300 m.
Altitudinal migrant analysis
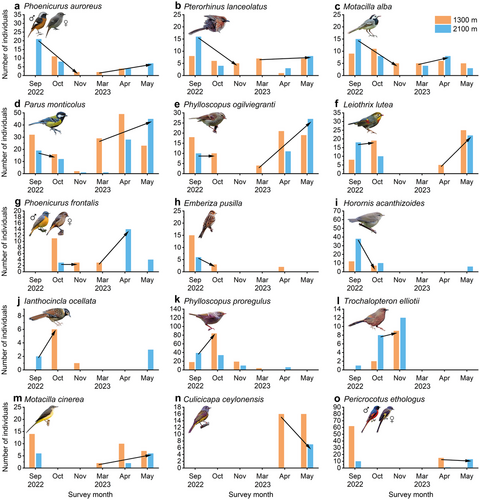
According to our altitudinal migration formula, we identified 15 altitudinal migrant species (Fig. 3). These species exhibited distinct seasonal individual number changes between the two study sites. The green-backed tit (Parus monticolus Vigors, 1831), the Pallas's leaf warbler [Phylloscopus proregulus (Pallas, 1811)], and the Kloss's leaf warbler [Phylloscopus ogilviegranti (La Touche, 1922)] had the highest altitudinal migration intensity (Table 1).
| English and Latin species name | AMI |
|---|---|
| Green-backed tit (Parus monticolus) | 89 |
| Pallas's leaf warbler (Phylloscopus proregulus) | 80 |
| Kloss's leaf warbler (Phylloscopus ogilviegranti) | 40 |
| Daurian redstart (Phoenicurus auroreus) | 35 |
| Blue-fronted redstart (Phoenicurus frontalis) | 32 |
| Yellow-bellied bush warbler (Horornis acanthizoides) | 29 |
| Long-tailed minivet (Pericrocotus ethologus) | 27 |
| Red-billed leiothrix (Leiothrix lutea) | 27 |
| Chinese babax (Pterorhinus lanceolatus) | 25 |
| Grey-headed canary-flycatcher (Culicicapa ceylonensis) | 25 |
| White wagtail (Motacilla alba) | 14 |
| Little bunting (Emberiza pusilla) | 14 |
| Grey wagtail (Motacilla cinerea) | 11 |
| Elliot's laughingthrush (Trochalopteron elliotii) | 10 |
| Spotted laughingthrush (Ianthocincla ocellata) | 9 |
The altitudinal migrant species consisted of eight resident species (53.3%), four summer visitors (26.7%), and three winter visitors (20.0%). There were 10 invertivorous (66.7%) and five omnivorous (33.3%) species. The dominant family was Leiothrichidae (four species, 26.7%) (Supporting Information). There were three different types of migration patterns. The first one was displayed by the bird species in Fig. 3a–g, which both exhibited standard upward migration during spring and downward migration during autumn. For example, the altitudinal migration trend of the Daurian redstart [Phoenicurus auroreus (Pallas, 1776); Fig. 3a] was especially evident, since during autumn, its individual numbers decreased significantly at 2100 m from September to October and individuals were only recorded at 1300 m from October on. This implies that this species possibly migrated downward during autumn. Additionally, during spring, individuals were only recorded at 1300 m during March and April and at 2100 m only from April on. Therefore, this implies this species possibly migrated upward during spring instead.
Besides, the second migration pattern was displayed by the bird species in Fig. 3h–l, which only displayed downward migration during autumn. These species were usually not recorded during spring or in very small numbers, making a conclusion about their migration behavior during spring difficult. To further elaborate, the little bunting (Emberiza pusilla Pallas, 1776; Fig. 3h) is a winter visitor and therefore was only present in the Xiling Snow Mountains during autumn and winter. For example, the altitudinal migration trend of the yellow-bellied bush warbler [Horornis acanthizoides (Verreaux, 1870); Fig. 3i] was especially evident, since during autumn, its individual numbers decreased rapidly at 2100 m from September to October, implying a possible downward migration trend. On a further note, the behavior of Elliot's laughingthrush (Trochalopteron elliotii Verreaux, 1870; Fig. 3l) was special, because the number of individuals steadily increased at 2100 m from September to November 2023. At 1300 m, individuals were only recorded from October and distinctly increased in November. Therefore, this species possibly migrated from even higher elevations down to 2100 m in October and then migrated partially further down to 1300 m during November.
Furthermore, the third migration pattern was displayed by the bird species in Fig. 3m–o, which only exhibited upward migration during spring. These species were usually not recorded during autumn or in very small numbers, making a conclusion about their migration behavior during autumn difficult. To further elaborate, the grey-headed canary-flycatcher [Culicicapa ceylonensis (Swainson, 1820); Fig. 3n] and the long-tailed minivet (Pericrocotus ethologus Bangs & Phillips, 1914; Fig. 3o) are summer visitors and therefore were only present in the Xiling Snow Mountains during spring and summer. For example, the altitudinal migration trend of the grey wagtail (Motacilla cinerea Tunstall, 1771; Fig. 3m) was particularly evident, since during spring, its individual numbers first increased at 1300 m in March and then increased at 2100 m from April on, while the number of individuals decreased at 1300 m in May again.
Moreover, the rest of the 81 recorded species were labeled as not having enough data to prove altitudinal migration behavior. These species were recorded at one or both study sites in small numbers (usually 1 to 10 individuals) and only during a few survey months, so that a conclusive decision could not be made about whether they were altitudinal migrants or not.
Relationship between altitudinal migration with environmental factors
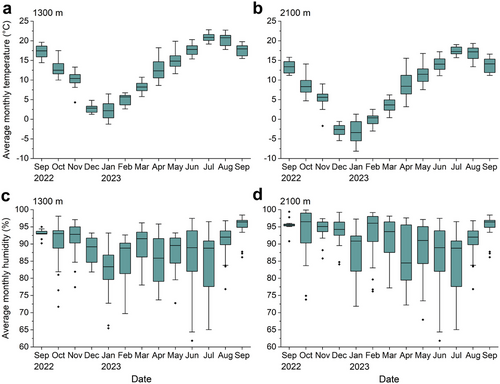
The average monthly temperatures at 1300 and 2100 m both displayed distinct seasonal changes (Fig. 4a,b). It rapidly decreased from September 2022 to January 2023, gradually increased from January to July 2023, and then gradually decreased from July to September 2023. The average monthly temperature on average was 4.3°C lower at 2100 m compared to 1300 m. Additionally, the average monthly humidity at 1300 and 2100 m did not display distinct seasonal changes, except for January and April being the months with the lowest median humidity (Fig. 4c,d). The average monthly humidity at 1300 gradually decreased from September 2022 to January 2023 and then displayed a gradually increasing trend from January to September 2023, except for a strong decrease in April 2023. Moreover, the average monthly humidity at 2100 m exhibited a mostly similar trend. The average monthly humidity on average was 2.1% higher at 2100 m than at 1300 m.
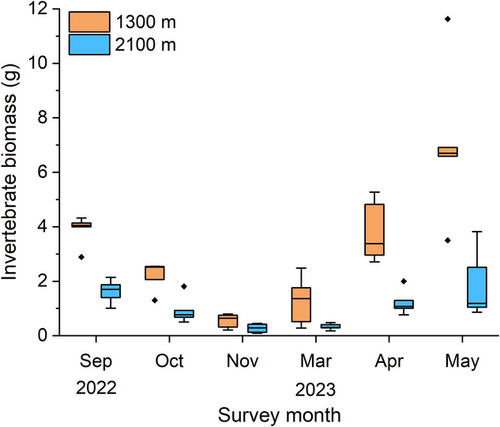
In addition, the invertebrate biomass (Fig. 5) varied greatly between each survey month, similar to the development of the number of individuals (Fig. 2b). It slowly decreased during autumn and rapidly increased during spring at both elevations. The invertebrate biomass at 1300 m was consistently higher than at 2100 m and gradually decreased during autumn while rapidly increasing during spring at both elevations.
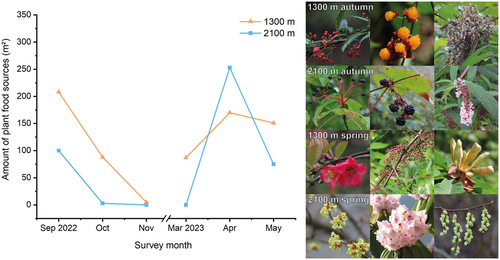
Besides, the amount of PFS (Fig. 6) also displayed similar seasonal changes like the invertebrate biomass (Fig. 5) and the number of bird individuals (Fig. 2b). It rapidly decreased in autumn and rapidly increased in spring at both elevations. Furthermore, it is worth noting that the amount of PFS was highest at 2100 m during April 2023 and then decreased rapidly again during May 2023. This is due to the high number of flowers recorded on trees at 2100 m during spring. PFS at 1300 m were available throughout all survey months, but PFS at 2100 m were not recorded in November 2022 and March 2023.
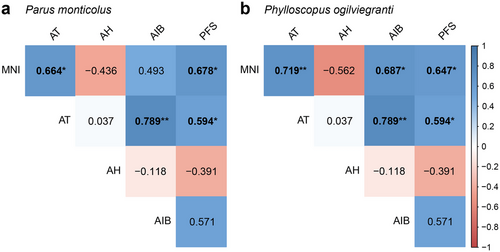
The results of the linear regression with quadratic components (Table 2) showed that AIB had a significant positive correlation, AT and PFS displayed a significant mostly positive correlation, and AH exhibited a nonsignificant mostly negative correlation with the MNI of altitudinal migrants. In addition, we found that AT had a significant positive correlation with AIB and PFS (Fig. 7). There were six bird species with significant correlations in total. To further illustrate, for the MNI of the green-backed tit (P. monticolus), AT (β = 5.406, β2 = −0.223, r2 = 0.526, P < 0.05), AIB (β = 21.666, β2 = −2.553, r2 = 0.682, P < 0.01), and PFS (β = 0.354, β2 = −0.001, r2 = 0.632, P < 0.05) all had a significant positive correlation with MNI and only AH (β = −20.333, β2 = 0.108, r2 = 0.217, P > 0.05) had a nonsignificant negative correlation with MNI. Besides, for the MNI of the Kloss's leaf warbler (P. ogilviegranti), AT (β = 1.160, β2 = 0.011, r2 = 0.517, P < 0.05), AIB (β = 10.716, β2 = −1.073, r2 = 0.696, P < 0.01), and PFS (β = 0.220, β2 = −0.001, r2 = 0.632, P < 0.05) all had a significant positive correlation with MNI, while only AH (β = −1.230, β2 = 0.001, r2 = 0.316, P > 0.05) had a nonsignificant negative correlation with MNI.
| Latin species name | AT | AH | AIB | PFS |
|---|---|---|---|---|
| Phoenicurus auroreus | ||||
| β | 1.876 | −12.814 | 3.725 | 0.086 |
| SE | 1.322 | 14.068 | 3.212 | 0.067 |
| t | 1.419 | −0.911 | 1.160 | 1.275 |
| β2 | −0.097 | 0.074 | −0.609 | <0.001 |
| SE2 | 0.085 | 0.080 | 0.445 | <0.001 |
| t2 | −1.137 | 0.919 | −1.370 | −1.369 |
| r2 | 0.236 | 0.094 | 0.192 | 0.173 |
| P | 0.285 | 0.641 | 0.384 | 0.426 |
| Pterorhinus lanceolatus | ||||
| β | 0.942 | −4.262 | 2.689 | 0.098 |
| SE | 0.836 | 10.463 | 2.367 | 0.042 |
| t | 1.127 | −0.407 | 1.136 | 2.343 |
| β2 | −0.027 | 0.024 | −0.316 | <0.001 |
| SE2 | 0.054 | 0.060 | 0.328 | <0.001 |
| t2 | −0.509 | 0.409 | −0.963 | −2.213 |
| r2 | 0.401 | 0.019 | 0.140 | 0.379 |
| P | 0.100 | 0.919 | 0.508 | 0.117 |
| Motacilla alba | ||||
| β | 1.032 | −4.229 | 3.460 | 0.050 |
| SE | 0.760 | 8.899 | 1.949 | 0.042 |
| t | 1.359 | −0.475 | 1.775 | 1.183 |
| β2 | −0.040 | 0.025 | −0.467 | <0.001 |
| SE2 | 0.049 | 0.051 | 0.270 | <0.001 |
| t2 | −0.815 | 0.499 | −1.732 | −0.839 |
| r2 | −0.040 | 0.099 | 0.260 | 0.193 |
| P | 0.123 | 0.626 | 0.258 | 0.382 |
| Parus monticolus | ||||
| β | 5.406 | −20.333 | 21.666 | 0.354 |
| SE | 2.703 | 33.971 | 5.232 | 0.117 |
| t | 2.000 | −0.599 | 4.141 | 3.029 |
| β2 | −0.223 | 0.108 | −2.553 | −0.001 |
| SE2 | 0.174 | 0.194 | 0.724 | <0.001 |
| t2 | −1.280 | 0.559 | −3.526 | −2.052 |
| r2 | 0.526 | 0.217 | 0.682 | 0.632 |
| P | 0.035* | 0.332 | 0.006** | 0.011* |
| Phylloscopus ogilviegranti | ||||
| β | 1.160 | −1.230 | 10.716 | 0.220 |
| SE | 1.606 | 18.677 | 3.009 | 0.069 |
| t | 0.722 | −0.066 | 3.561 | 3.197 |
| β2 | 0.011 | 0.001 | −1.073 | −0.001 |
| SE2 | 0.103 | 0.106 | 0.417 | <0.001 |
| t2 | 0.103 | 0.011 | −2.576 | −2.284 |
| r2 | 0.517 | 0.316 | 0.696 | 0.632 |
| P | 0.038* | 0.181 | 0.005** | 0.011* |
| Leiothrix lutea | ||||
| β | 0.867 | −10.154 | 4.471 | 0.234 |
| SE | 1.667 | 22.317 | 4.431 | 0.085 |
| t | 0.520 | −0.455 | 1.009 | 2.760 |
| β2 | 0.030 | 0.056 | −0.224 | −0.001 |
| SE2 | 0.107 | 0.127 | 0.613 | <0.001 |
| t2 | 0.278 | 0.439 | −0.366 | −2.723 |
| r2 | 0.498 | 0.059 | 0.365 | 0.462 |
| P | 0.045* | 0.762 | 0.130 | 0.061 |
| Phoenicurus frontalis | ||||
| β | 1.888 | −11.961 | 1.307 | −0.025 |
| SE | 0.907 | 9.523 | 2.539 | 0.050 |
| t | 2.083 | −1.256 | 0.515 | −0.501 |
| β2 | −0.131 | 0.066 | −0.265 | <0.001 |
| SE2 | 0.058 | 0.054 | 0.351 | <0.001 |
| t2 | −2.244 | 1.221 | −0.753 | 0.912 |
| r2 | 0.363 | 0.264 | 0.105 | 0.188 |
| P | 0.132 | 0.252 | 0.608 | 0.392 |
| Emberiza pusilla | ||||
| β | −0.467 | −0.422 | 4.693 | 0.040 |
| SE | 0.874 | 10.093 | 2.002 | 0.047 |
| t | −0.535 | −0.042 | 2.344 | 0.838 |
| β2 | 0.061 | 0.004 | −0.586 | <0.001 |
| SE2 | 0.056 | 0.058 | 0.277 | <0.001 |
| t2 | 1.079 | 0.067 | −2.113 | −0.379 |
| r2 | 0.349 | 0.090 | 0.387 | 0.206 |
| P | 0.145 | 0.655 | 0.111 | 0.354 |
| Horornis acanthizoides | ||||
| β | 0.953 | −14.257 | 6.140 | 0.132 |
| SE | 2.430 | 24.931 | 5.915 | 0.123 |
| t | 0.392 | −0.572 | 1.038 | 1.069 |
| β2 | −0.004 | 0.084 | −0.918 | −0.001 |
| SE2 | 0.157 | 0.142 | 0.819 | 0.001 |
| t2 | −0.028 | 0.592 | −1.121 | −1.082 |
| r2 | 0.174 | 0.090 | 0.124 | 0.117 |
| P | 0.423 | 0.653 | 0.552 | 0.572 |
| Ianthocincla ocellata | ||||
| β | 0.423 | −2.802 | 1.122 | 0.028 |
| SE | 0.423 | 4.314 | 0.984 | 0.019 |
| t | 0.999 | −0.649 | 1.140 | 1.481 |
| β2 | −0.023 | 0.016 | −0.171 | <0.001 |
| SE2 | 0.027 | 0.025 | 0.136 | <0.001 |
| t2 | −0.825 | 0.645 | −1.255 | −1.688 |
| r2 | 0.124 | 0.047 | 0.152 | 0.249 |
| P | 0.552 | 0.804 | 0.476 | 0.276 |
| Phylloscopus proregulus | ||||
| β | 4.300 | −47.244 | 11.442 | 0.161 |
| SE | 5.773 | 49.446 | 13.347 | 0.284 |
| t | 0.745 | −0.955 | 0.857 | 0.566 |
| β2 | −0.217 | 0.282 | −1.903 | −0.001 |
| SE2 | 0.372 | 0.282 | 1.848 | 0.001 |
| t2 | −0.583 | 1.001 | −1.030 | −0.746 |
| r2 | 0.083 | 0.296 | 0.122 | 0.076 |
| P | 0.677 | 0.206 | 0.557 | 0.701 |
| Trochalopteron elliotii | ||||
| β | −0.824 | −4.181 | −3.938 | −0.090 |
| SE | 0.848 | 9.449 | 1.956 | 0.034 |
| t | −0.971 | −0.442 | −2.013 | −2.657 |
| β2 | 0.022 | 0.026 | 0.418 | <0.001 |
| SE2 | 0.055 | 0.054 | 0.271 | <0.001 |
| t2 | 0.400 | 0.477 | 1.542 | 1.779 |
| r2 | 0.359 | 0.168 | 0.390 | 0.576 |
| P | 0.135 | 0.437 | 0.109 | 0.021* |
| Motacilla cinerea | ||||
| β | −0.322 | 4.718 | 5.395 | 0.087 |
| SE | 0.848 | 9.449 | 1.956 | 1.956 |
| t | −0.971 | −0.442 | −2.013 | −2.013 |
| β2 | 0.066 | −0.027 | −0.545 | <0.001 |
| SE2 | 0.055 | 0.054 | 0.271 | 0.271 |
| t2 | 0.400 | 0.477 | 1.542 | 1.542 |
| r2 | 0.629 | 0.034 | 0.712 | 0.541 |
| P | 0.011* | 0.858 | 0.004** | 0.030* |
| Culicicapa ceylonensis | ||||
| β | −0.564 | 16.366 | 1.861 | 0.112 |
| SE | 1.257 | 13.059 | 2.257 | 0.064 |
| t | −0.449 | 1.253 | 0.824 | 1.754 |
| β2 | 0.079 | −0.096 | 0.090 | <0.001 |
| SE2 | 0.081 | 0.074 | 0.312 | <0.001 |
| t2 | 0.970 | −1.283 | 0.287 | −1.457 |
| r2 | 0.324 | 0.236 | 0.610 | 0.278 |
| P | 0.171 | 0.297 | 0.015* | 0.231 |
| Pericrocotus ethologus | ||||
| β | −1.419 | −11.041 | 19.606 | 0.124 |
| SE | 3.686 | 42.010 | 7.723 | 0.186 |
| t | −0.385 | −0.263 | 2.539 | 0.664 |
| β2 | 0.202 | 0.065 | −2.403 | <0.001 |
| SE2 | 0.238 | 0.240 | 1.069 | 0.001 |
| t2 | 0.851 | 0.270 | −2.248 | −0.141 |
| r2 | 0.276 | 0.016 | 0.431 | 0.231 |
| P | 0.233 | 0.929 | 0.079 | 0.307 |
- β, estimate value; SE, standard error; t, t-value; β2, quadratic estimate value; SE2, quadratic standard error; t2, quadratic t-value; r2, r-squared value. *P ≤ 0.05, **P ≤ 0.01. Statistically significant (P ≤ 0.05) results are marked in bold.
Migration temperature range and time
In autumn, the downward migration temperature range of altitudinal migrant birds ranged between 12.2°C and 7.9°C at 2100 m (Table 3). The downward migration temperature in September was 12.2°C and 7.9°C in October. Moreover, the appearance temperature ranged between 11.9°C and 3.4°C at 1300 m. The appearance temperature was 11.9°C in October and only 3.4°C in November. Additionally, the downward migration temperature of the Elliot's laughingthrush (T. elliotii) and blue-fronted redstart (Phoenicurus frontalis Vigors, 1831) was quite low (7.9°C), since these were the only bird species that migrated to low elevations between October and November.
| Latin species name | Migration time, autumn 2022 | Downward migration temperature range, autumn 2022 (measured at 2100 m) | Appearance migration temperature range, autumn 2022 (measured at 1300 m) | Migration time, spring 2023 | Upward migration temperature range, spring 2023 (measured at 1300 m) | Appearance migration temperature range, spring 2023 (measured at 2100 m) |
|---|---|---|---|---|---|---|
| Phoenicurus auroreus | Sep–Nov | 12.2–7.9°C | 11.9–3.4°C | Mar–May | 9.8–13.9°C | 4.9–9.0°C |
| Pterorhinus lanceolatus | Sep–Nov | 12.2–7.9°C | 11.9–3.4°C | Mar–May | 9.8–13.9°C | 4.9–9.0°C |
| Motacilla alba | Sep–Nov | 12.2–7.9°C | 11.9–3.4°C | Mar–Apr | 9.8°C | 4.8°C |
| Parus monticolus | Sep–Oct | 12.2°C | 11.9°C | Mar–May | 9.8–13.9°C | 4.9–9.0°C |
| Phylloscopus ogilviegranti | Sep–Oct | 12.2°C | 11.9°C | Mar–May | 9.8–13.9°C | 4.9–9.0°C |
| Leiothrix lutea | Sep–Oct | 12.2°C | 11.9°C | Apr–May | 13.9°C | 9.0°C |
| Phoenicurus frontalis | Oct–Nov | 7.9°C | 3.4°C | Mar–Apr | 9.8°C | 4.8°C |
| Emberiza pusilla | Sep–Oct | 12.2°C | 11.9°C | N/A | N/A | N/A |
| Horornis acanthizoides | Sep–Oct | 12.2°C | 11.9°C | N/A | N/A | N/A |
| Ianthocincla ocellata | Sep–Oct | 12.2°C | 11.9°C | N/A | N/A | N/A |
| Phylloscopus proregulus | Sep–Oct | 12.2°C | 11.9°C | N/A | N/A | N/A |
| Trochalopteron elliotii | Oct–Nov | 7.9°C | 3.4°C | N/A | N/A | N/A |
| Motacilla cinerea | N/A | N/A | N/A | Mar–May | 9.8–13.9°C | 4.9–9.0°C |
| Culicicapa ceylonensis | N/A | N/A | N/A | Apr–May | 13.9°C | 9.0°C |
| Pericrocotus ethologus | N/A | N/A | N/A | Apr–May | 13.9°C | 9.0°C |
In spring, the upward migration temperature range of altitudinal migrants ranged between 9.8°C and 13.9°C at 1300 m (Table 3). The upward migration temperature in March was 9.8°C and 13.9°C in April. Besides, the appearance temperature range ranged between 4.9°C and 9.0°C at 2100 m. The appearance temperature was 4.9°C in April and 9.0°C in May. In addition, the upward migration temperature of the blue-fronted redstart (P. frontalis) and the white wagtail (Motacilla alba Linnaeus, 1758) was rather low (9.8°C). These were the only bird species that migrated to high elevations early, between March and April.
DISCUSSION
Altitudinal migrant analysis
Fifteen altitudinal migrant species were determined in our study. Six of these altitudinal migrant species were also recorded at Mt. Gongga (Hailuo Valley), namely the grey-headed canary-flycatcher (C. ceylonensis), the red-billed leiothrix [Leiothrix lutea (Scopoli, 1786)], the white wagtail (M. alba), the green-backed Tit (P. monticolus), the Pallas's leaf warbler (P. proregulus), and the Elliot's laughingthrush (T. elliotii, formerly known as Garrulax elliotii) (Cheng et al. 2022). Besides, four of our identified altitudinal migrant species were also recorded in the Gaoligong Mountains (Liang et al. 2021) and two of our identified altitudinal migrant species were additionally recorded on the island of Taiwan (Tsai et al. 2021).
However, the white wagtail (M. alba) and the Daurian redstart (P. auroreus) were labeled as non-altitudinal migrants in Haase et al. (2023) using a different kind of altitudinal migration formula. We obtained opposite results compared to this previous study though, since the altitudinal migration formulas we used were different. Our new altitudinal migration formula calculated the sum of the absolute difference of the monthly number of individuals of each bird species between low and high elevations for each survey month. Compared to that, the previous altitudinal migration formula calculated the sum of the relative absolute difference of the daily number of individuals of each bird species between spring and autumn at low and high elevations. Moreover, some bird populations may or may not conduct altitudinal migration (partial altitudinal migration) depending on climate factors and geographical location (Boyle 2017). Therefore, the above-mentioned bird species may migrate in one area and may not migrate in another area. We may also need to record data for more elevation ranges to get a more conclusive result.
Relationship between the altitudinal migration of birds and environmental factors
In this study, we assessed the influence of four environmental factors on the altitudinal migration of birds. Especially AT, AIB, and PFS had a strong influence on the altitudinal migration of birds because these factors had many significant correlations with the MNI of many species. Several studies conducted within the Hengduan Mountains (Liang et al. 2021; Cheng et al. 2022; Haase et al. 2023) have revealed a similar pattern, indicating this pattern could be widespread on a larger scale across the Hengduan Mountains.
AT had a significant positive correlation with the MNI. Therefore, increasing temperatures possibly induced upward migration of birds and vice versa. This is consistent with many previous studies (Chaves-Campos 2003; Morrissey et al. 2004; Tsai et al. 2021). Temperature is considered to be an important factor affecting altitudinal migration. The direct effect of unfavorable weather (low temperatures) is the increase in energetic costs of maintaining an optimal body temperature in birds. Therefore, birds tend to move to elevations with more favorable temperatures to increase fitness as they have the ability to fly to areas with more suitable temperatures (McCain 2009; Wu et al. 2013; He et al. 2019).
Additionally, AIB was significantly positively correlated with MNI and AT. When temperatures increase, invertebrates tend to migrate to or start hatching at higher elevations and vice versa (Araújo et al. 2022). Altitudinal migrant birds follow this migration trend, since globally, most altitudinal migrants are invertivores and omnivores (part of their diet consists of invertebrates) (Barçante et al. 2017). This means that, when temperatures increase, there is in turn more food available for birds (Supriya et al. 2019; Araújo et al. 2022). Cheng et al. (2022) furthermore found that omnivorous birds are more likely to exhibit downslope movements during autumn, implying that omnivorous birds track elevation bands with a high invertebrate biomass. Therefore, AIB likely is an important driver for the altitudinal migration of invertivores and also omnivores (Ghosh-Harihar & Price 2014; Katuwal et al. 2016; Barçante et al. 2017).
In addition, PFS was significantly positively correlated with MNI and AT. AT affects the seasonal photosynthetic activity (Tan et al. 2015) and thus affects the seasonal availability of PFS such as berries, flowers, and seeds. This means that, when temperatures increase, there is in turn more food available for nectarivorous, frugivorous, and omnivorous (part of their diet consists of PFS) bird species at higher elevations and vice versa (Hsiung et al. 2018). This hypothesis is backed by the MNI of four out of five omnivorous altitudinal migrant bird species in our study being positively correlated with PFS. Flowers (nectar) were most abundant during spring in April, which coincided with the appearance of the Mrs. Gould's sunbird [Aethopyga gouldiae (Vigors, 1831)] at 2100 m during April 2023. This species is an altitudinal migrant (Barçante et al. 2017; Liang et al. 2021). However, this was the only nectarivorous bird species recorded during our surveys. The availability of nectar at high elevations likely influenced the altitudinal migration of this bird species. Similar studies found that nectarivorous birds such as hummingbirds (Lopez-Segoviano et al. 2018) and Hawaiian honeycreepers (Warner 1968) track the availability of flowers at different elevations throughout the year. Moreover, several studies found that frugivorous birds track the availability of fruits at different elevations throughout the year as well (Solórzano et al. 2000; Kimura et al. 2001; Chaves-Campos 2004). Therefore, PFS likely influence the altitudinal migration of birds that consume PFS to some degree.
Besides, AH probably only played a minor role in influencing altitudinal migration, because it exhibited no significant correlations with the MNI. Humidity is high and rainfall is frequent in the Xiling Snow Mountains. Therefore, humidity is probably not an important limiting factor for the growth of plants and the occurrence of invertebrates in this area (Cusack et al. 2016). Compared to that, humidity is a limiting factor in arid regions, since water is crucial for the survival of animals in these areas (Fischer & Turner 1978).
On a further note, the study area was rather small, and only two study sites were surveyed due to the remaining terrain being too steep and inaccessible. Setting up more study areas and study sites would be beneficial for recording more data and being able to compare the altitudinal migration of birds of several study areas with each other.
Migration temperature range and time
Last but not least, our results demonstrated that altitudinal migrant species displayed a variety of migration times and migration temperature ranges. Furthermore, it looks like Elliot's laughingthrush (T. elliotii), the blue-fronted redstart (P. frontalis), and the white wagtail (M. alba) are more resistant to cold and migrate to high elevations earlier and down to low elevations later compared to other altitudinal migrant species which we recorded since they initiated altitudinal migration at lower temperatures ranging from 8°C to 10°C.
Conservation suggestions
Low elevations in the Xiling Snow Mountains (1300 m) are located in the evergreen broad-leaf forest and agroforestry belt. The number of species and individuals at 1300 m was higher compared to 2100 m during late autumn and early spring. This implies that low elevations are an important overwintering place for most altitudinal migrant species (Liang et al. 2021; Haase et al. 2023). However, due to agricultural and grazing activities and a rather high human population at low elevations, the migration of birds may be disturbed. Moreover, the local nature reserve does not cover low elevations. Therefore, low-elevation areas require more conservation attention because these areas are threatened much more by anthropogenic activities in general compared to high elevations (Martin et al. 2007; Wade et al. 2013). Land use regulation and forest protection could be two efficient protective measures to protect birds and the environment.
Besides, there is a sightseeing spot and ski resort with several hotels at 2100 m in the Xiling Snow Mountains. This area is located in the evergreen broadleaf and deciduous broadleaf mixed forest belt. Due to frequent tourism activities, the migration of altitudinal migrants is being disturbed as well, especially since high elevations are an important breeding location for altitudinal migrants. For example, Boyle and Martin (2015) found that 35% of North America's breeding birds use high elevations as a breeding ground. Furthermore, the number of individuals at 2100 m was higher compared to 1300 m during early autumn and late spring. As a result, high elevations also require more conservation attention. Conservation measures could limit tourism activities to walkways, and trash should be properly disposed of in trash cans along these walkways to protect the environment. Loud noise from tourists and vehicles should be limited as much as possible.
CONCLUSIONS
Our study presents high-quality novel data about the local bird community composition in the Xiling Snow Mountains, the altitudinal migration behavior of birds and their relationship with four environmental factors, and the migration temperature range and time of altitudinal migrants. Fifteen altitudinal migrants were identified in our research. Increasing temperatures, an increasing invertebrate biomass, and an increasing amount of plant food sources probably induced upward migration of altitudinal migrant bird species and vice versa. Humidity perhaps only played a minor role in influencing altitudinal migration. Moreover, we found that the upward migration temperature range of altitudinal migrants ranged between 9.8°C and 13.9°C during spring and the downward migration temperature range ranged between 12.2°C and 7.9°C during autumn. To sum up, our study and several other studies revealed that the same environmental factors influenced the altitudinal migration patterns of birds in the Hengduan Mountains.
ACKNOWLEDGMENTS
We thank Zhengwei Liu for his help in designing the initial study. We thank Shuqiao Wang and Tianjiao He for their kind assistance with the fieldwork. We thank Jinbo Tan for his kind help with identifying plants. We thank Jianghong Ran and Chao Duan from Sichuan University and Mingjian Pang from Dayi Nature Protection Station and Giant Panda National Park Chengdu District for their kind support in getting a permit for being able to study in the Xiling Snow Mountains. This study was financially supported by the National Natural Science Foundation of China (No. 32270454), the Second Tibetan Plateau Scientific Expedition and Research Program (No. 2019QZKK0501), the Survey of Wildlife Resources in Key Areas of Tibet (ZL202203601), and the Fundamental Research Funds for the Central Universities. The funding sources had no influence on the study. All animal research procedures strictly complied with the P. R. China Legislation on the Use and Care of Laboratory Animals and were approved by the Animal Care Review Committee, College of Life Sciences, Sichuan University, China (Nos. SCU2203019 and SCU230303013).
CONFLICT OF INTEREST STATEMENT
The authors declare no conflict of interest.


