Flight or fight: different strategies of intertidal periwinkle Littoraria sinensis coping with high temperature across populations
Abstract
Intertidal organisms usually live near their upper thermal limits, and are vulnerable to future global warming. As a vital response to thermal stress, thermoregulatory strategy in physiological and behavioral performance is essential for organisms coping with thermal stress and surviving the changing world. To investigate the relationship between the thermoregulatory strategy and habitat temperature, in the present study, we comparatively investigated the thermal responsive strategy among different geographic populations of the supralittoral snail Littoraria sinensis by determining snails’ cardiac function and behavioral performance. Our results indicated that populations inhabiting high ambient temperatures had higher sublethal temperatures (i.e. Arrhenius breakpoint temperatures, ABTs, the temperature at which the heart rate shapely decreases with further heating) and lethal temperatures (i.e. Flatline temperatures, FLTs, the temperature at which heart rate ceases), and behaved less actively (e.g. shorter moving distances and shorter moving time) in the face of high and rising temperatures—a physiological fight strategy. On the other hand, populations at relatively low ambient temperatures had relatively lower physiological upper thermal limits with lower ABTs and FLTs and moved more actively in the face of high and rising temperatures—a behavioral flight strategy. These results demonstrate that the thermoregulatory strategies of the snails are closely related to their habitat temperatures and are different among populations surviving divergent thermal environments.
INTRODUCTION
Temperature is one of the most important factors that affect the survival, physiology, behavior, and geographic distribution of animals in their natural habitats (Somero 2002, 2005, 2010; Harley et al. 2006; Freeman et al. 2018; Liao et al. 2021; Skendžić et al. 2021). Climate changes in the oceans are projected to yield an average increase of 1–6°C in sea surface temperature by 2100 (Braun et al. 2023) and provide a synthesis of profound consequences (Nagelkerken & Munday 2016; Arora 2019; Yu et al. 2022), by increasing physiological stress and causing behavioral shifts as animals seek habitats that meet their thermal niche requirements (Woods et al. 2015; Kay et al. 2021).
When animals experience a threat, they are faced with the choice to stay and fight or to flee, and most animals exhibit a “flight or fight” strategy (Hertz et al. 1982; Adamo et al. 1995; McCarty 2016; Kay et al. 2021). This reaction, first described by Cannon in 1929 (McCarty 2016), involves a series of neural and physiological mechanisms that rapidly activate the body to confer the threat (fight) or to escape it (flight) (Kay et al. 2021). The thermoregulatory strategy is a process activated by the sympathetic nervous system through the release of the catecholamines epinephrine and norepinephrine in vertebrates or the related biogenic amines in invertebrates (Jansen et al. 1995; Fuller et al. 2010). This process controls involuntary bodily functions, such as breathing, digestion, heart rate, and behavior (Jansen et al. 1995; Fuller et al. 2010). Ultimately, thermoregulatory strategy influences the choice of flight or fight response, leading animals to take action in response to environmental stress (de Barros et al. 2010). A conceptual model generated from studies of intertidal littorinid snails suggests that thermoregulatory strategies of flight and fight may allow individuals to widen their thermal safety margin under warming or cooling environmental conditions, thereby enhancing species’ resistance to climate change (Ng et al. 2017). From behavior, littorinid snails were found to have various flight and fight behaviors (Chapperon et al. 2013; Rojas et al. 2013; Seuront & Ng 2016; Ng et al. 2017). Littorinids can adopt a flight strategy, such as refuge selection, to maintain their body temperatures below upper thermal limits (up to ∼11°C in some situations) during warm periods (Marshall et al. 2013). They can also adopt a fight strategy, such as adjusting their shell orientation to minimize solar gain (Muñoz et al. 2005). Different strategies come with different energetic costs (Cooper & Frederick 2007). When the potential risk of staying exceeds the cost of fleeing, the animal should flee (Ydenberg & Dill 1986; Cooper & Frederick 2007). Additionally, threats can affect the intensity and duration of the animal's response (Beckmann et al. 2004; Suraci et al. 2019).
To cope with their harsh environment, which is affected by stress from both terrestrial and marine thermal conditions, intertidal species have developed a set of physiological or behavioral strategies to alleviate the consequences of climate change to avoid being the victims of the changing world (Williams et al. 2016; Ng et al. 2017; Zhang et al. 2021). The intertidal community has long been considered an ideal model system for studying the impacts of temperature on species’ strategies, and studies have confirmed that intertidal animals use different strategies for thermoregulation, such as physiological and behavioral approaches (Muñoz et al. 2005; Ng et al. 2017; Lagos et al. 2021; Liao et al. 2021).
Intertidal organisms have to invest energetic costs for physiologically coping with thermal stress and then evolve a variety of physiological responses (Somero 2002; Tomanek & Helmuth 2002; Tomanek & Somero 2002; Lagos et al. 2021). Physiological plasticity is one of the most important mechanisms to cope with ambient temperature changes in intertidal organisms (Hofmann & Todgham 2010; Dong et al. 2022; Dong 2023), allowing them to maintain normal physiological performance and survive when subjected to the harsh environment (Jarrold et al. 2013; Gaitán-Espitia et al. 2017). For instance, populations of Echinolittorina malaccana living in hotter environments have higher heat tolerance plasticity than those from cooler coastal areas (Brahim et al. 2019). In addition, organisms can adjust the shape of temperature performance curves in response to the local thermal environment (Villeneuve et al. 2021; Buckley et al. 2022; Zhang et al. 2023). Thus, physiological adaptation is crucial for organisms to deal with changing environmental conditions and determines whether they are “winners” or “losers” of climate change (Somero 2010; Hoffmann & Sgrò 2011; Dong et al. 2022).
Behavioral thermoregulation usually uses less energy and is an effective thermoregulatory response (Bicego et al. 2007; Rey et al. 2015; Rangel-Patiño et al. 2020). For example, lizards regulate their body temperature by adjusting behaviors such as activity time, which tends to cost less (Huey 1974). Temperature not only affects the execution of behaviors but also determines whether a particular behavior is exhibited or which behavior from a range of possibilities is performed in a given situation (Dell et al. 2011; Abram et al. 2017). Intertidal snails use foot retraction and aggregation formation to buffer thermal stress and also adjust the shell posturing to reduce body temperature (Miller & Denny 2011; Marshall & Chua 2012; Stafford et al. 2012; Chapperon et al. 2013; Ng et al. 2017). In addition, snails’ movement activity tracked using radios was affected by thermal stress (Hayford et al. 2018). The behavioral process of organisms depends on a set of biochemical effects that propagate in a bottom-up manner to affect the speed of cells, organs, and systems (e.g. muscular, nervous, and digestive) (Abram et al. 2017). The temporal gradient of these biochemical effects can be classified as short-term effects, with rapid changes in metabolism within seconds or minutes; medium-term effects, with reversible effects on physiological states over hours, days, or weeks; and long-term effects, passed down through generations via genetic inheritance (Frazier et al. 2008; Angilletta 2009; Becher et al. 2009; Katsuki & Miyatake 2009; Abram et al. 2015; Cavieres et al. 2016). In the view of ecological benefits, organisms strive for maximum ecological benefit, that is, to obtain the highest survival rate and reproduction outputs, and it is potentially costly for organisms to act in an un-stressful environment with an energy-expensive risky response (Bradshaw et al. 2004; Roth et al. 2010; Shepard et al. 2013; Elliott et al. 2014; Meuthen et al. 2019; Moyen et al. 2020). In the face of environmental stressors, there are trade-offs between physiological performance and behavioral response due to energy allocation constraints (Grant 1990; Garland Jr et al. 2022).
The supralittoral snail Littoraria sinensis is widely distributed in the intertidal zone and can tolerate a high temperature of over 45°C (Dong et al. 2017). Previous studies showed that high temperatures can affect this species' distribution and movement patterns (Garner et al. 2017; Reis et al. 2021; Krull & Newman 2022). In the present study, we determined the cardiac performance and movement patterns of the snail L. sinensis in high temperatures and compared the responsive strategy across populations to test the hypothesis: Living in different thermal environments, the intertidal snail exhibits divergent strategies for coping with high temperatures. So, we predict that for the populations living in high temperatures and encountering frequent thermal stress, snails may exhibit higher physiological upper thermal limits and opt to be less active in the face of high and rising temperatures—a physiological fight strategy. On the contrary, for populations living in relatively benign thermal environments and meeting less thermal stress, snails may exhibit lower physiological upper thermal limits and move actively to escape thermal stress in high and rising temperatures—a behavioral flight strategy. This study sheds light on the importance of the integrative approach combining physiological and behavioral data for investigating how intertidal snails cope with harsh environments on the rocky shore.
MATERIALS AND METHODS
Animal collection and acclimation
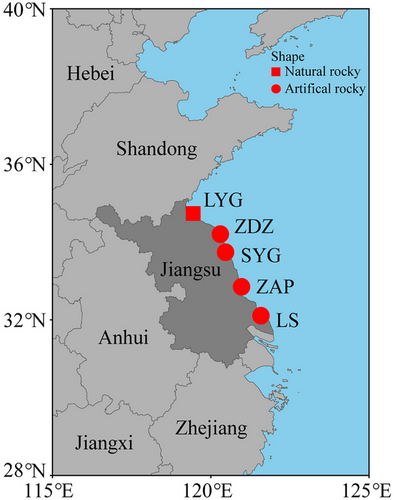
The snails L. sinensis were collected from sun-exposed rocky surfaces across five geographical populations along the China's coastline in August 2022 (Fig. 1), including one population on natural rocky shore (Lianyungang, LYG: 34°45′N, 119°22′E) and four populations on artificial rocky shore (Zhendongzha, ZDZ: 34°21′N, 120°30′E; Sheyanggang, SYG: 33°48′N, 120°28′E; Zhonganpeng, ZAP: 32°51′N, 120°58′E; Lvsi, LS: 32°06′N, 121°35′E).
After collection, all snails were transported back to the laboratory to perform common garden acclimation for 2 months, a period likely to be adequate to remove past thermal history (Wang et al. 2022). During acclimation, the snails were then distributed into plastic boxes (∼30 individuals in each, 15 cm length × 9 cm width × 6 cm height) containing a rock (70–100 cm3) with biofilms attached for food and cultured in an artificial climate chamber (HLT350B, Shanghai LNB Instrument, China) at a temperature of 25 ± 1°C, humidity of 40%, photoperiod of 12 h light: 12 h dark. The artificial climate chamber's temperature was used to simulate the annual average seawater temperature (∼25.5°C) in the East China Sea (Wu et al. 2020). Snails were sprayed with fresh seawater for 5 s daily during the acclimation period and immersed in seawater for 1 h every 3 days. During immersion, concentrated Chlorella was provided as food.
Body temperature data simulation
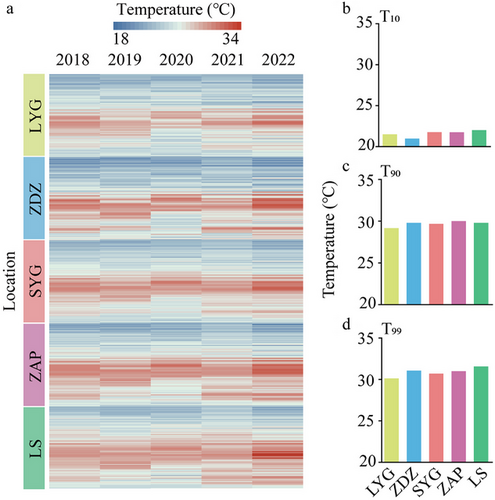
An improved version of the heat budget model (HBM) for snails that takes into account the biological morphology, the height of species’ habitat, and microclimate variables was used to calculate the hindcasted body temperatures of L. sinensis (Marshall et al. 2015; Dong et al. 2017). The HBM is a biophysical model based on the habitat characteristics of wild snails, which can predict the body temperatures in a steady state by heat transfer balance (Helmuth 1998, 1999; Choi et al. 2019). Climate data, including air temperature at 2-m height, sea surface temperature, wind speed at 10-m height, downward shortwave radiation, and cloud cover, were extracted from the National Centers for Environmental Prediction Climate Forecast System Reanalysis at a resolution of 0.205° × ∼0.204°× (around 23 × 23 km) (Saha et al. 2010, 2011). We chose this database because its effectiveness in predicting body temperatures of intertidal organisms using HBM has been confirmed (Mislan & Wethey 2011). Tidal height was calculated using the Tide Model Driver, and significant wave height was roughly calculated using Wilson's formula (Goda 2003; Erofeeva et al. 2020). As L. sinensis is the species living in the high intertidal zone, we set its habitat height to the average height of Mean Higher High Water and Mean Higher Low Water levels at the local site. Biological morphologies were measured following Miller's method (Miller 2008). ImageJ is used to analyze the shell length, surface area, maximum projected area, and substrate contact area of L. sinensis. HBM was used to estimate the body temperature of L. sinensis in sun-exposed habitats across five geographical populations in summer (July–September) from 2018 to 2022. The extremely low body temperatures were defined as the 10th percentile of average daily body temperature (T10); the extremely high body temperatures were defined as the 90th percentile of average daily body temperature (T90) and the 99th percentile of average daily body temperature (T99), which have been used in other studies (Gong et al. 2004). T10, T90, and T99 were used to represent extreme temperature values to reduce the influence of external environmental factors or short-term extreme events (Helmuth et al. 2002; Aswathy et al. 2015; Liao et al. 2021).
Physiological performance measurements
Cardiac function was determined by calculating the upper thermal limits of the intertidal snails as previous studies described (Stenseng et al. 2005; Han et al. 2013; Liao et al. 2021; Chan et al. 2022; Dong et al. 2022). In the present study, the heart rate of each snail was measured by using a non-invasive method (Dong et al. 2017; Chan et al. 2022; Hui et al. 2022; Wang et al. 2022). After acclimation, 40 individuals with similar body sizes (∼0.12 ± 0.10 g in total wet weight; ∼5.65 ± 1.02 mm in shell length; ∼5.31 ± 1.08 mm in shell width; ∼8.54 ± 1.91 mm in shell height) from each geographical population were randomly selected for heart rate measurements. An infrared sensor (IREX, Newshift, Portugal) attached to the snail shell at a position above the heart with the Blu-Tack adhesive (Bostik, Staffordshire, UK), then transmitted the heartbeat data through a signal amplifier (AMP03, Newshift, Portugal) to PowerLab AD converter (8/30, ADInstruments, Australia). The experimental temperature was increased from 25°C (acclimation temperature), controlled by using a water bath (TXF150, Grant, UK) at a rate of 0.1°C min−1 in air until the heartbeat fell to zero. The heating rate was to simulate the in situ average ramping rate in summer (Dong et al. 2017; Wang et al. 2023). Heartbeats were viewed and analyzed using LabChart v7 (ADInstruments, Australia); additionally, they were cross-verified manually to ensure accuracy (Dong et al. 2017; Chan et al. 2022; Hui et al. 2022; Wang et al. 2022). The Arrhenius breakpoint temperature (ABT) was calculated by linear regression of the temperature where the heart rate shapely decreased with further heating in Origin v9 (OriginLab Corp, MA, USA); the temperature corresponding to the cessation of heartbeats was considered as flatline temperature (FLT) (Dong et al. 2017; Hui et al. 2022; Wang et al. 2023; Tan et al. 2023).
Behavioral performance measurements
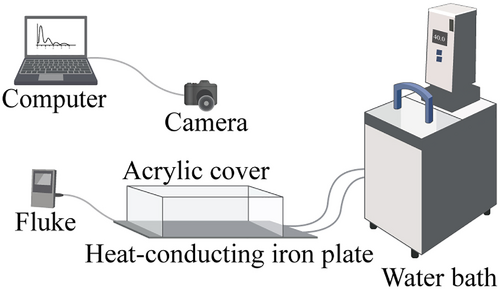
The test set-up consisted of a temperature sensor and a water bath (TXF150, Grant, UK) connected to it through an inlet and an outlet pipe and a heat-conducting iron plate (33 cm length × 25 cm width × 0.1 cm thickness) tightly covered in aluminum foil (616CF, Reynolds, America), a custom-built opaque acrylic wall above (30 cm length × 20 cm width × 10 cm height), and wire mesh (wire mesh with 0.4 cm square apertures made of 0.1 cm thick wire) around the inner sides of the cover for preventing the upward climbing. A top-view digital camera (920 Pro Webcam, 30 fps, 720 p, Logitech, Newark CA) was used to record the movement of the snails, and a thermal couple (54IIB, Fluke, USA) attached to the heat-conducting iron plate was used to monitor temperatures (Fig. 4).
Snails from each geographical population were randomly divided into control and heating treatment. In the control treatment, the device temperature was maintained at 25 ± 1°C. In the heating group, the device temperature increased from 25°C to the average ABT corresponding to the same geographical population at a rate of 0.1°C/min. Before recording, 3 mL of seawater at 25 °C was evenly poured onto aluminum foil, and then 10 snails (simulating its normal density in natural habitats) were randomly selected from the same geographical population and placed on this aluminum foil with the shells facing downward and treated in the control group. The heating group was treated using the same process. The behavior of snails from the same geographic population was measured in the order of control and heating treatments within each day, and then snails from each geographic population were measured sequentially for 1 day in the geographic order of LYG, ZDZ, SYG, ZAP, and LS between each day. After measuring all five geographical populations, assessments were conducted again in the geographical order. Snails’ movement patterns were recorded continuously, and the recording duration for the control and heating groups was kept consistent. There were 20 replicates for each geographical population in the control treatment (10 replicates for SYG and ZAP), with a total of 80 individuals, and 20 replicates for each geographical population in the heating group, with a total of 100 individuals. All snails had similar body sizes (∼0.13 ± 0.99 g in total wet weight; 5.45 ± 1.07 mm in shell length; 8.76 ± 1.94 mm in shell width; 8.76 ± 0.01 mm in shell height) from each population and were selected randomly for the behavioral measurement.
-
Movement distance: the total distance in movement during determination (cm);
-
Movement time: the total time spent in movement (s);
-
Movement velocity: the average velocity during movement (cm s−1);
-
Temperature of motion cessation: the temperature at which snails in the heating treatment stop movement for up to 5 min and do not move again (°C).
Statistical analysis
In the physiological part, cardiac performance curves were generated by fitting data with an exponentially modified Gaussian (Angilletta 2006), presented through a generated additive mix modeling, where the temperature was the independent variable and heart rate of all individuals within each population corresponding to temperature was the dependent variable. Generalized additive modeling (GAM) was used to analyze the differences in cardiac performance curves among different sites (Angilletta et al. 2013). The above methods were carried out in R v3.4 (R Core Team 2020) with the packages mgcv and nlme (Wood 2012; Pinheiro 2009). Since both ABT and FLT data conform to the assumption of homogeneity of variance (Levene's test, P > 0.05), ABT data met a normal distribution (Shapiro–Wilk test, P > 0.05), while FLT data did not (Shapiro–Wilk test, P < 0.05). Differences in ABT among five sites were analyzed with one-way ANOVA, and differences in FLT among five sites were analyzed with Kruskal–Wallis test analysis using SPSS 25 (SPSS, Chicago, IL, USA).
Differences in behavioral variables between treatments and locations were analyzed using two-way ANOVA with Tukey's post hoc analysis, and the difference in temperature of motion cessation between five sites in heating treatment was analyzed using the Kruskal–Wallis test. A generalized linear mixed model (GLMM) was used to analyze the relationship between physiology and behavior under different body temperatures, with physiology or behavior and their interactions with T99 (99th percentile of average daily summer body temperatures for 2018–2022) as fixed effects and location as a random effect. Two-way ANOVA and Kruskal–Wallis test were conducted in SPSS 25 (SPSS, Chicago, IL, USA). GLMM was carried out in R v3.4 (R Core Team 2020) with packages lme4 (Bates et al. 2014).
RESULTS
Body temperature
The summer (July–September) average daily body temperatures of L. sinensis from 2018 to 2022 revealed a highly variable thermal mosaic with a latitudinal distribution pattern (Fig. 2a). In particular, ZDZ recorded the lowest T10 of 22.11°C, and LS has the highest T10 of 23.62°C (Fig. 2b); ZAP recorded the highest T90 of 29.84°C and LS recorded the highest T99 of 32.64°C; LYG has the lowest T90 and T99 with 28.66°C and 30.48°C, respectively (Fig. 2c,d). The values of the difference between T99 and T10 represent the fluctuation level in summer average daily body temperatures between 2018 and 2022, with the values for LYG, ZDZ, SYG, ZAP, and LS being 7.56°C, 9.96°C, 7.76°C, 8.96°C, and 9.00°C, respectively. These results suggested that the northmost population (LYG) experienced relatively low-temperature stress, ZDZ experienced relatively low and highly variable temperature stress, and SYG ZAP and LS experienced relatively high-temperature threats.
Differences in cardiac performance among populations
All individuals shared a similar pattern of heart rate response when the temperature increased from 25°C to the temperature at which the heart rate ceased. GAM results indicated that the cardiac performance curves differed among populations (F = 10.92, P < 0.01; Fig. 3a). There were significant differences in ABTs (one-way ANOVA, F4,140 = 10.857, P < 0.0001; Table 1 and Fig. 3b), and the southern populations (SYG, ZAP, and LS) presented relatively higher ABTs compared to the two northern populations (LYG and ZDZ).

| ABT | FLT | ||
|---|---|---|---|
| Homogeneity of variance | L4,135 = 0.683 | L4,135 = 0.723 | |
| P = 0.605 | P = 0.578 | ||
| Normality | LYG | N22 = 0.969 | N22 = 0.903 |
| P = 0.679 | P = 0.034 | ||
| ZDZ | N29 = 0.973 | N29 = 0.915 | |
| P = 0.647 | P = 0.023 | ||
| SYG | N34 = 0.958 | N34 = 0.939 | |
| P = 0.218 | P = 0.058 | ||
| ZAP | N32 = 0.978 | N32 = 0.929 | |
| P = 0.759 | P = 0.036 | ||
| LS | N23 = 0.946 | N23 = 0.930 | |
| P = 0.247 | P = 0.110 | ||
| Multiple comparisons | LYG–ZDZ | P = 0.684 | P = 0.234 |
| LYG–SYG | P = 0.024* | P = 1.000 | |
| LYG–ZAP | P = 0.000*** | P = 1.000 | |
| LYG–LS | P = 0.000*** | P = 1.000 | |
| ZDZ–SYG | P = 0.004** | P = 0.037* | |
| ZDZ–ZAP | P = 0.000*** | P = 0.018* | |
| ZDZ–LS | P = 0.000*** | P = 0.010** | |
| SYG–ZAP | P = 0.101 | P = 1.000 | |
| SYG–LS | P = 0.005** | P = 1.000 | |
| ZAP–LS | P = 0.184 | P = 1.000 | |
- Significant differences (P < 0.05) are indicated with *, significant differences (P < 0.01) are indicated with **, and significant differences (P < 0.001) are indicated with ***. LYG, Lianyungang; ZDZ, Zhendongzha; SYG, Sheyanggang; ZAP, Zhonganpeng; LS, Lvsi.
FLTs were also significantly different among the five populations (Kruskal–Wallis test, H4,140 = 14.696, P = 0.005; Table 1 and Fig. 3c), and significant differences in FLT were found between ZDZ and three southern populations (Kruskal–Wallis test, SYG, P = 0.037; ZAP, P = 0.018; and LS, P = 0.010).
Differences in behavioral performance among populations
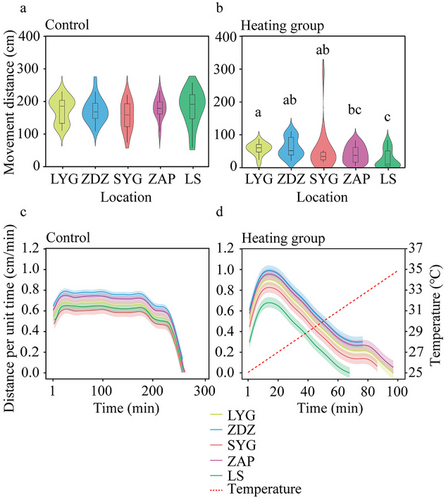
There were significant differences in movement distance (Tukey's post hoc analysis, P < 0.000), movement time (Tukey's post hoc analysis, P < 0.000), and movement velocity (Tukey's post hoc analysis, P < 0.05) between control and heating treatment. Specifically, in the heating treatment, the LS population presented a relatively smaller movement distance compared to the two northern populations (LYG and ZDZ) (Tukey's post hoc analysis, LYG, P < 0.000; and ZDZ, P < 0.000; Fig. 5b) and ZAP presented relatively lower movement distance compared to LYG (Tukey's post hoc analysis, P = 0.038; Fig. 5b). For distance moving per min, control treatment was maintained in motion for a prolonged period, with minimal variation in values at each site (Fig. 5c). In contrast, the heating treatment exhibited a pattern of initially increasing and then decreasing activity, with peak values corresponding to temperatures around 26.5°C (Fig. 5d).
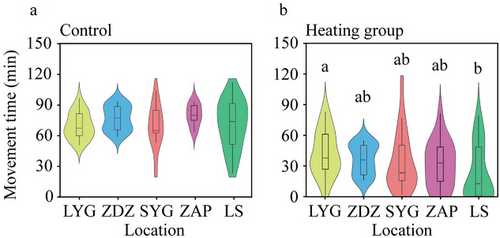
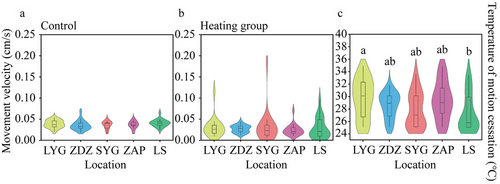
In the heating treatment, the LS population exhibited significantly shorter movement time compared to the LYG population (Tukey's post hoc analysis, P = 0.009; Fig. 6b), but there was no difference in the movement velocity across different populations (two-way ANOVA, F4,170 = 0.392, P = 0.814; Fig. 7b). The temperature of motion cessation in the heating treatment also varied across populations (Kruskal–Wallis test, H4,100 = 10.177, P = 0.038; Fig. 7c), and that of the LS population was significantly shorter than the LYG population (Kruskal–Wallis test, P = 0.043).
The results of GLMM showed that physiological performance was significantly influenced by behavioral performance and the interaction with T99, and behavioral performance was significantly influenced by physiological performance, T99, and the interaction between them (Table 2). In particular, the FLTs of snails were significantly affected by movement distance, movement time, and the interaction between movement distance and T99 (PMovement distance = 0.002, PMovement time = 0.029, PMovement distance×T99 = 0.002; Table 2); the movement velocity of snails was significantly affected by ABT, FLT, T99, and the interaction between FLT and T99 (PABT = 0.024, PFLT = 0.000, PT99 = 0.009, PFLT×T99 = 0.000; Table 2).
| Response variable | ||||||
|---|---|---|---|---|---|---|
| Physiological performance | Behavioral performance | |||||
| ABT | FLT | Dist | Time | Velo | ||
| Factors | ABT | β = −22.760 | β = −1639.220 | β = −0.093 | ||
| P = 0.762 | P = 0.563 | P = 0.024* | ||||
| FLT | β = 175.686 | β = 1245.340 | β = 0.210 | |||
| P = 0.080 | P = 0.741 | P = 0.000*** | ||||
| Dist | β = 0.361 | β = 0.526 | ||||
| P = 0.144 | P = 0.002** | |||||
| Time | β = −0.011 | β = −0.012 | ||||
| P = 0.177 | P = 0.029* | |||||
| Velo | β = 94.75 | β = 90.010 | ||||
| P = 0.813 | P = 0.747 | |||||
| T99 | β = −0.218 | β = −0.184 | β = 236.862 | β = −27.550 | β = 0.178 | |
| P = 0.689 | P = 0.564 | P = 0.055 | P = 0.964 | P = 0.009** | ||
| ABT × T99 | β = 0.585 | β = 43.220 | β = 0.002 | |||
| P = 0.781 | P = 0.585 | P = 0.318 | ||||
| FLT × T99 | β = −5.054 | β = −36.290 | β = −0.006 | |||
| P = 0.073 | P = 0.732 | P = 0.000*** | ||||
| Dist × T99 | β = −0.010 | β = −0.002 | ||||
| P = 0.146 | P = 0.002** | |||||
| Time × T99 | β = 0.000 | β = 0.000 | ||||
| P = 0.185 | P = 0.026 | |||||
| Velo × T99 | β = 3.054 | β = 3.073 | ||||
| P = 0.793 | P = 0.703 | |||||
- Significant differences (P < 0.05) are indicated with *, significant differences (P < 0.01) are indicated with **, and significant differences (P < 0.001) are indicated with ***. T99 represents the 99th percentile of average daily summer body temperatures for 2018–2022. Dist, Time, and Velo are abbreviations of movement distance, movement time, and movement velocity, respectively. The location represents the five sampling sites: Lianyungang, Zhendongzha, Sheyanggang, Zhonganpeng, and Lvsi. ABT, Arrhenius breakpoint temperature; FLT, Flatline temperature.
DISCUSSION
Physiological and behavioral adaptations are vital in organisms’ resilience to environmental stresses. Behavioral adaptation is the first line of defense against extreme environments (Ng et al. 2017; Campbell et al. 2018), while physiological adaptation is another rapid response to environmental changes (Ruthsatz et al. 2022). In the present study, the southern populations (SYG, ZAP, and LS) frequently faced thermal stress, and these populations exhibited higher upper thermal limits and were behaviorally inactive when confronting high and rising temperatures, namely a physiological fight strategy. On the contrary, the northern populations (LYG and ZDZ) faced relatively less thermal stress, and these populations exhibited lower physiological upper thermal limits and were more active in the face of high and rising temperatures, namely a behavioral flight strategy. These results implied that trade-offs potentially occur when organisms cannot optimize multiple traits simultaneously (Kelly et al. 2016; Agrawal 2020). By adjusting their physiology and behavior, intertidal snails can maximize the utilization of energy resources and improve energy efficiency (Dunham et al. 1989; Agrawal 2020; Kirk et al. 2023). In other words, the thermoregulation of the snail L. sinensis is closely related to a trade-off between physiological and behavioral response.
Survival of intertidal organisms largely depends on local environmental temperature and organisms’ physiological performance (Hochachka & Somero 1984; Gunderson & Leal 2015; Haines et al. 2017; Dong et al. 2022). Latitudinal and vertical patterns of species’ distributions often reflect gradients or discontinuities in environmental temperatures, together with physiological tolerance (Somero 2002; Somero et al. 2017). Physiological tolerance of intertidal organisms to high temperatures does not show a simple linear relationship through latitude but exhibits a mosaic distribution pattern (Helmuth et al. 2006; Place et al. 2008; Helmuth 2009; Logan et al. 2012). Many species in the intertidal zone have demonstrated a clear relationship between upper-temperature tolerance and maximum habitat temperature (Tomanek & Somero 1999; Stillman 2002; Miller 2008; Lockwood & Somero 2011). For example, the cardiac function of Mytilus californianus from the northernmost region of the west coast of the United States exhibited a significant decrease compared to other populations in the low-latitude populations (Logan et al. 2012). Similarly, intertidal organisms from tropical Roebuck Bay have higher upper thermal limits than organisms from the temperate Wadden Sea (Compton et al. 2007). These studies indicate that organisms living in different geographic populations of the intertidal zone have diverse physiological tolerances that enable them to survive local thermal environments. In the present study, the southern populations of L. sinensis have higher ABTs than the northern populations, implying that different populations exhibited different physiological tolerance, which is potentially related to local thermal environments.
Behavioral thermoregulation provides opportunities to escape or avoid unfavorable conditions to maximize populations’ fitness (Huey & Tewksbury 2009; Somero 2010; Huey et al. 2012; Sunday et al. 2014) and plays a crucial role in maintaining intertidal organisms’ homeostasis (Somero 2010). In particular, for individuals within geographically localized populations that grow near their physiological upper thermal limits, maximizing their adaptability may depend on expressing the optimal behavior under any given condition (Hui & Williams 2021). For example, in tropical populations, the littorinids point their shells toward the sun to reduce the body surface area exposed to sunlight and thus minimize the heat gained through the absorption of solar radiation (Muñoz et al. 2005). In addition, the thermoregulatory behavior of snails also includes reducing activity, possibly to avoid desiccation driven by the need to reduce water loss, which helps regulate body temperature and mitigate heat stress.
The behavioral buffering strategy associated with temperature may vary among populations (Deutsch et al. 2008; Huey & Tewksbury 2009). Animal's behavioral strategy depends on the environment and individuals make trade-offs based on the environment before deciding to choose the behavior that can obtain the greatest ecological benefits (Kendal et al. 2005; Franks et al. 2013; Agrawal 2020). Most animals minimize exposure to thermal stress by varying the proportion of time spent in activity and inactivity depending on the intensity of thermal stress (Williams & Little 2007). It follows that snails respond to thermal habitats about their mobility and can be classified as either “flight” or “fight” (McMahon 2001; Muñoz et al. 2005). In the present study, the behavioral performance of the snail L. sinensis showed that snails exhibited a free movement pattern in favorable environments without thermal stress, where they can move farther and longer. In the face of thermal stress, southern populations were less active and tended to quickly cease movement but had higher physiological upper thermal limits, likely exhibiting a physiological fight strategy. In contrast, northern snails were relatively more active, which exhibited a behavioral flight strategy. Additionally, snails' physiological and behavioral performance interacted with each other, and there was a trade-off between physiological and behavioral responses. These results indicate that L. sinensis can exhibit divergent strategies corresponding to ambient temperature.
In summary, the intertidal periwinkle L. sinensis exhibited population-specific physiological and behavioral responses. The snails inhabiting high ambient temperatures have a higher physiological upper thermal limit and are less active in the face of thermal stress, exhibiting a physiological fight strategy, while the snails inhabiting lower ambient temperatures have a relatively low physiological upper thermal limit and are more active encountering thermal stress, exhibiting a behavioral flight strategy.
ACKNOWLEDGMENTS
The authors express their gratitude to the volunteers who assisted with snail collection. This work was supported from the National Natural Science Foundation of China (42025604) and the Fundamental Research Funds for the Central University.
CONFLICT OF INTEREST STATEMENT
The authors have no conflict of interest to declare.


