Multi-omics reveal the gut microbiota-mediated severe foraging environment adaption of small wild ruminants in the Three-River-Source National Park, China
Abstract
The Tibetan antelope (Pantholops hodgsonii), blue sheep (Pseudois nayaur), and Tibetan sheep (Ovis aries) are the dominant small ruminants in the Three-River-Source National Park (TRSNP). However, knowledge about the association between gut microbiota and host adaptability remains poorly understood. Herein, multi-omics sequencing approaches were employed to investigate the gut microbiota-mediated forage adaption in these ruminants. The results revealed that although wild ruminants (WR) of P. hodgsoni and P. nayaur were faced with severe foraging environments with significantly low vegetation coverage and nutrition, the apparent forage digestibility of dry matter, crude protein, and acid detergent fiber was significantly higher than that of O. aries. The 16s rRNA sequencing showed that the gut microbiota in WR underwent convergent evolution, and alpha diversity in these two groups was significantly higher than that in O. aries. Moreover, indicator species, including Bacteroidetes and Firmicutes, exhibited positive relationships with apparent forage digestibility, and their relative abundances were enriched in the gut of WR. Enterotype analysis further revealed that enterotype 1 belonged to WR, and the abundance of fatty acid synthesis metabolic pathway-related enzyme genes was significantly higher than enterotype 2, represented by O. aries. Besides, the metagenomic analysis identified 14 pathogenic bacterial species, among which 10 potentially pathogenic bacteria were significantly enriched in the gut microbiota of O. aries. Furthermore, the cellulolytic strains and genes encoding cellulase and hemicellulase were significantly enriched in WR. In conclusion, our results provide new evidence of gut microbiota to facilitate wildlife adaption in severe foraging environments of the TRSNP, China.
INTRODUCTION
The Three-River-Source National Park (TRSNP) is located on the Qinghai–Tibetan Plateau (QTP), “The roof of the world,” with an area of 19.07 km2 and is an ecological unit with unique geological, geographical, and resource features (Liu et al. 2022). Owing to the presence of various mountains and water resources, it acts as a “Noah's Ark” for wildlife reproduction and serves as a biological gene bank with significant scientific research value (Zhang et al. 2023). The harsh high-altitude (average 4500 m) conditions with severe cold, hypoxia, and strong ultraviolet light also make TRSNP a natural laboratory for studying the adaption and evolution of animals (Liu et al. 2022; Zeng et al. 2022). Gut microbiota act as the host's “second genome,” form an inseparable relationship with the host (Zhu et al. 2010), and play a crucial role in digestion (Peng et al. 2021), immune maintenance (Gensollen et al. 2016), and metabolic homeostasis (Buffie & Pamer 2013). As an essential “acquired organ” in animals, the gut microbiota are also an important element for studying the interactions between animals and their environment adaption and evolution and, thus, has attracted increasing attention (Nicholson et al. 2012; O'Toole & Jeffery 2015).
Tibetan antelope (TA; Pantholops hodgsonii), blue sheep (PN; Pseudois nayaur), and Tibetan sheep (TS; Ovis aries) are three typical small ruminants that are widely distributed in the TRSNP (Zhang et al. 2023). However, low vegetation cover and long periods of grass withering (approximately 8 months per year) are crucial constraints for these herbivores living in such high-altitude areas (Yifan et al. 2008). Small ruminants, especially wild ruminants (WR), require highly efficient energy extraction and absorption mechanisms to balance survival threats in such extreme environments. For example, the ability of TA to combat adverse environmental effects has been thoroughly investigated in terms of physiology, cell biology, and molecular biology (Rong et al. 2012; Ge et al. 2013). In terms of microbiology, it is well established that herbivores convert the indigestible forage substances cellulose and hemicellulose into short-chain fatty acids, which can be digested and absorbed by the hosts mainly through interactions with the gastrointestinal microbiota (Flint et al. 2008; Zhang et al. 2016). However, existing studies on the function of diet-driven gastrointestinal microbiota of TA (Bai et al. 2018; Shi et al. 2021; Shang et al. 2022) and PN (Chi et al. 2019; Sun et al. 2019; Zhu et al. 2020; Zhao et al. 2023) only focused on the basic level of microbial composition and diversity based on 16S rRNA gene sequencing. With the development of microbial sequencing, multi-omics techniques have become invaluable for unveiling the comprehensive interaction mechanism between host and environment.
Hence, in this study, 16S rRNA and metagenomic sequencing were conducted to investigate the functional capacity of gut microbiota and their co-evolution with hosts during their adaptation to severe foraging environments among TA, PN, and TS. Unlike TS, which are under the care of herders year-round, TA and PN have to forage on their own in a complex and ever-changing natural environment. In addition, they often face survival pressures, such as predation and competition, owing to insufficient food supplies. Therefore, we hypothesized that the gut microbiota of PN and TA have a more efficient microbial-mediated forage utilization mechanism than that of TS, which enables the hosts to cope with harsh foraging environments.
This study aimed to clarify the co-evolution of gut microbiota and hosts in the TRSNP. These results may provide new evidence for understanding the roles of gut microbial-mediated severe foraging environment adaption in small wild ruminants in the Three-River-Source National Park, China.
MATERIALS AND METHODS
Sampling sites
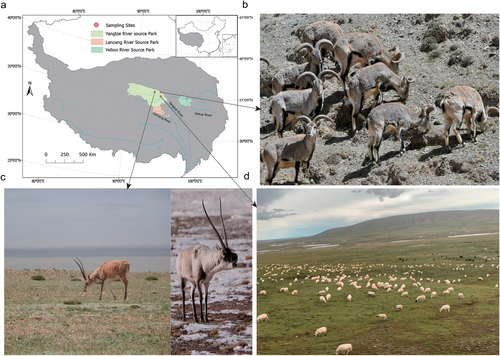
Fresh fecal samples were collected in August 2018 from the TRSNP. TS fecal samples were collected near the Three-River-Source Alpine Meadow Integrated System Observation of the Chinese Academy of Sciences in Yangtze River Source Park (Qumarleb County, Yushu Prefecture, Qinghai Province, China; 34°59′36″N, 94°29′20″E; altitude 4350 m). Fecal samples of TA and PN were collected in the Hoh Xil area (35°26′28″N, 93°32′27″E, altitude 4470 m and 35°53′8″N, 94°23′12″E, altitude 4310 m, respectively) (Fig. 1). None of the animals received concentrate supplementation.
Forage and fecal sample collection
Herbage collection methods used in this study were similar to those reported by Liu et al. (2022). Briefly, ten 50 cm × 50 cm quadrat frames were applied to collect the above-ground biomass in each experimental site. The ocular method was used to estimate herbage coverage. Different types of plants were measured in a quadrat frame, and the average height was taken to represent community height.
Owing to the high alertness of animals during the sampling process, we observed the hosts from a distance with a binocular telescope (Yunnan North Optical & Electron Group Co. Ltd., China). After animals left the defecation area, fresh fecal samples of different animals were collected immediately. To avoid cross-infection, each sample was collected using autoclaved disposable polyethylene gloves. Approximately 2 g of each sample was collected in cryotubes and labeled. Nineteen fresh fecal samples were collected from 8 TS, 6 TA, and 5 PN. All samples were promptly stored in liquid nitrogen and were later transferred to a −80°C ultra-low temperature refrigerator until subsequent high-throughput sequencing.
Determination of forage nutrition composition and the hosts’ apparent nutrient digestibility
The dry matter (DM, Method No. 2001.12), crude protein (CP, Method No. 984.13), and ether extract (EE, Method NO. 954.02) contents were determined by using AOAC methods (Feldsine et al. 2002). Natural detergent fiber (NDF) and acid detergent fiber (ADF) contents were analyzed according to Van Soest et al. (1991). Apparent nutrient digestibility was determined using the acid-insoluble ash method as described by Liu et al. (2022).
DNA extraction, PCR amplification, and 16S rRNA sequencing
The microbial DNA from ∼0.2 g fecal samples was extracted using an E.Z.N.A.® Stool DNA Kit (Omega Bio-tek, Norcross, GA, USA) according to the manufacturer's protocols. The concentration and quality of the extracted DNA were assessed by OD 260/OD 280 ratios using a NanoDrop TM 2000 (Thermo Fisher Scientific, Waltham, MA, USA), followed by integrity evaluation using 2% agarose gel electrophoresis. The universal primers 341F (5ʹ-CCTACGGGNGGCWGCAG-3ʹ) and 806R (5ʹ-GGACTACHVGGGTATCTAAT-3ʹ) were employed to amplify the V3-V4 hypervariable region of 16S rRNA genes of the purified DNA. Barcodes consisted of six-base sequences unique to each sample were added. A 20-μL PCR amplification mixture was prepared for each sample, containing 4 μL of 5 × FastPfu Buffer, 2 μL of 2.5 mM dNTPs, 0.8 μL of each primer (5 μM), 0.4 μL of FastPfu Polymerase, and 10 ng of gut microbial DNA. The following PCR reaction conditions included an initial denaturation at 95°C for 2 min, followed by 25 cycles at 95°C for 30 s, annealing at 55°C for 30 s, and a final extension at 72°C for 5 min. The PCR products were detected on 2% agarose gels, purified using the AxyPrep DNA Gel Extraction Kit (Axygen Biosciences, Union City, CA, USA) according to the manufacturer's protocol, and quantified using QuantiFluorTM–ST (Promega, Wisconsin, USA). For library construction, the purified PCR products were quantified using Qubit®3.0 (Life Invitrogen, State of California, USA), and the quantity checking was used by Agilent 2100 Bionalyzer system (Agilent Technologies, USA). All amplicons were pooled into equimolar sample concentrations. After the quality appraisal, the amplicon library was sequenced on an Illumina Hiseq2500 platform (Nanjing GenePioneer Co. Ltd), and 250-bp long paired-end reads were generated.
Bioinformatic analysis of the library sequence was performed using EasyAmplicon (https://github.com/YongxinLiu/EasyAmplicon). Briefly, the paired-end sequences were merged, quality filtered, and dereplicated with the running codes –fastq_mergepairs, –fastx_filter, and –derep_fullength, respectively, using the default parameters in VSEARCH v.2.15.2 (https://github.com/torognes/vsearch) (Rognes et al. 2016). Thereafter, the non-redundant sequences were denoised into amplicon sequence variants (ASVs) with the unoise3 algorithm implemented in USEARCH v.10.0.24 (http://www.drive5.com/usearch/; Edgar 2010), and a feature table was generated with the –usearch_global function. As chloroplast DNA sequences can exist in the feature table, EasyAmplicon's built-in script (otutab_filter_nonBac.R) was used to remove the chloroplast sequences. Finally, the sintax algorithm in USEARCH, based on the Ribosomal Database Project classifier v.16, was employed for the taxonomic classification of ASVs. To standardize the sampling efforts across samples, each sample was rarefied to the same number of reads (36 000) to assess the alpha diversity using the Shannon diversity and Chao1 richness indices.
Meta-genomic sequencing, assembly, and annotation
The microPITA (microbiomes Picking Interesting Taxonomic Abundance) (Tickle et al. 2013) analysis was used to select typical samples based on the term “most dissimilar,” “most representative,” “maximum diversity,” and “multiple selections” according to 16s rRNA sequencing profiles. Finally, five TS fecal samples, five PN fecal samples, and six TA samples were selected for the follow-up shortgun metagenomics analysis (Fig. S1, Supporting Information). The genomic DNA was extracted by the CTAB method (Barbier et al. 2019). The genomic DNA quality control, PCR amplification, and library preparation were carried out based on the method by Liu et al. (2022). Metagenomic sequencing was performed on an Illumina HiSeq 2500 platform (Novogene Biological Information Technology Co., Beijing, China), and 150-bp paired-end reads were generated. The detailed bioinformatics analysis methods have been described previously by Liu et al. (2022). Briefly, bowtie2 (https://www.encodeproject.org/software/bowtie2/) and SOAPdenovo (https://github.com/aquaskyline/SOAPdenovo2) were used to obtain high-quality clean reads and scaffolds (Karlsson et al. 2012; Luo et al. 2012). MetaGeneMark v.2.1.0 (https://github.com/gatechgenemark/ MetaGeneMark-2) was used to predict the contigs (≥500 bp) in each sample (Nielsen et al. 2014). The open reading frames were clustered into a non-redundant dataset using CH-HIT (Li & Godzik 2006). DIAMOND (https://github.com/bbuchfink/diamond) was used to align the unigenes with the bacteria and archaea extracted from the NR database v.2018.01 for taxonomic profile annotation. For gene function annotation, the unigenes were blasted using CAZy, the carbohydrate-active enzymes (CAZymes) database (Drula et al. 2022) and the Kyoto Encyclopedia of Genes and Genomes (KEGG) (Kanehisa et al. 2017).
Enterotype clustering
For distinguishing the distinct mammalian gut microbial community composition types, termed enterotypes, we employed the enterotype clustering method (Arumugam et al. 2011; Wu et al. 2011; Costea et al. 2018) to evaluate whether the gut microbiota divided into clusters with functional properties that varied among hosts. For all datasets, root Jensen–Shannon divergence and Bray–Curtis dissimilarity values were calculated from genus-level relative abundance profiles in R v.4.2.1, as described by Guo et al. (2021). The optimal number of clusters (k) for each dataset was determined using the Calinski–Harabasz index, and the average silhouette score was calculated using clustersim v.2.1.4 and cluster v.0.50.1 packages, for Bray–Curtis and root Jensen–Shannon divergence metrics, respectively, in R. Enterotype clustering of the gut microbiota was assigned to k clusters for each dataset using the partitioning around medoids algorithm implemented in the cluster package. In terms of the Calinski–Harabasz index, the distribution map of the k value obtained based on the root Jensen–Shannon divergence algorithm was more consistent with the estimated calculation. Hence, we adopted the Jensen–Shannon divergence algorithm for the subsequent enterotype analysis. Simper analysis was conducted using the simper function in the vegan v.2.6.4 package to cumulate the contribution of each genus to the intestinal types.
Molecular ecological network construction
Co-occurrence networks were constructed based on the random matrix theory approach (Yuan et al. 2021) using the online Molecular Ecology Networks Analysis pipeline (http://ieg2.ou.edu/MENA), and the detailed operational procedures have been described elsewhere (Liu et al. 2022). This pipeline has a strict requirement for the number of samples in each group, and only groups with eight or more samples can be used for network construction. To enhance the precision of molecular network construction, we merged the PN and TA groups to form the wild rumimant groups (WR) based on their similar microbial community structure and shorter phylogenetic distance and compared them with the TS group to analyze the similarities and dissimilarities of the gut microbiota molecular network between wild and domesticated ruminants. To guarantee the reliability of the Pearson correlation calculation, only the ASVs present in more than half of the samples were selected for network construction. Network topological properties including average connectivity (avgK), average clustering coefficient (avgCC), and average path distance (GD) were calculated. Networks were visualized using the Cytoscape software (v.3.3.0).
Statistical analysis
In this study, TimeTree online tool (http://www.timetree.org/) was employed to evaluate the species evolution time of PN, TA, and TS. R v.4.2.1 was used for the significance analysis, and Sankey plots or boxplots were generated to visualize the relative abundances of microbial taxa among hosts. The Shapiro–Wilk normality test was implemented using the R function shapiro.test to test the normality of the data. The aov function in the multicomp package v.1.4.20 was used to conduct a one-way analysis of variance (one-way ANOVA) on the forage nutrition composition, apparent nutrient digestibility, and alpha diversity of gut microbiota in different hosts, and the tukeyHSD function was used for multiple comparisons. Data that did not conform to a normal distribution were analyzed using the Kruskal–Wallis (multiple groups) and Dunnett's post hoc (two-group comparisons) tests. In addition, Mann–Whitney U tests were used to evaluate changes in gut microbiota taxonomic abundances associated with various enterotypes. To assess whether the beta diversity of gut microbiota communities differs among different ruminants more intuitively, the unweighted pair group method with arithmetic mean (UPGMA) was implemented using the upgma function in the phangorn package to generate two different types of phylogenetic trees (cladogram and phylogram, respectively). The homogeneity of dispersions for the diversity metric was then tested to identify differences in variance among treatments. Significant differences were determined using 999 permutations of the betadisper function in the vegan package v.2.6.4 of R. To identify the microbial taxa that best represented variation across different hosts, indicator analysis was conducted using the indicspecies package v.1.7.12 in R. A Mantel test with 999 permutations was used to calculate the correlations between forage nutrient digestibility and the indicator species by using the LinkET package of R (https://github.com/Hy4m/linkET). The r. g. function was used to determine correlations between the binary vectors (Liu et al. 2022). Metastats analysis from mothur software v.1.48.0 was used to detect the different carbohydrate-metabolizing genes among TA, PN, and TS.
RESULTS
Assessment of the forage community characteristics and nutrition composition
As shown in Table 1, the main plant-based diet for TS was alpine meadows, covered with Kobresia pygmaea, K. humilis, and K. capillifolia. TA includes desertified grasslands covered with Stipa purpurea, Poa annua, and Carex moorcroftii. PN mainly feeds on small shrubs such as Potentilla fruticosa, moss, and Rhododendron scrub. The herbage average height among different vegetation types were small shrubs > desertified grasslands > alpine meadows (P < 0.05). The herbage vegetation coverage, DM contents, CP, and EE in the PN and TA groups were significantly lower than TS (P < 0.05). NDF and ADF contents in PN and TA were significantly higher than TS (P < 0.05).
| Groups | ||||
|---|---|---|---|---|
| Items | TS | PN | TA | P-values |
| Characteristics of herbage community | ||||
| Vegetation type | Alpine meadows | Small shrubs | Desertified grasslands | |
| Dominant species of herbages |
Kobresia pygmaea, Kobresia humilis, Kobresia capillifolia |
Potentilla fruticosa, Moss, Stipa capillata |
Stipa purpurea, Poa annua, Carex moorcroftii |
|
| Community height (cm) | 5.13 ± 0.26b | 9.45 ± 0.20a | 7.26 ± 0.15a | <0.05 |
| Vegetation coverage (%) | 76.58 ± 1.66a | 45.29 ± 2.17b | 41.05 ± 1.15b | <0.05 |
| Dry matter contents (g m−2) | 175.26 ± 6.37a | 75.66 ± 1.44a | 78.36 ± 1.05b | <0.05 |
| Nutrition composition (%)† | ||||
| DM | 90.52 ± 0.41b | 95.18 ± 0.53a | 95.62 ± 0.74a | <0.05 |
| CP | 12.73 ± 0.70a | 7.72 ± 0.61b | 8.19 ± 0.36b | <0.05 |
| EE | 2.02 ± 0.06a | 1.84 ± 0.05b | 1.71 ± 0.03b | <0.05 |
| NDF | 25.82 ± 0.61b | 33.41 ± 0.22a | 32.15 ± 0.68a | <0.05 |
| ADF | 49.52 ± 1.76b | 59.66 ± 1.07a | 62.35 ± 1.49a | <0.05 |
- † The nutrition composition is based on dry matter basis. Values with different small letter superscripts in the same row mean significant difference. DM, dry matter; CP, crude protein; EE, ether extract; NDF, neutral detergent fiber; ADF, acid detergent fiber; TS, Tibetan sheep; PN, blue sheep; TA, Tibetan antelope.
Similarity and dissimilarity of the gut microbiota among TA, PN, and TS
16s rRNA sequencing yielded 1 910 442 high-quality reads after the removal of singleton and chloroplast sequences. A total of 10 527 ASVs were identified (Table S1, Supporting Information), of which 47.84% (of the total abundance, on average) were associated with Firmicutes, 16.84% with Planctomycetes, 13.79% with Verrucomicrobia, and 11.98% with Bacteroidetes, followed by Proteobacteria (2.31%), Actinobacteria (1.09%), and other rare phyla (relative abundance <1%) (Fig. 2a; Table S2, Supporting Information). Similarities in the gut microbiota were also present at the genus level in both TS and wild hosts (PN and TA), with Akkermansia (8.23% of the total average), Bacteroides (4.09%), and Phascolarctobacterium (1.35%) being the most abundant, accounting for 18.41% of the total annotated genera (Fig. 2b and Table S3, Supporting Information).
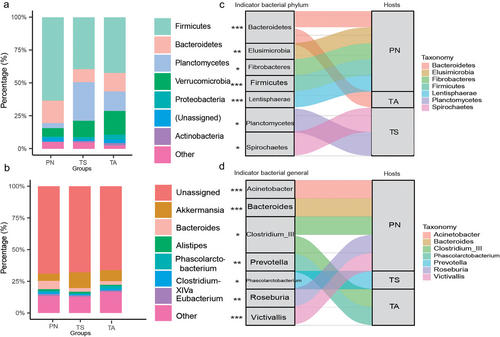
Indicator taxonomic analyses at the phylum (Fig. 2c) and genus (Fig. 2d) levels revealed differences between the different host groups. In the TA group, indicator species at the phylum and genus levels were Bacteroidetes, Clostridium_III, and Prevotella. In the TS group, indicator species included Planctomycetes, Spirochaetes, and Phascolarctobacterium. In the PN group, the indicators were Bacteroidetes, Elusimicrobia, Fibrobacteres, Firmicutes, Lentisphaerae, Acinetobacter, Bacteroides, Clostridium_III, Roseburia, and Victivallis. Notably, the indicator species (phyla: Firmicutes and Bacteroidetes; genera: Bacteroides and Victivallis), which had higher indicator values, were more abundant in the PN group than in the TA and TS groups (Fig. S2, Supporting Information).
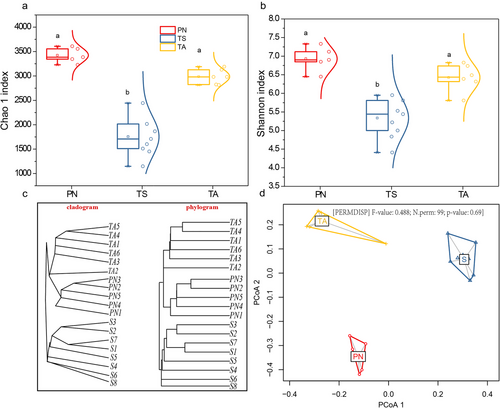
The dissimilarity in the gut microbiota of PN, TA, and TS was also manifested in alpha and beta diversity (Fig. 3). Both the Chao1 richness indices (Fig. 3a) and Shannon diversity (Fig. 3b) in PN and TA were significantly higher than that in TS (P < 0.05). Clustering analysis based on Bray–Curtis dissimilarity matrix (Fig. 3c) revealed the abundance-based gut microbiota in TA and PN had a closer distance distribution than that in TS, indicating that the microbiota community structures of TA and PN were more similar. The significant differences in microbial community structure were also confirmed through the homogeneity of dispersions test (PERMDISP, F = 0.488, P = 0.69) as shown in Fig. 3d.
Apparent nutrient digestibility of forage and their correlations with gut microbiota communities
As shown in Table 2, the apparent nutrient digestibility of DM, CP, and ADF in PN and TA was significantly higher than that of TS (P < 0.05). No significant differences were detected for NDF digestibility (P = 0.32).
| Groups | ||||
|---|---|---|---|---|
| Items | TS | PN | TA | P-values |
| Apparent nutrient digestibility | ||||
| DM | 71.47 ± 1.57b | 80.48 ± 1.99a | 79.14 ± 2.16a | <0.05 |
| CP | 69.61 ± 1.09b | 82.16 ± 1.19a | 81.36 ± 7.44a | <0.05 |
| NDF | 59.20 ± 1.29 | 68.74 ± 1.62 | 64.14 ± 4.41 | 0.32 |
| ADF | 51.01 ± 0.86b | 62.88 ± 1.73a | 62.04 ± 2.16a | <0.05 |
- In the same row, values with different letters mean significant difference (P < 0.05), while with the same letter or no superscripts mean no significant difference (P > 0.05). DM, dry matter; CP, crude protein; NDF, neutral detergent fiber; ADF, acid detergent fiber; TA, Tibetan antelope; TS, Tibetan sheep; PN, blue sheep.
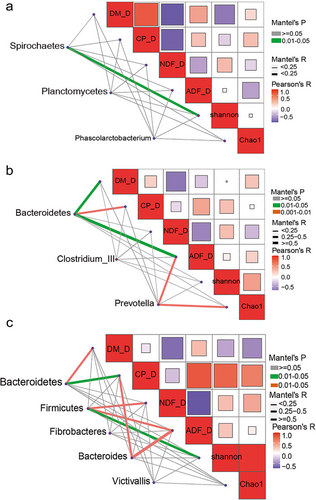
To further explore the driving factors that affect the ability of the apparent forage nutrient digestibility, we performed a correlation analysis using the indicator species as the driving factors and the apparent forage digestibility and bacterial alpha diversity as the environmental factors (Fig. 4). In the TS group (Fig. 4a), the Spirochaetes had positive effects on the Shannon indices. In the TA group (Fig. 4b), the relative abundance of the Bacteroidetes had positive effects on the DM, CP, and ADF digestibility. Prevotella had positive effects on the forage nutrition digestive ability of the ADF and Chao1 indices; in the PN group (Fig. 4c), both the Bacteroidetes and Bacteroides had positive effects on CP digestibility; DM digestibility was affected by the Bacteroidetes as well. The Firmicutes had positive effects on the digestibility of the NDF, ADF, and Shannon indices.
Gut microbiota enterotype identification and functions of the represented genus
As shown in Fig. 5, the highest CH index values based on partitioning around medoids (Fig. 5a) and root Jensen–Shannon divergence (Fig. 5b) indicated that the gut enterotypes could be classified into two clusters. Principal component analysis further confirmed the optimal number, and the representative hosts and microbial communities of the two enterotypes are shown in Fig. 5c. The gut microbiota present in PN and TA belonged to the enterotype 1 cluster, whereas the gut microbiota of TS belonged to the enterotype 2 cluster. These two clusters were distinguished based on relative differences in their representative bacterial genera. Bacteroides, Alstipes, and Eubacterium were present in enterotype 1, whereas Akkermansia and Marinobacter were present in enterotype 2 (Fig. 5c). The top 10 relative abundances of representative bacteria (Fig. 5d), Bacteroides (W = 86, P = 0.03), Alstipes (W = 101.5, P = 0.01), and Eubacterium (W = 110.5, P = 0.014), were significantly enriched in enterotype 1. The relative abundances of Akkermansia (W = 15, P = 0.0001) and Marinobacter (W = 27.5, P = 0.01) were significantly higher in enterotype 2 (Fig. 5e).
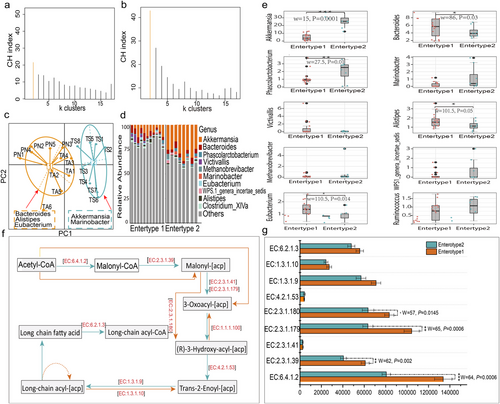
The different distributions of microbial genera allowed us to further evaluate the functional profiles of each enterotype. In this study, we focused on the enzymes involved in fatty acid and energy metabolism under severely cold and sparse vegetation conditions. To explore this, we queried the functional relevance of Bacteroides, Alstipes, Eunacterium, Akkermansia, and Marinobacter using the KEGG database. These genera showed convergent enrichment of enzymes involved in fatty acid (FA) biosynthesis (map:00061) pathways (Fig. 5f). Notably, nine enzymes involved in the FA biosynthesis were detected, and their abundance was significantly higher in E1 than in E2 (Fig. 5g). Although no significant differences were observed in the enzymes involved in oxidative phosphorylation (map: map00190), their abundance tended to increase in E1 (Fig. S3, Supporting Information).
Network analysis of gut microbiota communities
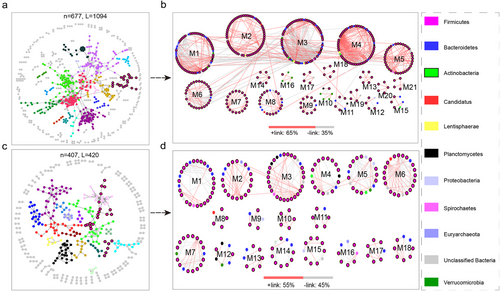
To understand the microbial community interactions of different hosts, a bacterial network was constructed (Fig. 6). The microbial MENs under WR and TS exhibited successional trajectories that differed from the overall distribution (Fig. 6a,c), among which the WR group had more complex and resilient microbial network characteristics, evidenced by higher avgK (3.232) and connectance (0.325) values (Table S4, Supporting Information). Additionally, the WR groups were predominated by higher positive correlation links than TS, implying that mutualism was the prevalent interaction among the gut microbiota of these wild ruminants (Fig. 6b,d). Interestingly, the networks in WR exhibited big-world characteristics with long geodesics (average shortest path between two nodes) of 6.53 (Table S4, Supporting Information), which reduced the effects of environmental interference throughout the entire network, rendering the entire system more stable and plastic.
Metagenomic sequencing of the profiles of the potential pathogenic
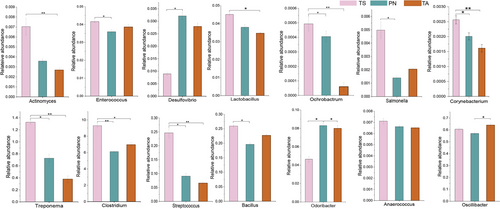
We identified 14 pathogenic opportunistic bacterial genera, namely, Actinomyces, Enterococcus, Desulfovibrio, Lactobacillus, Ochrobactrum, Salmonella, Corynebacterium, Treponema, Clostridium, Streptococcus, Bacillus, Odoribacter, Anaerococcus, and Oscillibacter (Fig. 7). In addition to Desulfovibrio, Odoribacter, Anaerococcus, and Oscillibacter, 10 potentially pathogenic bacteria were significantly enriched in the gut microbiota of TS groups (P < 0.05).
Functional microbial species related to cellulose degradation and methane production
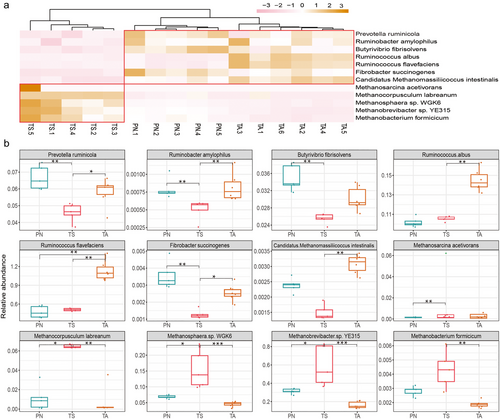
To explore potential cellulose-degrading and methane-producing microbial species, 12 main cellulolytic, proteolytic, and methanogenic bacteria were selected according to metagenomic sequencing. The heatmap of the relative abundances of the functional candidate species is shown in Fig. 8a. These candidate species were clustered into two main clusters, among which cellulolytic strains like Prevotella ruminicola, Ruminobacter amylophilus, Ruminococcus flavefaciens, and Fibrobacter succinogenes were significantly enriched in the gut of TA and PN, while methanogens such as Methanocorpusculum labreanum, Methanosphaera sp. WGK6, and Methanobrevibacter sp. YE315 were significantly enriched in the TS group (Fig. 8b) (P < 0.05).
Carbohydrate-metabolizing gene profiles and functions of carbohydrate-active enzymes
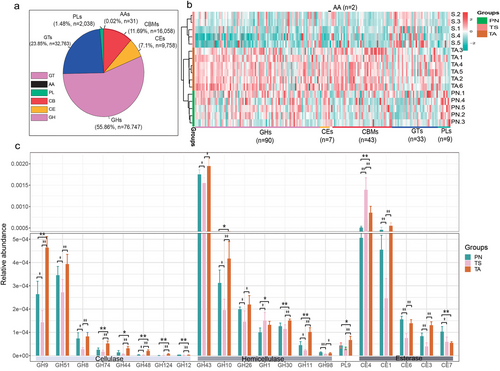
As shown in Fig. 9a, glucoside hydrolases (GHs) were the most abundant enzymes accounting for approximately 55.86% of the enzyme library, followed by glycosyl transferases (GTs, 23.85%), carbohydrate-binding modules (CBMs, 11.69%), carbohydrate esterases (CEs, 7.1%), polysaccharide lyases (PLs, 1.48%), and auxiliary activities (AAs, 0.02%). Metastats analysis showed 184 differential unigenes, among which GHs were the most abundant (n = 90). Most of the unigenes had an obvious enrichment feature that was enriched in the PN and TA groups (Fig. 9b). To further understand the functions of these unigenes, gene function classification was performed according to the CAZy database. Notably, genes encoding cellulases, hemicellulases, and esterases (Fig. 8c) had a significantly higher relative abundance in TA and PN than in TS (P < 0.05).
DISCUSSION
Animals living at high altitudes in the TRSNP are subjected to hypoxia, low temperatures, lower vegetation coverage, and long withering grass periods, which limit the availability of food for wildlife in the area (Lian et al. 2007; Zhao et al. 2023). The gut microbiota play an important role in converting nutrients into available substances. The abundance of cellulase activity, cellulolytic bacteria, and carbohydrate metabolism genes in the gut of Tibetan wild asses determined their adaptability to the high altitudes of the QTP (Liu et al. 2022; Gao et al. 2023). Studies on gazelles have found that gut microbiota can improve environmental adaptability by upregulating the expression of metabolic and cellular pathways (Qin et al. 2020). TA, PN, and TS are representative wild and domesticated small ruminants in the TRSNP, and research on their gut microbiota can aid in the understanding of the forage nutrition stress adaptation of herbivores.
Major factors that determine gut microbiota community diversity
Host species, phylogeny, geographical distance, and diet are the main factors that shape the gut microbiota (Sullam et al. 2012; Yun et al. 2014). In this study, PN and TA, two different species, whose phylogenic split occurred 13 million years ago, exhibited no significant differences in their gut microbial diversity (Fig. S3, Supporting Information). Moreover, the closer abundance-based gut microbiota distribution distance from phylogenetic analysis revealed the gut microbiota in PN and TA underwent convergent evolution, further indicating that host species and phylogeny may not be influential factors in microbial diversity, which is in accordance with the results of the gut research conducted on wild Drosophila (Martinson et al. 2017) and Colobine monkeys (Hale et al. 2018). Here, the high microbial diversity in PN and TA may be attributed to diet variation. TS are epidemic domestic livestock in the TRSNP, receiving the care of herders, and their feeding environment consists of high-quality pastures. In contrast, owing to human interference, predators, and low plant coverage, PN and TA have to forage on diverse foods, including lower-quality indigenous plants on a large spatial scale (Yifan et al. 2008). Therefore, we believe that diet variation in the living environment leads to variations in foraging ecology, thereby affecting the structure of the gut microbiota.
High microbial diversity and complex molecular interactions enable the gut microbiota of wild ruminants to be more resilient to harsh living environments
A high diversity of gut microbes can promote the stability of the gut flora ecosystem and increase the rate of dietary fermentation in the host (Tap et al. 2015; Li et al. 2019), while indirectly reflecting the poor nutritional status and habit conditions of the host (Liu et al. 2019; Yan et al. 2022). In our study, the high microbial diversity in PN and TA indicated the gut microbiota in these small wild ruminants were more complex and plentiful. In addition, during the fecal sample collection from the PN population, it was observed that to avoid attacks from natural enemies such as Panthera uncia, PN prefer to inhabit areas close to bare rocks and cliffs (Islam et al. 2023), consuming plant leaves with a higher cellulose content to sustain survival (Table 1). Meanwhile, due to the perennial drought in Hoh Xil, TA is also facing risks of insufficient nutrition intake. The higher diversity could improve gut microbiota plasticity to cope with the flexible feeding environment.
To further explore the complex interactions occurring in the gut microbiota, such as mutualism, competition, and commensalism (Faust & Raes 2012), we constructed molecular ecology networks (Fig. 6) to investigate the genus interactions according to their mutual exclusion (negative) and co-occurrence patterns (positive). A positive interaction may result from mutualism or commensalism, while a negative relationship is most likely due to competition, amensalism, predation, and so on (Faust et al. 2012). Notably, in our constructed networks, the small wild ruminants were predominated by higher positive correlation links, which revealed that a plant-based diet in the gut of wild animals might have high efficiency conducive to fermentation through more corporation relationships than that of TS (Li et al. 2017; Liu et al. 2020b). In addition, we found that in the gut microbiota of the small wild ruminants, the network topological properties of total links, average connectivity, and number of modules were relatively higher than that of TA, indicating that small wild ruminants may harbor a more complex network, particularly a more stable metabolic network for microbial communities against the severe feeding environment.
Indicator species in small wild ruminants enhance the utilization potential of roughage
We systematically compared the composition and differences of the gut microbiota among the three small ruminants. Similar to the gut microbiota of herbivores such as yaks and Tibetan wild asses (Liu et al. 2022), alpine musk deer (Jiang et al. 2021), and wild goitered gazelles (Qin et al. 2020) that are found on the QTP, Firmicutes and Bacteroidetes were the two predominant taxa among PN, TA, and TS. Emerging evidence suggests that Firmicutes play a significant role in promoting plant fiber degradation and transforming cellulose into short-chain fatty acids, thus enhancing forage digestibility and providing plenty of energy for host survival activities (Zhang et al. 2017; Cabral et al. 2022). Bacteroidetes are recognized as the optimal species for the degradation of high-molecular-weight organic matter, such as plant proteins and carbohydrates (Thomas et al. 2011). In our study, when compared to TS, the indicator phyla Firmicutes and Bacteroidetes, as well as some indicator genera such as Prevotella and Bacteroides, have a richer relative abundance in PN and TA. Studies on yaks (Guo et al. 2021) and Tibetan wild asses (Liu et al. 2022) have shown that these animals could tolerate roughage owing to abundant Firmicutes and Bacteroidetes levels. Here, the high presence of indicator species in small wild ruminants suggests that these animals might be more tolerant to roughage than TA. This speculation is supported by the positive relationship between the forage apparent nutrient digestibility and indicator microbial communities in our correlation analysis.
Gut microbiota enterotype and functional contexts of the represented genus in the adaption to sparse vegetation
In the present study, we explored the enterotype classification and function of small wild ruminants. There is an indelible relationship between enterotype and host adaption. Studies have shown that yaks shift their enterotypes to use nitrogen and energy effectively in the cold season from November to April (Guo et al. 2021). Plateau pikas adapt to complex food conditions by forming different enterotypes (Fan et al. 2020). In our study, the same gut microbiota enterotype classification of wild animals indicated a convergent adaptation of the gut microbiota when reared in different habitats. This study thus provides biological insights into the functions and functional genomic information of these two enterotypes. Enterotype 1 mainly comprised Bacteroides, Alistipes, and Eunacterium. Studies have demonstrated that Bacteroides not only participate in the decomposing of plant cellulose, hemicellulose, and other polysaccharides but also contribute to nitrogen cycling, that is, assisting the host in metabolizing and transforming nitrogen compounds (Thomas et al. 2011; Batista-García et al. 2016). Alistipes and Eunacterium are essential for plant polysaccharide decomposition, maintenance of the intestinal mucosal barrier function, and regulation of the immune system (Wang et al. 2017; Mukherjee et al. 2020). Therefore, we hypothesized that the Enterotype 1 cluster has a higher forage utilization efficiency than Enterotype 2; this was further confirmed by the results of the high apparent digestibility of forage (Table 2). Our study also clarified the influence of the Bacteroides, Alistipes, and Eunacterium enterotypes on FA and energy metabolisms. Enzymes involved in fatty acid biosynthesis and oxidative phosphorylation pathways were enriched in Enterotype 1, which indicates that this enterotype also plays a vital role in energy production and in maintaining the energy balance of the host.
The lower abundance of pathogenic bacteria reduces the incidence of intestinal diseases in small wild ruminants
Many pathogens of the gut microbiome can cause enteropathies. Although these pathogenic bacteria require specific conditions (e.g. animal immune system deficiencies or living environment changes) to initiate infection (Ludwig et al. 2010; Ghaisas et al. 2016), analysis of the distribution characteristics of pathogenic bacteria in the intestinal flora can be an important reference base to determine the future health of the host (Gao et al. 2023). In this study, we used metagenomic sequencing technology to quantitatively analyze 14 potential pathogenic bacteria (Jiang et al. 2023). We found that 10 pathogenic bacteria, such as Clostridium, Treponema, Streptococcus, and Bacillus were significantly enriched in TS. Therefore, we speculate that as the number of potential pathogenic bacteria increases, there is a higher risk of gastrointestinal disease in TS; that is, the lower abundance of pathogenic bacteria in the gastrointestinal tract of small wild ruminants may aid them to better adapt to the challenges of intestinal diseases caused by the plateau wilderness environment.
The abundant cellulose, protein-decomposing bacteria, and functional genes enhanced the utilization potential of forage in the small wild ruminants
Most herbivores do not digest grasses on their own. Rather, they depend on their gut microbes to decompose plant biomass into various nutrients (Niu et al. 2015). The functional analysis of gut microbiota is of great significance for understanding the association between microbes and hosts, as well as nutrient digestion and absorption (Krajmalnik-Brown et al. 2012). In the present study, we quantitatively analyzed several cellulolytic and proteolytic bacteria, including R. flavefaciens, P. ruminicola, Butyrivibrio fibrisolvens, R. albus, R. amylophilus, and F. succinogenes (Hastie et al. 2008; Liu et al. 2020a). Notably, these functional bacteria were significantly more abundant in TA and PN than in TS. This finding is consistent with that of a previous study on the function of the intestinal flora in Tibetan wild asses, yaks, and sheep (Liu et al. 2022). That is, compared to domestic animals, wild animals have rich forage-digesting flora that can ensure the host maintains an efficient decomposition and absorption capacity for cellulose, proteins, and other nutrients when consuming low-quality and quantity forage to adapt to harsh living environments. In the gut, the breakdown of nutrients is often accompanied by the production of hydrogen, which archaea use to produce greenhouse gases, such as methane and carbon dioxide (Hoffmann et al. 2013; Su et al. 2022). In the present study, five predominant methane-producing archaea were enriched in the TS gut. Studies have revealed that yaks and TS were more environmentally friendly high-altitude mammals than cattle and goats, as their unique gut microbial structure aided biological control of greenhouse gas emissions (Zhang et al. 2016). Although the greenhouse gases of TA and PN cannot be measured in a laboratory, we speculate that PN and TA may be low methane emission species based on the low archaea consortiums, and this energy-efficient utilization strategy enables PN and TA to cope with the perennial cold climate of TRSNP.
Herbivores can utilize carbohydrate-rich plant residues as substantial energy resources. Fiber-decomposing enzymes produced by the gut microbiota are of great significance in research related to forage utilization (Gharechahi et al. 2021). In the present study, from the perspective of CAZymes, we found that glucoside hydrolases were the most diverse (n = 32763) and abundant (average 23.85% of the total), which is consistent with the findings of Cantarel et al. (2009). In addition, a total of 21 high relative abundance of CAZymes were associated with cellulase, hemicellulase, and esterase deconstruction (Flint et al. 2012; Gharechahi et al. 2021; Peng et al. 2021). Except for GH1 and CE4, 19 genes encoding cellulases, hemicellulases, and esterases were significantly more abundant in PN and TA. These discrepancies may be explained by differences in feeding niches. Wild animals living in poor conditions on TRSNP usually feed on forage with high levels of indigestible plant fiber, whereas TS selectively consumes forage of high quality under the care of herdsmen. The abundant functional CAZyme genes indicated convergent evolution of gut microbiota for host adaption and further confirmed that the wild animal gut microbiota are a worthy resource for in-depth analysis, such as microbial enzyme preparation (Levin et al. 2021).
However, the mechanism of microbial-mediated severe feeding environment adaptation of herbivores is a complex process. There are some limitations to this study, such as the difficulty of sample collection, especially that of the wild animals, resulting in a slightly decreased sample size and limited data acquisition. Additionally, the feeding habits of the experimental animals are not clear; the wild animals may balance the contradiction between nutrient demand and forage supply by eating some plants with higher nutrition. Therefore, subsequent studies on feeding habits and feeding behaviors should be conducted to explore the potential mechanisms affecting animal intestinal flora. Moreover, using metabolomics technology can provide important metabolite information when studying severe food environment adaption among different hosts; due to the limited samples, we should use metabolomics technology in future studies to shed some light on the environmental adaptation of hosts.
CONCLUSION
The intervention of gut microbiota is one of the key factors for small wild ruminants to adapt to the food scarcity situation in the Three-River-Source National Park. Our results revealed that gut microbiota-regulated herbivores, especially wild animals, can adapt to the pasture nutritional stress from their habitat by changing their microbial diversity, gut enterotypes, and functional bacterial species and genes that relate to decreasing intestinal disease occurrence and enhancing forage fiber and crude protein decomposing. This study has important implications in the research of the dietary adaptions of wild ruminants in the Three-River-Source National Park, China.
ACKNOWLEDGMENTS
The authors acknowledge the assistance of the Three Source River National Park Administration. This work was supported by the Youth Fund Project of the National Natural Science Foundation of China (32100100); the Joint Grant from the Chinese Academy of Sciences-People's Government of Qinghai Province on Sanjiangyuan National Park (LHZX-2022-02); the Youth Innovation Promotion Association, Chinese Academy of Sciences; and the National Science Foundation of Qinghai Province (2022-ZJ-943Q).
CONFLICT OF INTEREST STATEMENT
The authors declare no conflict of interest.


