Weighted individual-resource networks in prey–predator systems: the role of prey availability on the emergence of modular structures
Abstract
Ecological networks, usually depicting interactions among species, have been recently down-scaled to the individual level, permitting description of patterns of inter-individual resource variation that are usually hindered at the species level. Optimal diet theory (ODT) models, applied to prey–predator systems, predict different patterns of nestedness and modularity in the network, depending on the available resources and intra-specific competition. The effect of resource availability on the emergence of networks structures, and ODT framework, has not yet fully been clarified. Here, we analyzed the structural patterns of individual-resource networks in 3 species of Mediterranean salamanders, in relation to changes in prey availability. We used weighted individual-resource network metrics to interpret the observed patterns, according to 3 ODT models. We found significant nestedness recurring in our study system, indicating that both selective and opportunistic individuals occur in the same population. Prey diversity, rather than abundance, was apparently related to inter-individual resource variation and promoted the emergence of significant modularity within all networks. The observed patterns of nestedness and modularity, together with the variation in resource diversity and intra-specific competition, are in agreement with the distinct preferences model of ODT. These findings suggest that in the focal prey–predator systems, individuals were able to perceive changes in prey diversity and to exploit in different ways the variations in composition of available resources, shifting their diet assembly rules accordingly. Our findings also confirm that the use of weighted individual-resource networks, in prey–predator systems, allows to disclose dynamics that are masked at the species or population level.
INTRODUCTION
In the study of foraging ecology, the optimal diet theory (ODT) initially proposed by Schoener (1971) and Pulliam (1974), offers a valuable theoretical framework to analyze patterns of inter-individual diet variation (Svanbäck & Bolnick 2005). That is, among-individual variation in resource use may depend on the profitability of that resource for the individual consumer, which in turn is affected by individual morphological or behavioral traits, and by the ease of individual access to resources (Sanz-Aguilar et al. 2015; Snowberg et al. 2015). Indeed, ODT assumes that individuals assemble their diets in order to maximize energy intake, by evaluating the trade-off between the costs of food provisioning (i.e. searching, capturing, handling, and digesting) and energy gain. As a result, individuals within the same population may rank differently the variety of food resources available in the environment, according to their profitability (Svanbäck & Bolnick 2005; Lemos-Costa et al. 2016). In particular, Svanbäck and Bolnick (2005), when considering phenotypic or behavioral variation in ODT, explored mathematically 3 different theoretical scenarios. These scenarios explain the emergence of inter-individual resource variation, and in particular individual trophic specialization sensu Bolnick et al. (2003), by the likelihood with which different individuals rank available resources and also as they add new items to their realized diets. In the first scenario, named the distinct preference (DP) model, the forager population is composed of clusters of individuals with different phenotypes or behaviors, with each cluster selecting a different type of food resource as its “first choice” (e.g. Pires & De Melo 2020). In the second scenario, the competitive refuge (CR) model, all individuals share the same “first choice” food category, but have different preferences towards their “second choice” one (e.g. Lemos-Costa et al. 2016). In the third scenario, the shared preferences (SP) model, all individuals rank preferred resources in a similar order, but they differ in the rate at which they add alternative resources to their diet, in particular when their preferred food item becomes rare (e.g. Smith 1990). This theoretical background (Fig. 1) may become even more complex when available resources fluctuate seasonally or annually as it usually occurs in the real world, thus influencing the temporal structure of the forager trophic niche, both at population and individual level (e.g. Pires et al. 2011; Moleon et al. 2012; Pires & De Melo 2020).
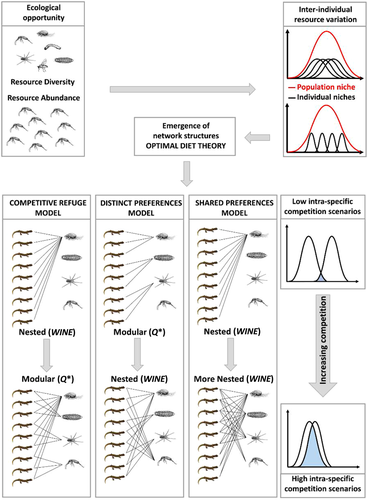
Recently, ODT has been evaluated in the framework of network analysis, a theoretical approach rapidly expanding in ecological and behavioral studies (see Delmas et al. 2019, for a review). In fact, network analysis seems successful in unfolding the hidden structure underlying complex ecological interactions (Bascompte et al. 2003), and has proven particularly useful when using individual-resource networks (e.g., Araújo et al. 2008, 2010; Santamaria et al. 2020). In individual-resource bipartite networks (i.e. those networks in which members of one trophic level are connected only with members of another trophic level and interactions within levels are absent or negligible) only two sets of nodes are present, foragers and resources they consume (e.g. Pires et al. 2011; Tinker et al. 2012). The emerging structure of individual-resource networks may reveal hidden patterns of resource-sharing (e.g. Araujo et al. 2010; Cantor et al. 2013; Carvalho-Rocha et al. 2018) or partitioning (e.g. Moleon et al. 2012; Pires & De Melo 2020) among individuals, and may give information on the underlying ecological mechanisms generating the observed inter-individual resource variation, in terms of individual specialization or generalization (Bolnick et al. 2003; Araújo et al. 2011). The most characterizing structures in a bipartite network that can be triggered by an asymmetrical resource use among individuals are termed nestedness and modularity (Fortuna et al. 2010). Nestedness is usually observed when the diet of the more specialized individuals is a subset of the diet of the more generalized ones. Conversely, modularity may be observed when individuals cluster in well separated subgroups, each one characterized by a differential use of available resources. In this case, individuals within the same module overlap significantly more with each other than with individuals belonging to a different module (Fortuna et al. 2010). In general, in the study of inter-individual diet variation, evidence of nested interactions in bipartite networks are found more frequently than modular interactions (Araujo et al. 2008, 2010; Lemos-Costa et al. 2016; Fernandes da Cunha et al. 2018; De Camargo et al. 2019). Moreover, the study of network structures associated to ODT models allows discrimination between possible mechanisms generating patterns of inter-individual diet variation (Tinker et al. 2012; Pires & De Melo 2020). In particular: (i) SP model predicts an increase in nestedness when resources become scarce and competition increases, (ii) CR model considers a shift from a nested to a modular network structure when competition increases, (iii) DP model expects a modular network when resources are abundant and competition is low, while predicts a shift toward nestedness when competition arises (Fig. 1).
In recent years, there has been an increasing attention on the role of environmental conditions on the emergence and magnitude of inter-individual diet variation, and recently published studies stress the importance of environmental drivers on inter-individual resource variation (e.g. Balme et al. 2020; Bolnick & Ballare 2020; Lunghi et al. 2020). In particular, several studies focused on the effect of one or more of the many different facets comprised within ecological opportunity (Wellborn & Langherans 2015; Stroud & Losos 2016): resource diversity (Costa-Pereira et al. 2019; Balme et al. 2020; Bolnick & Ballare 2020; Sánchez-Hernández et al. 2020), resource abundance (De Camargo et al. 2019; Pires & De Melo 2020), resource seasonality (Fernandes Da Cunha et al. 2018; Pires & De Melo 2020), and also habitat complexity and/or heterogeneity (De Camargo et al. 2019; Lunghi et al. 2020). Despite the increasing interest and research efforts on this topic, results on the role of ecological opportunity on the emergence of inter-individual resource variation have been mixed. In any case, among the studies relying on the analysis of network structure framed within ODT (De Camargo et al. 2019; Pires & De Melo 2020), only qualitative dietary data (i.e. presence/absence of a given resource) have been used. However, this approach may have obscured patterns of inter-individual resource variation that conversely may be better highlighted when using quantitative data that are better descriptors of the strength of the ecological interactions existing between the foragers and their resources (Tinker et al. 2012; Miranda et al. 2019).
Amphibians, depending on the stage of their life (aquatic vs. terrestrial), are used for food by a variety of aquatic and terrestrial predators, that is, mammals, birds, and fish. Predator–prey relationships, in a situation when amphibians are potential prey, are already quite well understood (e.g. Winandy & Denoël 2013; Bylak 2018). However, we have relatively little information on how different amphibian predator species function in prey–predator systems.
Here, we analyzed quantitative diet data of three salamander species in order to better understand the network structures, predicted in the framework of ODT. In particular, our aim was to discriminate between the effect of two components of ecological opportunity, resource abundance and diversity (Wellborn & Langherans 2015; Stroud & Losos 2016), on the emergence of network structures expected within the theoretical framework of ODT, under different levels of intra-specific competition. For this purpose, we focused on three salamander species inhabiting the Mediterranean region, and therefore exposed to strong seasonal and spatial variation in resource availability. In particular, we analyzed the emergence of nested or modular network structures, and the shift of dietary assembly rules predicted by different ODT models (Cloyed & Eason 2016; Lemos-Costa et al. 2016; Fernandes Da Cunha et al. 2018; De Camargo et al. 2019; Pires & De Melo 2020). We expected that, by applying quantitative network analysis to our three study species subject to different seasonal and geographical variations in terms of trophic availability, we would be able to (i) disentangle the effect of resource diversity and abundance on network structure and inter-individual resource variation, (ii) evaluate if observed network structures are consistent with those expected by ODT models, and (iii) determine if fluctuation in trophic resource availability may generate an increase of intra-specific competition, and therefore trigger a dietary shift, consistent with ODT predictions.
MATERIALS AND METHODS
Study species
In this study, we focused on dietary data from three species of Mediterranean salamanders: the European plethodontid Strinati's cave salamander, Speleomantes strinatii (Aellen, 1958), the northern spectacled salamander Salamandrina perspicillata (Savi, 1821), and the Corsican brook newt Euproctus montanus (Savi, 1838). These 3 species were selected because individual diets, available prey resources and population abundances/density were quantitatively estimated (see below). Strinati's cave salamander is a fully terrestrial, long-lived, plethodontid found in southern France and northwestern Italy (Lanza 2007). It usually inhabits forest litter and humid rock-faces along stream banks, but it also establishes stable populations in underground habitats (Salvidio et al. 1994). The Northern spectacled salamander is a biphasic salamander, endemic to central and northern Italy (Romano et al. 2009). It is usually found in shady and damp forests but also in Mediterranean maquis. Adults are terrestrial, only females go to water for spawning, and the foraging activity occurs only during the terrestrial phase (Lanza 1983). The Corsican brook newt is the more aquatic salamander among our study species. It is a biphasic newt, endemic to Corsica island (France), which during aquatic phase mainly inhabits streams in forested areas (Sparreboom 2014).
Dietary data and trophic availability
Dietary and trophic availability data are based on previously published research (Salvidio et al. 2012; Costa et al. 2015; Rosa et al. 2020; for S. strinatii, S. perspicillata, and E. montanus, respectively), to which we refer for a detailed explanation of sampling methods. For S. strinatii and S. perspicillata, the same population was sampled twice, during the two main activity seasons (autumn and spring), while E. montanus data derive from two different populations, sampled within the same season (spring). Sampling of Strinati's cave salamanders occurred on a mixed supra-Mediterranean deciduous forest (Blondel & Aronson 1999) in northern Italy (Liguria) during autumn 2008 (November, n = 63) and spring 2009 (April, n = 66). Northern spectacled salamanders were sampled during the terrestrial phase on a beech forest in central Italy, in autumn 2012 (October, n = 120) and spring 2013 (May, n = 67). Two distinct populations of the Corsican brook newt E. montanus were sampled in spring 2018, one located on the northernmost part of Corsica (n = 26), and the other one on the southernmost part of the island (n = 26). When a single salamander population was sampled in consecutive seasons, individuals were marked by toe clipping (S. strinatii) or by photography of the ventral pattern (S. perspicillata), in order to avoid pseudoreplication (Hurlbert 1984). Stomach contents were obtained by stomach flushing (Costa et al. 2014) and samples were preserved in 70% ethanol. Terrestrial prey availability for S. strinatii and S. perspicillata was assessed by pitfall traps, soil cores, and sticky traps (Southwood & Henderson 2000). Aquatic prey availability for E. montanus populations was assessed by sampling a standardized surface by using a Surber net with a metal frame of 33 × 33 cm (Southwood & Henderson 2000). Invertebrates were determined in the lab at order level and their life stage was recorded, if ecologically relevant (e.g. Diptera adults and Diptera larvae). The full prey–predator data sets are reported in Salvidio et al. (2012), Costa et al. (2015), and Rosa et al. (2020). Since conspecific density of salamanders may have an effect on intraspecific competition and on inter-individual resource use (Svanbäck & Bolnick 2005, 2007; Cloyed & Eason 2016), we estimated abundance for each study species. Abundance estimates were obtained by means of N-mixture modeling (Royle 2004), in the case of S. strinatii (Costa et al. 2016) and S. perspicillata (Romano et al. 2017), and by temporary removal in the case of E. montanus (Rosa et al. 2020; see Supporting Information for further details).
Data analysis
No significant sex differences in diet composition were observed (Salvidio et al. 2012; Costa et al. 2015; Rosa et al. 2020) and data were pooled for analyses. Dietary data yielded an individual-resource matrix for each season/population and each of these matrices constituted a network, where individual salamanders (in rows) and prey resources (in columns) represented 2 sets of nodes, while the link connecting them represented a trophic interaction (Pires et al. 2011). The weighted individual-resource matrix contained, for each predator, the numerical abundance of items in each prey category (Tinker et al. 2012; Miranda et al. 2019). We then calculated several indices on our weighted networks in order to describe patterns of inter-individual resource use. Weighted measures of nestedness were quantified by the Weighted-Interaction Nestedness Estimator (WINE—Galeano et al. 2009). WINE measures nestedness by evaluating the relative position of the index between the theoretical minimum and maximum for the given network size (Galeano et al. 2009). It assumes values close to 0, for minimum nestedness, and increases towards 1, for maximum nestedness. Since some levels of the observed nestedness in the network may arise from a stochastic process, rather than from an asymmetrical use of resources by individuals (Araujo et al. 2008), statistical significance of WINE has been assessed against a null model consisting of 10 000 randomly generated networks (Galeano et al. 2009). After null model building, Z-scores have been calculated as: Z = [x − μ]/σ, where x is the empirical value of WINE, while μ and σ are the mean and standard deviation of WINE for the null model, respectively. The observed value of WINE has been considered to be statistically significant with a Z > 2, and the associated P-value calculated with a Z-score distribution table (Dormann et al. 2009).
Degrees of modularity (Q) have been measured using the quantitative version of the Beckett's (2016) algorithm (Dormann et al. 2017). Q ranges from 0, for a minimum modular network, to 1, in case of maximum modularity. Statistical significance of the observed degree of modularity has been assessed against a null model composed by 1000 randomly generated networks. Each one of the 1000 networks composing the null model has been generated by a conservative algorithm (Patefield 1981), constraining marginal totals (i.e. observed row and column sums) and allowing variations in connectance, which has proven to be reliable when assessing modularity in weighted networks (Miranda et al. 2019). Z-scores and P-values were calculated following the same procedure used for nestedness. Furthermore, in order to compare measures of modularity between different networks (i.e. to account for variation in size of the network in terms of number of individuals and prey resources), we relativized the observed measures of modularity (Q*) as follows: Q* = [x − μ]/μ, where x is the empirical value of Q and μ is the mean value of Q for the null model (Bascompte et al. 2003; Pires et al. 2011).
In addition, strength of inter-individual resource variation in the network was measured as the average density of connections, by calculating the E index (Araujo et al. 2008), which measures the pairwise similarity of individual diets and ranges from 0, when all individuals have similar diets, to 1, when all individuals rely on different resources. Statistical significance of the E index has been assessed against a null model obtained by 10 000 randomly generated networks, following Araujo et al. (2008), and Z-scores and P-values were calculated following the same procedure used for WINE and Q. In order to compare the average density of connection between different networks, we calculated a relativized version of E (E*), following the same procedure used for the calculation of Q*.
Finally, niche overlap between individuals, within each season and population, was assessed by means of Horn's (1966) index, which gives a measure of similarity in the number of interactions between nodes. This index varies from 0, when individuals do not share any resource, to 1, when individuals have all resources in common (Magurran & McGill 2011).
In order to investigate the relationship between network structure and prey availability we tested independently the effect of these metrics on nestedness, modularity and average density of connections, by considering network indices as dependent variables in linear regressions (De Camargo et al. 2019). We investigated the effect of diversity, expressed as exponential value of Shannon diversity index (Jost 2006; De Camargo et al. 2019) and of abundance, expressed as the total number of prey in the environment (log transformed), of the arthropod communities measured in the environment. These analyses were performed on WINE, Q* and E*, for all species and seasons/populations.
All analyses were conducted within the R environment (R Core Team 2020) in packages “bipartite” (Dormann et al. 2008) and “RInSp” (Zaccarelli et al. 2013).
RESULTS
Estimated abundances showed limited and not significant seasonal variations for S. strinatii and S. perspicillata or between populations for E. montanus (see Supporting Information).
From the analysis of stomach contents and environmental resource availability we obtained 4796 and 5469 prey items, respectively (Table 1). In relation to prey resources, we observed that diversity was higher in autumn than in spring for S. strinatii and S. perspicillata, while for E. montanus populations, diversity was higher in the northern site than in the southern one (Table 1). Conversely, resource abundance was higher in spring than in autumn for S. strinatii and S. perspicillata, while in contrast it was higher for the northern site of E. montanus (Table 1).
| Species | Season/Site | Resource abundance (n) | Resource diversity (Shannon index) |
|---|---|---|---|
| S. strinatii | Autumn | 406 | 2.21 |
| Spring | 1005 | 2.08 | |
| S. perspicillata | Autumn | 1488 | 2.22 |
| Spring | 2336 | 1.87 | |
| E. montanus | North | 127 | 1.91 |
| South | 107 | 1.32 |
- Abundance is expressed as the number of prey items; diversity is expressed as Shannon index.
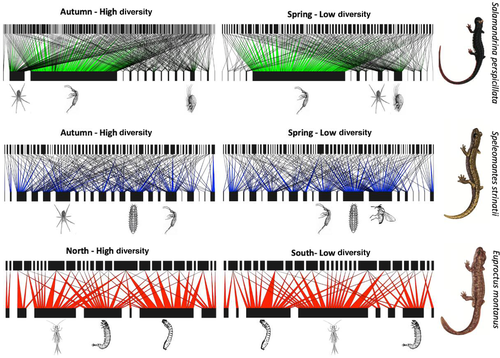
Quantitative individual-resource networks are presented in Fig. 2. Quantitative network indices revealed significant nestedness for all species, although WINE estimates varied within the same species, between seasons or populations. WINE showed higher values during spring, for what concerns S. strinatii and S. perspicillata, and in the southern E. montanus population (Table 2). Relative modularity Q* was also significant in the majority of situations, other than for the southern E. montanus population, where the value of Q* was not significant. Furthermore, as observed for nestedness, modularity showed seasonal/local variations. However, Q* showed an opposite pattern when compared to WINE: Q* was higher in autumn for S. strinatii and S. perspicillata and in the northern site for E. montanus (Table 2). The average density of connections followed a pattern similar to modularity, being significant in all situations, with the exception of the northern E. montanus site (Table 2). At the same time, seasonal/site variation of E* followed the same pattern observed for Q*, with higher values during autumn, for S. strinatii and S. perspicillata, and in the northern site of E. montanus. Niche overlap followed a pattern similar to the one observed for nestedness, and hence opposite to Q* and E*, showing a higher overlap in resource use for S. strinatii and S. perspicillata during the spring, and for E. montanus in the southern site (Table 2).
| WINE | Q* | E* | |||||||||
|---|---|---|---|---|---|---|---|---|---|---|---|
| Species | Season/Site | Estimate | Z-value | P-value | Estimate | Z-value | P-value | Estimate | Z-value | P-value | Niche overlap Estimate |
| S. strinatii | Autumn | 0.40 | 10.47 | <0.001 | 0.40 | 10.98 | <0.001 | 0.21 | 3.79 | <0.001 | 0.22 |
| Spring | 0.56 | 13.75 | <0.001 | 0.39 | 10.79 | <0.001 | 0.18 | 3.52 | <0.001 | 0.28 | |
| S. perspicillata | Autumn | 0.76 | 21.33 | <0.001 | 0.66 | 14.70 | <0.001 | 0.23 | 7.60 | <0.001 | 0.66 |
| Spring | 0.84 | 17.28 | <0.001 | 0.32 | 5.63 | <0.001 | 0.04 | 3.70 | <0.001 | 0.96 | |
| E. montanus | North | 0.32 | 3.67 | <0.001 | 0.17 | 2.35 | <0.01 | 0.22 | 2.37 | <0.01 | 0.31 |
| South | 0.63 | 7.52 | <0.001 | 0.006 | 0.025 | 0.49 | 0.08 | 0.58 | 0.28 | 0.48 | |
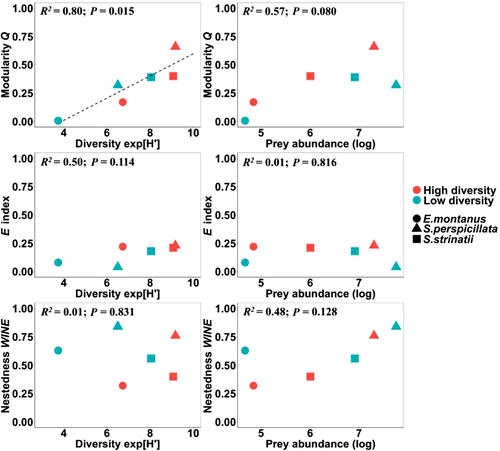
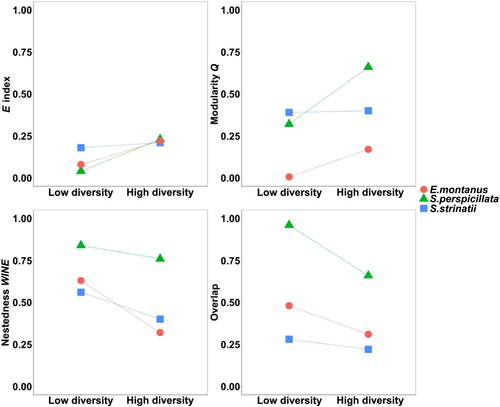
With respect to the effect of resource availability on network structure, when all species and seasons/populations are considered simultaneously, linear regression analyses revealed that only relative modularity was significantly related to resource diversity (R2 = 0.80; P = 0.015), but not nestedness and average density of connection (Fig. 3). At the same time, no significant relationships were observed between these network metrics and resource abundance (Fig. 3). As a general rule, we also observed how all network metrics varied consistently with the change in resource diversity, within species and between seasons/populations (Fig. 4). In particular, the degree of inter-individual resource variation (E*) followed the pattern observed for modularity. At the same time, niche overlap followed nestedness pattern. Thus, an increase in inter-individual resource variation was associated with the emergence, or strengthening, of modular structures in the network, while rising nestedness was associated with an increasing niche overlap (Fig. 4).
DISCUSSION
In our study system, we found significant nestedness for all species in each season/population, although its strength varied both between species, and seasonally/locally within the same species. At the same time, we also found significant modularity in the majority of cases. Nested and modular structures are commonly encountered in ecological networks at the species level, in particular, in individual-based networks describing both mutualistic or antagonistic interactions (Bascompte et al. 2003; Guimaraes et al. 2006; Fortuna et al. 2010; Dormann et al. 2017). Nevertheless, nestedness is the most frequently-found pattern, even when accounting for weighted interactions in the individual-resource network (e.g. Araujo et al. 2010; Pires et al. 2011; Cantor et al. 2013; Carvalho-Rocha et al. 2018). Modularity is a less recurrent network property at the species level, but more frequently encountered when networks are down-scaled at the individual level (Tur et al. 2014). For individual-resource networks, modularity is usually alternated with nestedness within the same species under different conditions, which are typically associated with extrinsic variations at the population or species level. For instance, these extrinsic variations include: demographic crash of the preferred resources (Moleon et al. 2012), seasonal variation in resource availability (Pires & De Melo 2020), and different levels of intra-specific density/competition (Tinker et al. 2012).
The generalized significance of nestedness in our study system indicates that populations are composed of both opportunistic and selective individuals, the diet of the latter being comprised within the diet of the former (Araujo et al. 2010; Pires et al. 2011), and that this feature may be considered as a recurrent pattern in our study systems, as it is suggested for many other species (e.g. Araujo et al. 2010; Pires et al. 2011; Carvalho-Rocha et al. 2018). In our study system, we also found significant modularity, indicating the presence of clusters or modules, within which individuals share more resources than they do between different modules. Furthermore, as observed for nestedness, the strength of modularity varied seasonally and locally for our study species. In particular, we observed how variation of modularity, within the same species, followed the opposite direction of nestedness. In our study system, given that we did not record any significant difference in abundance/density of predators between seasons or populations, we can assume that niche overlap is a representative proxy for intra-specific competition (MacArthur & Levins 1967; Schoener 1974; Chase & Leibold 2003). In this light, the observed pattern of our network indices suggests that, when intra-specific competition increases, modular structures, inter-individual resource variation, and resource partitioning decrease their strength, while nestedness increases. This pattern, when framed within ODT, is consistent with the DP model (Fig. 1). In the DP model, individuals have different top-ranked resources when resources are abundant and competition is low (Pires et al. 2011; Tinker et al. 2012). The DP model predicts that, when the preferred resources become scarce or intra-specific competition increases, individuals include novel resources in their diet, resulting in an increased niche overlap and producing a shift toward a nested network (Lemos-Costa et al. 2016). The same DP pattern, associated to a seasonal change in resource availability, has been observed for a population of a Californian predator marine snail (Lemos-Costa et al. 2016), and for a frugivorous bird in the Brazilian savannas (Pires & De Melo 2020).
For the effect of ecological opportunity on the observed network structure and the corresponding ODT model, we found that resource diversity was the main predictor of the magnitude of modularity. However, we observed an opposite behavior for nestedness and niche overlap. The low intra-specific competition scenario of the DP model (i.e. when modularity is predominant over nestedness and niche overlap is reduced) occurred for all species in the situation with higher diversity of resources: autumn season for S. strinatii and S. perspicillata, northern site for E. montanus. Concerning S. strinatii and S. perspicillata, resource diversity and abundance varied seasonally in opposite direction, thus enhancing the relevance of resource diversity as the principal component of ecological opportunity. This finding is well supported in theory by the fact that resource diversity should promote inter-individual resource variation by increasing foraging opportunity and allowing individual niches to diverge (Araujo et al. 2011). Many other studies reported positive relationships between resource diversity and habitat complexity with inter-individual resource variation (e.g. Robertson et al. 2015; Cloyed & Eason 2016; De Camargo et al. 2019; Balme et al. 2020; Bolnick & Ballare 2020). However, some of these studies did not directly measure resource diversity, and others did not rely on the analysis of network structure framed within ODT. Among the studies directly measuring resource diversity or applying individual-resource networks to ODT, De Camargo et al. (2019) found that resource diversity, and not abundance, was related to the magnitude of modularity in individual-resource networks of 4 populations of the Brazilian gracile mouse opossum. However, modularity values measured by De Camargo et al. (2019) were not significant, or lower than expected by chance: an outcome attributable to the use of unweighted rather than weighted network data (Miranda et al. 2019), and this approach probably weakened their findings. Pires and De Melo (2020), by contrast, found that resource abundance drives seasonal changes in modularity for the Helmeted Manakin in Brazil, but a proper measurement of resource diversity is lacking from their study. Ultimately, our work both directly measured resource abundance and diversity, and employed an exhaustive analytical framework consisting of the application of weighted individual-resource networks in the framework of ODT, confirming the predominant effect of resource diversity on inter-individual resource variation.
Here, we focused on the extrinsic causes of inter-individual resources variation, and in particular on the effect of ecological opportunity on the emergence of network structures, attributable to an asymmetric resource use by individuals. By applying the general framework of the ODT to individual-resource networks, we successfully disentangled the effect of resource diversity from resource abundance within the concept of ecological opportunity (Wellborn & Langherans 2015; Stroud & Losos 2016), confirming that resource diversity promotes inter-individual resource variation and that this pattern is directly linked to the emergence of modular structures in the prey–predator network.
ACKNOWLEDGMENTS
Capture permits were issued by the Italian Ministry of Environment (DPN–2008–0008213 and PNM–II–2012–0015691) and by the Prefecture of Haute Corse, France (2B–2018–01–92–004).
CONFLICT OF INTEREST
The authors declare that they have no competing interest.


