An examination of commingled first tarsometatarsal and atlantoaxial joints by deviation analysis
Presented in part at the 89th Annual Meeting for the Society for American Archaeologists, April 17–21, 2024, in New Orleans, LA.
Abstract
This study follows up on previous research conducted by Litavec (J Forensic Sci., 68, 2023, 1780) on sorting commingled sacroiliac joints using deviation analysis. In the present report, the results of this technique are expanded to separating commingled first tarsometatarsal and atlantoaxial joints. Following the methods of Litavec (J Forensic Sci., 68, 2023, 1780), virtual models were created at the University of Tennessee-Knoxville Donated Skeletal Collection from 69 atlases and axes, 66 first metatarsals, and 64 medial cuneiforms using an EinScan-Pro 2x+ Handheld Surface Scanner. The shape and congruency of the articular surfaces were analyzed using a deviation analysis in Geomagic Wrap 2021. Receiver operating characteristic curves were conducted on reference samples composed of 200 commingled and non-commingled bone pairs per joint to identify threshold values for sorting the remains. Validation samples of 225 pairs were subsequently analyzed to identify the efficacy of this method on a sample of unknown individuals. The statistical analyses confirmed that deviation analysis values from commingled first tarsometatarsal and atlantoaxial joint pairs were significantly larger than those from non-commingled individuals (p < 0.0001). 87%–92% of first tarsometatarsal pairs and 63%–66% of atlantoaxial joint pairs were correctly sorted based on the selected threshold values. This study increases the number of joints able to be sorted by deviation analysis and reemphasizes its value as a technique for resolving commingled human remains.
Highlights
- 3D models of the first tarsometatarsal and atlantoaxial joints were examined to resolve commingling.
- 87%–92% of first tarsometatarsal pairs and 63%–66% of atlantoaxial pairs were correctly sorted.
- Deviation analyses can resolve commingled first tarsometatarsal joints but not atlantoaxial joints.
1 INTRODUCTION
Commingled skeletal remains present a complex problem in the field of forensic anthropology, as they further complicate the identification process. Natural disasters, wars, conflicts, terrorist attacks, and airplane crashes are all circumstances in which bones from more than one person can become mixed in an assemblage [1-8]. Since forensic anthropologists rely on data gleaned from multiple points of the skeleton for estimating the biological profile, commingled remains can impede the personal identification process if they cannot be sorted [9]. Additionally, skeletal elements may not be returned to a decedent's family for final disposition if portions of the body cannot be reassociated with the appropriate individual [10]. As a result, it is important to sort all commingled remains for identification.
Out of the many methods available for sorting commingled human remains, joint articulation analysis has been documented as a reliable technique for individualization [1]. Researchers using joint articulation analysis presume that articular surfaces from one individual will be more similar in size and shape than those surfaces between individuals. However, the resolution of commingled joints presents an ongoing challenge within anthropology, as many regions, particularly smaller joints such as the vertebrae or feet, have few methods available for their reassociation. Rather, the majority of commingling literature focuses on large joints of the body, including the hip, knee, or ankle joint, leaving smaller joints with limited options for their resolution [11-21]. As a result, some joints can be reassociated with high levels of confidence, while others are more difficult to individuate.
Another problem inherent to current joint articulation methods is that many are subjective and/or difficult to apply to all types of joints. Visual assessment, for instance, relies on the practitioner to manually fit two articulating portions together to determine goodness of fit [22, 23]. However, classification rates have not been established, and this method is open to observer error and reliant on extensive anatomical and osteological knowledge [9]. These methods often include the smaller joints of the body; however, they are frequently grouped together by region. Byrd and Adams [9] and Puerto et al. [23], for example, investigate the possibility of using hand, foot, and vertebral joints for reassociation. However, they only provide a level of confidence in sorting the entire articulating region rather than each separate joint [9, 23]. Therefore, specific joints, such as the first tarsometatarsal or atlantoaxial joints, have no individual classification rates available for reassociation.
In comparison, osteometric sorting models provide a statistical means for excluding potential pairs of commingled remains [12]. However, these strategies often overlook smaller joints of the body [11, 12, 14, 17, 18, 21]. One possibility for this lack of emphasis may result from the inherent difficulty in taking measurements on small articular surfaces. Since the amount of metric variation in these joints is likely minimal between individuals, osteometric sorting may not be a useful means of sorting smaller commingled joints. For instance, Brandt-Litavec [24] found that only 60% of commingled pairs could be correctly excluded as a match when osteometric sorting was applied to the first tarsometatarsal joint. Further, the linear measurements used in osteometric sorting reduce the available data to a single aspect of the joint facet, while important information regarding the remainder of the joint surface may be lost.
Although traditional instruments may not be able to measure the minute shape differences between commingled and non-commingled pairs of small bones, the field of virtual anthropology contains alternative methods that can quantify the disparities between articulating surfaces and capture more data than traditional techniques. An example of such an approach is the deviation analysis method developed by Litavec [25], which focused on sorting commingled sacroiliac joints. This technique facilitated the virtual comparison of three-dimensional models created from laser-scanned data. In Litavec [25], the author successfully distinguished between commingled and non-commingled sacroiliac joints from individuals of varying demographic groups. Further, they identified that commingled sacroiliac joints could be reassociated with high levels of accuracy, between 98% and 100%.
The benefit of this method is that comparisons are relatively easy and quick to compute, are less subject to inter- and intraobserver error, and do not require specific anatomical landmarks for analysis, unlike previous sorting strategies. Another advantage of this research is that it highlights the ability of virtual anthropology techniques to help reassociate commingled remains, rather than simply excluding potential matches. However, the limitation of Litavec [25] is that the author only examined one out of many possible joints potentially present in a commingled assemblage.
Therefore, the current study aims to add to the number of commingled joints able to be sorted using deviation analysis by expanding the approach of Litavec [25] to the lateral atlantoaxial and first tarsometatarsal joints. The lateral atlantoaxial joint, hereafter referred to as simply the atlantoaxial joint, is composed of the first cervical (atlas) and second cervical (axis) vertebrae and is found between the inferior and superior articular facets. The first tarsometatarsal joint is situated between the medial cuneiform and first metatarsal. These two joints were selected due to several important considerations. First, these particular joints fit within the parameters of the methodology, in that the articular facets must be flat and similarly shaped on each side of the bone. Additionally, these joints are both gliding joints, allowing for an in-depth comparison of the congruence of articular surfaces between the same types of synovial joint. Lastly, these two regions have not been thoroughly researched in previous commingling analyses.
The first two hypotheses tested in this study are similar to those in Litavec [25]: (1) that deviation analyses conducted on first tarsometatarsal and atlantoaxial joint pairs will be able to sort commingled remains, regardless of a person's attributes (sex, age-at-death, body weight, and stature); and (2) the first tarsometatarsal and atlantoaxial joint surfaces within individuals will be more similar than those between individuals. The third hypothesis tested is that the resulting classification rates will be comparable to previous research that has focused on separating these commingled joints with osteometric sorting and visual assessment.
2 MATERIALS AND METHODS
2.1 Reference samples
The reference sample elements derive from the same individuals as Litavec [25]. 46 individuals' atlas, axis, left medial cuneiform, and left first metatarsal bones were selected from skeletal specimens at the University of Tennessee-Knoxville Donated Skeletal Collection for the creation of these virtual models (Table 1). Only the left side of each element was examined following standard convention [26]. Those individuals that were included in this study needed to fulfill certain criteria, such as having an age-at-death of 18 or older and lacking pathological lesions or postmortem damage at the two joint surfaces, including osteoarthritic growth or extreme fragmentation.
| Minimum | Maximum | Mean | Standard deviation | Total | |
|---|---|---|---|---|---|
| Age at death | 23 | 86 | 52 | 15.26 | 46 |
| Stature (in.) | 60 | 73 | 68 | 3.57 | 46 |
| Weight (lbs) | 95 | 516 | 206 | 78.66 | 46 |
| Males | – | – | – | – | 24 |
| Females | – | – | – | – | 22 |
From these 46 individuals, a reference sample was assembled for each joint. Each reference sample contained 200 pairs of bones and was divided into non-commingled and artificially commingled samples (Table 2). The non-commingled sample consisted of these 46 individuals' atlases, axes, left medial cuneiforms, and left first metatarsals. The artificially commingled sample contained the same 46 bone pairs; however, these models were purposefully commingled to create new interindividual joint combinations. For example, individual 1's atlas could be paired with individual 2's axis to generate one commingled atlantoaxial joint pair. Of the 2070 possible combinations at each joint, 154 of those pairs were randomly selected to form the artificially commingled sample. A concerted effort was made to include joint pairs from individuals with opposing demographic characteristics (i.e., a male over 50 and a female under 50) in addition to pairs from individuals within the same demographic category (i.e., bones from two males under 50). In all reference samples, the author was aware of the commingling status (commingled or non-commingled) of each bone pair prior to analysis.
| Reference sample | Non-commingled pairs | Commingled pairs | Total pairs |
|---|---|---|---|
| Atlantoaxial pairs | 46 | 154 | 200 |
| First tarsometatarsal pairs | 46 | 154 | 200 |
2.2 Validation samples
To validate this method on a sample of bone pairs with unknown commingling status, a second set of joints from this same skeletal collection was also scanned. Virtual models were created from 23 additional atlases and axes, 20 left first metatarsals, and 18 left medial cuneiforms. Some of these elements had a matching articulating portion scanned and others did not. A third party was tasked with selecting 15 sets of each joint with an unknown percentage of true pairs (Table 3). This same third party compiled the information into a password-protected key in a Microsoft Excel [27] workbook. This workbook only became accessible to the author post-analysis in order to prevent her from knowing the correct origin of each tested joint. All possible joint combinations were examined, resulting in 225 potential articulations in each sample (Table 3).
| Validation sample | Non-commingled pairs | Commingled pairs | Total pairs |
|---|---|---|---|
| Atlantoaxial pairs | 10 | 215 | 225 |
| First tarsometatarsal pairs | 11 | 214 | 225 |
2.3 Scanning protocol
As employed by Litavec [25], an EinScan-Pro 2x+ Handheld Surface Scanner [28] was selected to scan each element. The fixed scan mode was used with eight turntable steps at 45-degree increment rotations to ensure that all sides were completely scanned. A complete scan, where all sides of each element are captured, is accomplished in approximately 10 min, depending on the number of orientations needed. The Exscan-Pro software program accompanying this scanner generates a watertight model by automatically aligning and merging all meshes after each scan [28]. All models were saved in stereolithography (.stl) format.
2.4 Deviation analyses
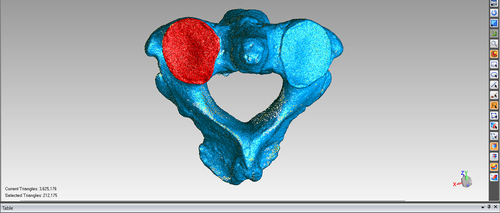
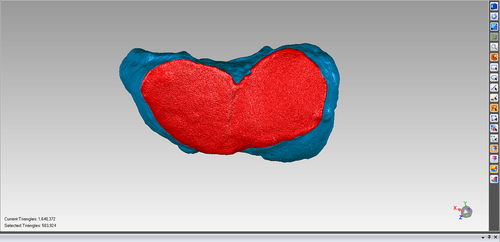
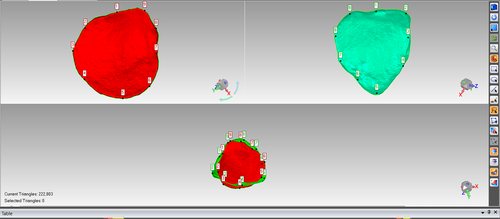
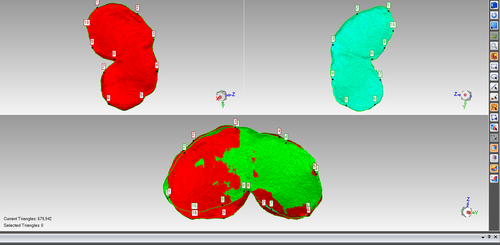
The virtual joint surfaces were analyzed via deviation analysis in Geomagic Wrap [29], according to the methods of Litavec [25]. Both bones from each joint pair were imported, and the articular surfaces were selected and cropped from the virtual models to guarantee that only the joint surfaces were analyzed (Figures 1 and 2). Afterwards, the polygon normals of all axes and medial cuneiforms were flipped, and the cropped surfaces were aligned via manual and global registration. N-point registration was performed as the mode of selection, with 9 points for the atlantoaxial joints and 10 points chosen for the first tarsometatarsal joints (Figures 3 and 4). The global registration function was subsequently performed once on each pair to further refine the alignment, with all default settings remaining in place. This process takes about 4 minutes to complete per bone.
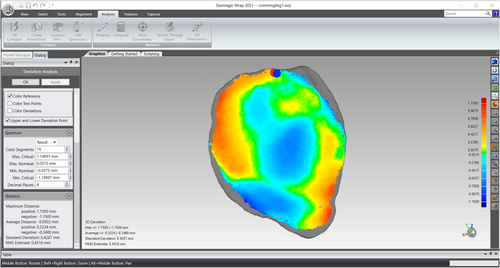
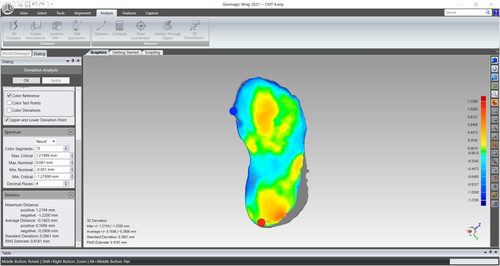
The deviation analyses were conducted after the cropped portions of each joint surface were aligned (Figures 5 and 6). The axes and medial cuneiforms were labeled as “reference” models against which the “test” models (atlases and first metatarsals) were compared. All additional parameters remained at the default setting. A comparison can be generated in 2 min and, therefore, the total time from scanning to generating a potential pair match is approximately 30 min. The statistics of the deviations between models were all recorded as potential variables for sorting commingled remains (Figures 5 and 6). Additionally, the location and magnitude of the deviations were recorded from the color deviation map as a ‘Qualitative Assessment’ score, according to the guidelines published in Litavec [25] (Figures 5 and 6).
2.5 Statistical analyses
After all deviation analysis values were recorded from the reference sample pairs, receiver operating characteristic (ROC) curves identified which output values most efficiently sorted commingled atlantoaxial and first tarsometatarsal joints. Following the methods of Litavec [25], true-positives were categorized as correctly identified commingled pairs and true-negatives were classified as correctly identified non-commingled pairs. Each deviation analysis value's effectiveness was estimated by using the area under the curve (AUC). AUC values needed to reach statistical significance and obtain a minimum value of 0.5, or ideally closer to 1, to be considered for the creation of threshold values.
The generated ROC curves were further investigated to pinpoint the optimal threshold values. Cut-off points with the highest sensitivity and lowest false-positive probability were selected from those variables achieving the highest AUC at each joint. These threshold values were applied to the reference sample to classify commingled and non-commingled atlantoaxial and first tarsometatarsal joints when the true origin of each pair was known to the author. The threshold values were then applied to the validation sample to test the author's ability to sort joint pairs with unknown commingling status. Inter- and intra-observer error were evaluated with the technical error of measurement (TEM), relative TEM (%TEM), and the coefficient of reliability (R) and calculated in a Microsoft Excel workbook [25, 26, 30, 31]. Ten randomly selected combinations of commingled and non-commingled atlantoaxial and first tarsometatarsal joints from the reference sample were re-analyzed for both observer error tests.
Mann–Whitney U-tests were subsequently performed to evaluate the null hypothesis that there is no significant difference between the deviation analysis values generated for commingled and non-commingled groups. This same test was also implemented to observe if any of the demographic characteristics (age-at-death, body weight, sex, and stature) significantly impacted the distribution of these variables in the reference samples. All statistical analyses were conducted in the SPSS statistical software platform [32]. Positive and negative predictive values were also calculated for each variable based on the methods of Klepinger and Giles [33], in order to compare the results between the reference and validation samples. Lastly, Fisher's exact tests were performed to confirm if the number of pairs sorted with these threshold values was statistically significant in all samples.
3 RESULTS
3.1 Atlantoaxial reference sample
The inter- and intraobserver error results for the atlantoaxial joint pairs are presented in Table 4. The interobserver TEM ranges from 0.00 mm (Standard Deviation) to 0.05 mm (Qualitative Assessment), and the intraobserver TEM ranges from 0.001 mm (Average Distance) to 0.15 mm (Qualitative Assessment). No measurements exceeded 1 mm. The interobserver %TEM ranges from 0.07% (Standard Deviation) to 3.58% (Average Distance), and the intraobserver %TEM ranges from 1.05% (Average Distance) to 4.8% (Maximum Deviation). All intra- and interobserver R values surpassed 0.9 for all tested variables (Table 4). The intraobserver R value for the Qualitative Assessment score was the lowest at 0.94. As a result, all R values represent excellent agreement within and between observers.
| Atlantoaxial joint | Maximum deviation | Average distance | Standard deviation | RMS | Qualitative assessment |
|---|---|---|---|---|---|
| Intraobserver TEM (mm) | 0.042 | 0.001 | 0.005 | 0.005 | 0.15 |
| Interobserver TEM (mm) | 0.001 | 0.003 | 0.000 | 0.001 | 0.05 |
| Intraobserver %TEM | 4.798 | 1.052 | 1.257 | 1.224 | 3.371 |
| Interobserver %TEM | 0.107 | 3.577 | 0.066 | 0.194 | 1.087 |
| Intraobserver R | 0.977 | 0.999 | 0.997 | 0.997 | 0.938 |
| Interobserver R | 0.999 | 0.998 | 0.999 | 0.999 | 0.990 |
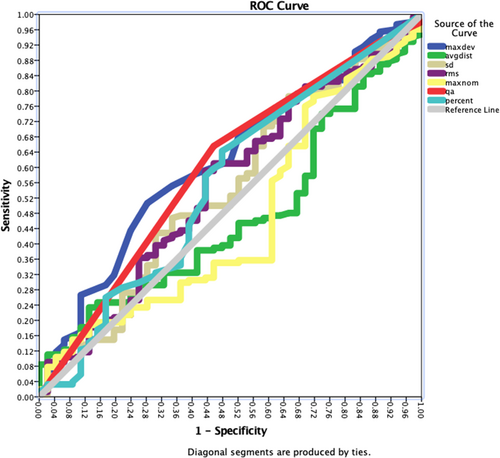
Figure 7 displays the results of the ROC curve and all deviation analysis variables in the reference sample. Only the Maximum Deviation and Qualitative Assessment scores were statistically significant at the p < 0.05 level for the atlantoaxial joint. Therefore, all other variables were removed from further analyses. Despite achieving the criteria of statistical significance, the AUC scores for both variables were quite low, around 0.6 (Table 5).
| Variable | Threshold value | Se | Sp | AUC | PV+ (%) | Error rate | PV− (%) | Error rate | Overall classification rate (%) |
|---|---|---|---|---|---|---|---|---|---|
| Maximum deviation | 0.795 | 0.688 | 0.478 | 0.614 | 81.5 | 18.5 | 31.4 | 68.6 | 64 |
| Qualitative assessment | 4.5 | 0.656 | 0.543 | 0.598 | 82.8 | 17.2 | 32.1 | 67.9 | 63 |
| Combination score | 4.95 | 0.707 | 0.5 | 0.661 | 82.6 | 17.4 | 33.8 | 66.2 | 66 |
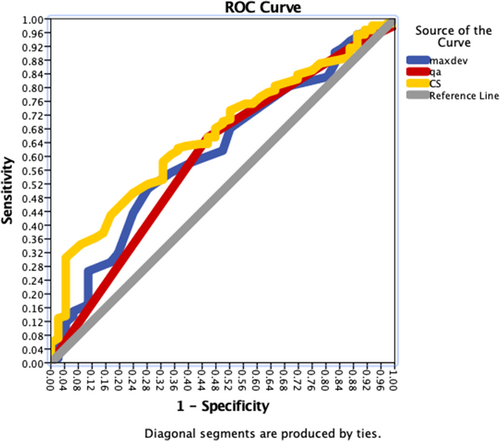
The Maximum Deviation and Qualitative Assessment values were, therefore, the only variables selected for the creation of threshold values. Additionally, a Combination Score was created from the summation of both values per pair, as conducted in Litavec [25]. When a second ROC curve was generated including these three variables, the Combination Score had the highest AUC value (Figure 8). The results of a Mann–Whitney's U-test further confirmed the significance of these three variables on commingling status and identified the mean differences between commingled and non-commingled groups. All three variables were significant (p < 0.05) in that the commingled joint pairs had larger group means than the non-commingled pairs. Table 6 summarizes the descriptive statistics for all three selected variables.
| Variable | Non-commingled pairs | Commingled pairs | ||||||
|---|---|---|---|---|---|---|---|---|
| N | Range | Mean | SD | N | Range | Mean | SD | |
| Maximum deviation | 46 | 0.67–1.38 | 0.82 | 0.11 | 154 | 0.62–1.77 | 0.86 | 0.14 |
| Qualitative assessment | 46 | 3.0–5.0 | 4.35 | 0.67 | 154 | 2.0–5.0 | 4.56 | 0.69 |
| Combination score | 46 | 3.74–5.93 | 5.17 | 0.65 | 154 | 2.99–6.16 | 5.42 | 0.63 |
The threshold values for separating commingled atlantoaxial joint pairs were determined through the examination of this second ROC curve (Table 5). The most effective cut-off point was selected for each variable by maximizing the sensitivity and specificity of each test. Once each threshold value was chosen, the reference sample was re-examined. Any deviation analysis value less than the threshold classified a joint pair as non-commingled, while values greater than or equal to the threshold were categorized as commingled. The predictive values generated at the atlantoaxial joint demonstrate how much confidence an analyst can have in assuming variables above or below the threshold values are correct (Table 5). For example, if a practitioner were to assume that an atlantoaxial joint pair with a Combination Score of less than 4.95 was non-commingled, they would only have a 17% chance of being correct in that assessment [33]. In contrast, if an analyst assumes that a joint pair with a Combination Score greater than 4.95 is commingled, then they will have an 83% chance of being correct in that determination [33].
The Combination Score achieved the highest sensitivity, while the Qualitative Assessment value obtained the highest specificity (Table 5). The Maximum Deviation and Qualitative Assessment variables were also highly effective at identifying commingled pairs, with only slightly lower sensitivity values (Table 5). The Combination Score also obtained the highest overall classification rate at 66%; however, only 23 out of 46 non-commingled pairs and 109 out of 154 commingled joints were correctly identified (Table 7). The Maximum Deviation misclassified the most non-commingled pairs and only correctly categorized 106 commingled pairs (Table 7). The Qualitative Assessment value classified the most non-commingled individuals but, conversely, the fewest commingled pairs correctly, resulting in the lowest overall classification rate of the three variables (Table 7). Fisher's exact tests were conducted on these three variables to confirm that the results were significantly different between commingled and non-commingled groups separated by the threshold values (p < 0.0001). Despite the low classification rates, all threshold values were selected to sort the atlantoaxial joint's validation sample, as no other variables were likely to perform any more effectively.
| Variable | Correctly identified non-commingled pairs | Correctly rejected commingled pairs | Overall classification rate (%) |
|---|---|---|---|
| Maximum deviation | 22/46 | 106/154 | 64 |
| Qualitative assessment | 25/46 | 101/154 | 63 |
| Combination score | 23/46 | 109/154 | 66 |
3.2 Atlantoaxial validation sample
The threshold values created from the reference sample were used to sort the atlantoaxial joint pairs in the validation sample. As observed in Table 8, the Qualitative Assessment threshold value identified 70% of non-commingled pairs in the validation sample, although it only classified 78 out of 215 commingled pairs correctly, the fewest out of all three variables. The Maximum Deviation threshold value sorted the least amount of non-commingled pairs, but contrastingly the most commingled pairs, correctly (Table 8). The Combination Score threshold value performed between the two.
| Variable | Correctly identified non-commingled pairs | Correctly rejected commingled pairs | Overall classification rate (%) |
|---|---|---|---|
| Maximum deviation | 3/10 | 144/215 | 65.3 |
| Qualitative assessment | 7/10 | 78/215 | 37.8 |
| Combination score | 4/10 | 100/215 | 46.2 |
Between the validation and reference sample results, all sensitivity and most specificity values decreased, as did the overall classification rates (Table 9). However, the positive predictive values all slightly increased, demonstrating that these variables are more effective at identifying commingled pairs when the sample size increases. It should be noted, however, that this result is also likely a reflection of the fact that any given pair is more likely to be commingled than non-commingled. If, for example, the Combination Score's predictive values are modified to reflect a commingling scenario with two individuals or 50% prevalence instead of 96%, then the positive predictive value decreases to 42% and the negative predictive value increases to 43%.
| Variable | Se | Sp | PV+ (%) | Error rate | PV− (%) | Error rate | Overall classification rate (%) |
|---|---|---|---|---|---|---|---|
| Maximum deviation | 0.67 | 0.30 | 95.4 | 4.6 | 4 | 96 | 65.3 |
| Qualitative assessment | 0.36 | 0.70 | 96.3 | 3.7 | 4.9 | 95.1 | 37.8 |
| Combination score | 0.47 | 0.40 | 94.3 | 5.7 | 3.3 | 96.7 | 46.2 |
3.3 First tarsometatarsal reference sample
The TEM, %TEM, and R values for the first tarsometatarsal joint's inter- and intraobserver error are presented in Table 10. The interobserver TEM ranges from 0.00 mm (Average Distance) to 0.25 mm (Qualitative Assessment), and the intraobserver TEM ranges from 0.00 mm (Root-Mean-Square) to 0.075 mm (Qualitative Assessment). No measurement exceeded 1 mm. The interobserver %TEM ranges from 0.2% (Standard Deviation) to 11.36% (Qualitative Assessment), and the intraobserver %TEM ranges from 0.14% (Root-Mean-Square) to 3.95% (Qualitative Assessment). All inter- and intraobserver R values surpassed 0.9 for all tested variables at the first tarsometatarsal joint (Table 10). The interobserver Qualitative Assessment score was the lowest at 0.95. Therefore, all R values represent excellent agreement within and between observers for all variables.
| First tarsometatarsal joint | Maximum deviation | Average distance | Standard deviation | Root-mean-square | Qualitative assessment |
|---|---|---|---|---|---|
| Intraobserver TEM (mm) | 0.007 | 0.001 | 0.001 | 0.000 | 0.075 |
| Interobserver TEM (mm) | 0.005 | 0.000 | 0.001 | 0.001 | 0.25 |
| Intraobserver %TEM | 0.494 | 1.031 | 0.163 | 0.14 | 3.947 |
| Interobserver %TEM | 0.355 | 0.587 | 0.196 | 0.240 | 11.364 |
| Intraobserver R | 0.998 | 0.999 | 0.999 | 0.999 | 0.991 |
| Interobserver R | 0.999 | 0.999 | 0.999 | 0.999 | 0.953 |
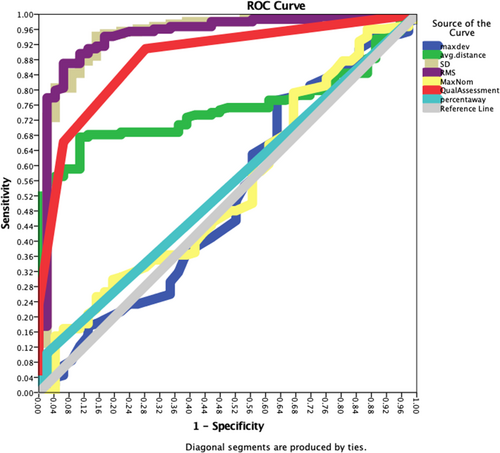
Figure 9 displays the results of the ROC curve and all deviation analysis variables in the reference sample. Most values were statistically significant at the p < 0.05 level. The variables that did not quite reach statistical significance included the Maximum Deviation, Maximum Nominal, and Percentage Away values, and thus were removed from further analyses. The AUC scores for the remaining variables ranged from 0.495 to 0.959, and any values below 0.8 were not incorporated in further analyses. Therefore, threshold values were only created for the Root-Mean-Square, Standard Deviation, and Qualitative Assessment variables.
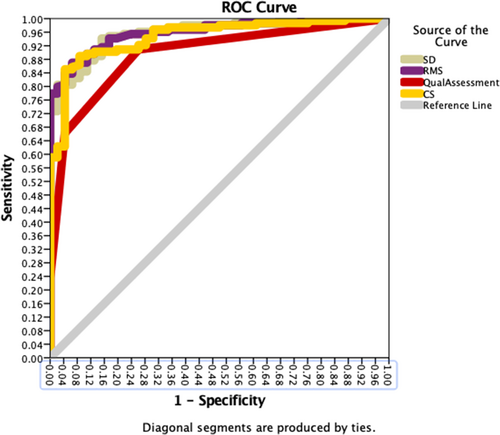
A Combination Score was also created for the first tarsometatarsal joint by summing these three values for each pair. When a second ROC curve was generated including all four variables, the Root-Mean-Square value had the highest AUC (Table 11). The results of a Mann–Whitney's U test further confirmed the significance of these four variables on commingling status and identified the mean differences between commingled and non-commingled groups. All were significant (p < 0.001) in that the non-commingled joint pairs had smaller group means than the commingled pairs (Table 12). The descriptive statistics for all four selected variables are summarized in Table 12.
| Variable | Threshold value | Se | Sp | AUC | PV+ (%) | Error rate | PV− (%) | Error rate | Overall classification rate (%) |
|---|---|---|---|---|---|---|---|---|---|
| Root-mean-square | 0.3542 | 0.909 | 0.87 | 0.944 | 95.9 | 4.1 | 74.1 | 25.9 | 90 |
| Standard deviation | 0.3294 | 0.942 | 0.848 | 0.943 | 95.4 | 4.6 | 81.3 | 18.7 | 92 |
| Qualitative assessment | 1.5 | 0.909 | 0.739 | 0.885 | 92 | 8 | 70.8 | 29.2 | 87 |
| Combination score | 2.6232 | 0.909 | 0.869 | 0.947 | 95.9 | 4.1 | 74 | 26 | 90 |
| Variable | Non-commingled pairs | Commingled pairs | ||||||
|---|---|---|---|---|---|---|---|---|
| N | Range | Mean | SD | N | Range | Mean | SD | |
| Root-mean-square | 46 | 0.19–0.39 | 0.29 | 0.05 | 154 | 0.23–0.71 | 0.46 | 0.09 |
| Standard deviation | 46 | 0.19–0.39 | 0.28 | 0.05 | 154 | 0.23–0.68 | 0.44 | 0.09 |
| Qualitative assessment | 46 | 1.0–3.0 | 1.30 | 0.55 | 154 | 1.0–5.0 | 2.84 | 0.97 |
| Combination score | 46 | 1.38–3.79 | 1.88 | 0.60 | 154 | 1.46–6.33 | 3.75 | 1.09 |
The threshold values for separating commingled first tarsometatarsal joint pairs were determined through the examination of a second ROC curve (Figure 10). Once each threshold value was chosen, the reference sample was re-examined. The positive and negative predictive values illustrate how successfully these threshold values were able to sort commingled pairs (Table 11). For example, if an analyst assumes that a joint pair with a Standard Deviation value greater than 0.3294 is commingled, they will have a 95.4% chance of being correct in that determination [33]. In contrast, assuming a joint pair with a Standard Deviation of less than 0.3294 is not commingled would result in an 81.3% chance of being correct in that assessment [33].
The Standard Deviation achieved the highest sensitivity, and the Root-Mean-Square obtained the highest specificity (Table 11). The Combination Score and Qualitative Assessment variables were also highly reliable, with only slightly lower sensitivity values (Table 11). Additionally, the Standard Deviation had the highest overall classification rate, identifying 39 out of 46 non-commingled pairs correctly and only misidentifying nine commingled pairs for an overall classification rate of 92% (Table 13). The Root-Mean-Square and Combination Score identified the most non-commingled pairs correctly and classified 140 out of 154 commingled pairs (Table 13). The Qualitative Assessment values identified the fewest non-commingled pairs correctly, resulting in the lowest overall classification rate out of the three variables (Table 13). Fisher's exact tests were also conducted on these four variables to confirm that the results were significantly different between commingled and non-commingled groups separated by the threshold values (p < 0.0001). All variables were chosen to sort the first tarsometatarsal joint validation sample, except the Qualitative Assessment score, as it obtained the lowest classification rate.
| Variable | Correctly identified non-commingled pairs | Correctly rejected commingled pairs | Overall classification rate (%) |
|---|---|---|---|
| Root-mean-square | 40/46 | 140/154 | 90 |
| Standard deviation | 39/46 | 145/154 | 92 |
| Qualitative assessment | 34/46 | 140/154 | 87 |
| Combination score | 40/46 | 140/154 | 90 |
3.4 First tarsometatarsal validation sample
The Standard Deviation, Root-Mean-Square, and Combination Score threshold values determined from the reference sample classified the majority of pairs in the validation sample. As seen in Table 14, the Standard Deviation and Root-Mean-Square threshold values identified the most non-commingled pairs, although the Combination Score also correctly categorized a substantial number of true pairs. Conversely, the Combination Score classified the preponderance of commingled pairs, followed by the Standard Deviation, and lastly the Root-Mean-Square (Table 14). The Root-Mean-Square threshold had the lowest classification rate, while the Combination Score had the highest classification rate in the validation sample (Table 14).
| Variable | Correctly identified non-commingled pairs | Correctly rejected commingled pairs | Overall classification rate (%) |
|---|---|---|---|
| Standard deviation | 10/11 | 173/214 | 81.3 |
| Root-mean-square | 10/11 | 157/214 | 74.2 |
| Combination score | 9/11 | 178/214 | 83.1 |
In comparison to the reference sample, the sensitivity, specificity, and negative predictive values decreased for all variables, despite the high classification rates for non-commingled pairs (Table 15). The high positive predictive values, regardless of reference or validation sample, highlight the utility of this method in excluding commingled individuals at the first tarsometatarsal joint. However, the negative predictive values indicate that the reassociation capacity is somewhat limited. These lower negative predictive values may be the result of the greater number of commingled joints overall. Again, if the prevalence of the Combination Score is changed to 50%, the PV+ slightly decreases to 90%, and the PV− dramatically increases to 83%.
| Variable | Se | Sp | PV+ (%) | Error rate | PV− (%) | Error rate | Overall classification rate (%) |
|---|---|---|---|---|---|---|---|
| Standard deviation | 0.81 | 0.91 | 99.4 | 1.6 | 19.6 | 80.4 | 81.3 |
| Root-mean-square | 0.73 | 0.91 | 99.3 | 0.7 | 14.9 | 86.1 | 74.2 |
| Combination score | 0.83 | 0.82 | 98.9 | 1.1 | 20 | 80 | 83.1 |
3.5 Impact of the demographic characteristics
Only those deviation analysis values that were applied to the validation samples were assessed for the impact of the demographic characteristics. Each commingled and non-commingled group was examined individually in order to avoid any confluence between commingling status and the demographic characteristics. No values in the commingled sample of either the atlantoaxial or first tarsometatarsal joints were affected by any demographic characteristics. In the non-commingled samples, however, the Standard Deviation for the first tarsometatarsal joint was significantly influenced by one of the demographic characteristics (Table 16). Based on a Mann–Whitney U-test, males have significantly higher Standard Deviation values than females (p = 0.024). Additionally, several demographic characteristics significantly impacted the atlantoaxial joint deviation analysis variables in the non-commingled reference sample (Table 17).
| Mann–Whitney U-test variable | Sex | N | Mean rank | Sum of ranks | p-Value |
|---|---|---|---|---|---|
| Standard deviation | Male | 24 | 27.79 | 667.00 | |
| Female | 22 | 18.82 | 414.00 | 0.024 |
| Variable | Sex | N | Mean rank | Sum of ranks | p-Value |
|---|---|---|---|---|---|
| Maximum deviation | Male | 24 | 27.21 | 653.00 | |
| Female | 22 | 19.45 | 428.00 | 0.05 | |
| Qualitative assessment | Male | 24 | 18.88 | 453.00 | |
| Female | 22 | 28.55 | 628.00 | 0.007 |
| Variable | Stature | N | Mean rank | Sum of ranks | p-Value |
|---|---|---|---|---|---|
| Maximum deviation | <67.5 in. | 20 | 17.93 | 358.50 | |
| >67.5 in. | 26 | 27.29 | 722.50 | 0.013 | |
| Qualitative assessment | <67.5 in. | 20 | 29.85 | 597.00 | |
| >67.5 in. | 26 | 18.62 | 484.00 | 0.002 | |
| Combination score | <67.5 in. | 20 | 28.30 | 566.00 | |
| >67.5 in. | 26 | 19.81 | 515.00 | 0.033 |
Mann–Whitney U-tests at the atlantoaxial joint revealed that an individual's stature (p = 0.013) and sex (p = 0.05) significantly affect the distribution of the Maximum Deviation value (Table 17). Specifically, individuals taller than the reference sample's mean of 68 inches have significantly higher Maximum Deviation values than shorter individuals, and males have larger values than females. The Qualitative Assessment scores are also significantly impacted by sex (p = 0.007) and stature (p = 0.002), while the Combination Score is only significantly affected by stature (p = 0.033) (Table 17). In contrast to the Maximum Deviation values, shorter individuals are more likely to have higher Qualitative Assessment and Combination Scores than taller individuals. Additionally, females are more likely to exhibit larger Qualitative Assessment values than males.
4 DISCUSSION
The atlantoaxial and first tarsometatarsal joints were examined to evaluate the efficacy of deviation analyses in sorting commingled remains at these locations. This study successfully expands upon the number of joints able to be sorted using the method from Litavec [25]. As most commingling resolution studies only focus on articulating regions or large joints of the body, this research benefits forensic anthropologists by providing a new method for sorting two small joints and a pathway for including additional locations in the future. As a result, this study not only contributes to ongoing discussions of joint similarity, particularly within joints less frequently examined, but also adds to a forensic anthropologist's toolkit for resolving smaller and often underinvestigated joints of the body.
4.1 Atlantoaxial joint
Although the deviation analysis assisted in sorting commingled atlantoaxial joints, the classification rates were far too low to be effectively employed in forensic casework. For instance, the best-performing variable, the Combination Score threshold value, only eliminated 71% of commingled pairs. Additionally, several demographic characteristics significantly impacted the results. Stature affected the distribution of the Maximum Deviation, Qualitative Assessment, and Combination Score values, and sex impacted both the Maximum Deviation and Qualitative Assessment scores. This result indicates that sex greatly affects the similarity of atlantoaxial joint surfaces within an individual.
It is possible that aspects of an individual's sex are impacting the cervical region that can account for these discrepancies. For example, total cervical spine rotation appears to be greater in females than in males [34]. This increased rotational ability may help explain why females are more likely to have larger Qualitative Assessment values, as greater joint mobility often translates to less congruent joint surfaces. For instance, the glenohumeral joint displays a large degree of mobility and, correspondingly, vastly dissimilar articular surfaces. Therefore, the less tight-fitting a joint is, the more incongruent the surface shapes may be within an individual. In this instance, as females have greater joint mobility, their atlantoaxial pairs may be more dissimilar, while the commingled male pairs have a greater likelihood of appearing more similar between individuals.
Further, there is a large degree of mobility permitted at this joint in contrast to the first tarsometatarsal and sacroiliac joints. The atlantoaxial joint permits up to 45 degrees of rotation, allowing individuals to turn their heads from side to side [35, 36]. In comparison, the sacroiliac joint only allows 2–3 degrees of movement, and its tight-fitting nature is likely a contributor to the high classification rates in sorting commingled remains in this region [25]. The increased range of motion at the atlantoaxial joint may explain its lack of success in sorting commingled remains effectively. It appears that the deviation analysis is predisposed to classifying tighter-fitting joints more efficiently than looser joints.
Nevertheless, the descriptive statistics establish that there is a significant difference between commingled and non-commingled group values. Specifically, the articular surfaces within individuals are significantly more similar than between individuals. However, there is still substantial overlap between group values, indicating that the articular surfaces are much more similar between individuals in comparison to other regions of the body (Table 6). It is probable that this overlap of values between individuals' atlantoaxial joints is responsible for the low classification rates. Additionally, the joint surfaces at this location are inherently more dissimilar within an individual compared to other joints, making it much more difficult to establish a true pair.
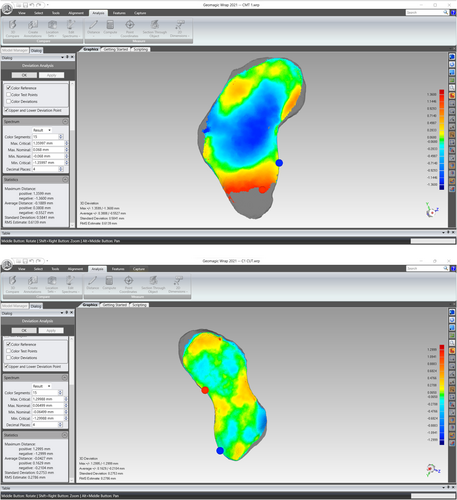
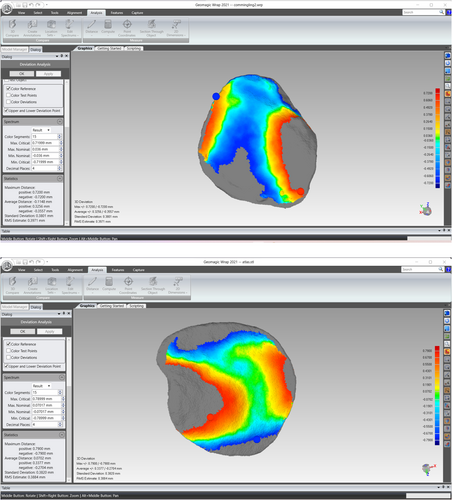
The values and graphical representation of the Qualitative Assessment scores demonstrate this premise well. Per Litavec [25], a score of 1 indicates that the values are very similar in shape, while a score of 5 indicates extreme dissimilarity. The first tarsometatarsal joints' Qualitative Assessment values do not surpass a score of 3 for non-commingled individuals and can range up to 5 for the commingled pairs. In comparison, none of the non-commingled atlantoaxial joint pairs had a Qualitative Assessment value below 3, while the commingled group held values between 2 and 5. Further, when examining the images generated from the deviation analysis, it is clearly distinguishable which first tarsometatarsal joint pair belongs to the commingled or non-commingled group (Figure 11); however, it is less apparent when examining the atlantoaxial joint (Figure 12). The atlantoaxial joint exhibits far less joint surface symmetry within individuals, making it more challenging for the deviation analysis to adequately identify a match. Therefore, the atlantoaxial joint classification rates are much lower than those generated at the first tarsometatarsal and sacroiliac joints. Additionally, this method also performs poorly compared to other methods used to reassociate commingled atlantoaxial joints.
Adams and Byrd [1], for example, described a high level of confidence in reassociating all vertebral joints, with the exception of the nearby atlanto-occipital joint, which was only placed in their moderate confidence category. Unfortunately, it is unknown exactly how many pairs were correctly reassociated in this study. A description of what qualified a joint to be placed in each confidence category was also not provided, making it difficult to compare their analysis to the current results. It is likely, however, that the deviation analysis method performs dramatically worse at reassociating atlantoaxial joint pairs than this previous research [1]. Puerto et al. [23] also placed all vertebral articulations into their high confidence category, which stipulated a correct classification rate of 90% or greater. The present method, in comparison, only correctly reassociated 54% or fewer pairs. Instead, the moderate confidence category from Puerto et al. [23] would be a more appropriate fit for the current results, as this grouping assumes an overall classification rate between 60% and 90%.
Further, it may be more prudent to examine the present results in relation to the nearby atlanto-occipital joint, which has demonstrated low classification accuracy as well [1, 19, 23, 37, 38]. Dudar and Castillo [37], for instance, found joint congruency within the atlanto-occipital joint only 23%–25% of the time, and Cappella et al. [38] identified just 32% of commingled pairs correctly. Finlayson [19] attempted to use both the surface area and radius of curvature of joint surfaces to separate a small sample of commingled individuals at the atlanto-occipital joint. While they were able to correctly sort the two joints using surface area, the radius of curvature values were too similar between individuals to reliably separate commingled pairs [19]. Therefore, the atlantoaxial joint in this study conforms more closely to the patterns established at the atlanto-occipital joint than to the results of vertebrae-to-vertebrae articulations found in Adams and Byrd [1] and Puerto et al. [23]. While there are functional differences between these two regions, the results appear to be similar, possibly due to the large degree of mobility present at these joint surfaces [39]. Much like the atlanto-occipital joint, the atlantoaxial joint is inherently difficult to sort when commingled.
4.2 First tarsometatarsal joint
In contrast to the atlantoaxial joint, the first tarsometatarsal joint results highlight the utility of using deviation analyses to sort commingled bone pairs. In the reference sample, the Standard Deviation threshold value accurately excluded the most commingled pairs, and the other three variables correctly removed a large number of mixed pairs as well. The Root-Mean-Square and Combination Score threshold values correctly identified the most non-commingled pairs. In the validation sample, the Combination Score threshold value was the most effective at eliminating commingled pairs, and the Standard Deviation and Root-Mean-Square thresholds identified nearly all non-commingled pairs. These results support the conclusion that deviation analyses conducted on first tarsometatarsal joint pairs can sort a majority of commingled remains correctly.
However, one demographic characteristic did significantly impact the Standard Deviation value at this joint. Specifically, non-commingled male pairs were more likely to generate higher Standard Deviation values than female pairs. No other variables were impacted by any other demographic characteristics. As there are documented differences in the shape and curvature of the first tarsometatarsal joint facets between males and females, it is plausible that sex could be affecting the Standard Deviation values. The first tarsometatarsal joint surface shape has been shown to vary between individuals and may be composed of one or more facets. Mason and Tanaka [40], for instance, noted that single- and triple-faceted articular surfaces are more common among males, while double-faceted surfaces are more frequent in females. Additionally, females tend to exhibit more obliquely curved articular facets than males, which could also impact the shape of the surfaces within individuals [41]. Although the Standard Deviation threshold value may be impacted by the condition of maleness at the first tarsometatarsal joint, the other three values were not significantly affected by any demographic characteristics. Therefore, it is recommended that practitioners use the other variables instead of the Standard Deviation threshold value to avoid any impact of sex on commingling status.
One reason behind the high classification rates at the first tarsometatarsal joint may lie in its tight-fitting nature. Previous research has demonstrated that the ratio between the size of the medial cuneiform and the first metatarsal articular surfaces is approximately 1:1, highlighting the close fit of this particular joint [42]. Additionally, there is very little movement permitted in this region. The first tarsometatarsal joint has a documented range of 6 degrees of rotational capacity, which is closer to the range of motion found at the sacroiliac joint than to the atlantoaxial joint [43-46]. In comparison to the results of the deviation analysis at the sacroiliac joint, however, the first tarsometatarsal joint separated slightly fewer pairs correctly [25]. While the deviation analysis at the sacroiliac joint sorted 98%–100% of pairs, only 87%–92% of pairs were separated at the first tarsometatarsal joint [25]. The small increase in range of motion at this location may account for the slight decrease in classification rates.
The difficulty with evaluating the performance of the current method in comparison to previous studies is that very little research has been conducted on commingled first tarsometatarsal joints. Although Adams and Byrd [1] placed all tarsometatarsal joints into their high confidence category, they did not explicitly state which specific joints were most accurately reassociated. It is likely, though, that the current project's results would similarly fall within the high confidence category, as the Root-Mean-Square and Combination Score threshold values correctly reassociated 87% of first tarsometatarsal joint pairs.
Brandt-Litavec [24] investigated whether the osteometric sorting models created by Byrd [11] could be effectively applied to commingled first tarsometatarsal joints. The author found that equations generated here could reassociate 90%–94% of pairs [24]. Therefore, the current study's results are comparable to this previous research, as nearly 90% of pairs were accurately reassociated. Additionally, the current study improved upon the exclusion rates of Brandt-Litavec [24], as only 50%–60% of pairs were correctly excluded, whereas 91%–94% of first tarsometatarsal commingled pairs were correctly excluded using deviation analysis. Therefore, it is recommended that this method be used to both exclude and reassociate first tarsometatarsal joints.
4.3 Limitations
The current study provides a pathway for sorting additional anatomical regions with deviation analysis. This technique expands upon the methods of Litavec [25] and allows for both the exclusion and reassociation of joint surfaces previously unexplored in past research. However, there are some limitations that future researchers could address to improve this study. As in Litavec [25], the right side of each joint was excluded from analysis in order to increase the sample size, and it is unknown whether this method would perform as effectively on right-sided elements. Further, although future researchers should continue testing this method on additional joint surfaces, caution is warranted when assuming that all joints will perform equally. Even small amounts of movement at an articulation may impact the efficacy of the deviation analysis. For instance, it is possible that the atlanto-occipital joint would not perform any more effectively than the atlantoaxial joint, as it similarly allows for a large range of motion [39]. However, researchers should confirm if this method can effectively sort joints with curvilinear surfaces in addition to flat surfaces, such as those found at the atlanto-occipital, temporomandibular, or humeroulnar joints.
5 CONCLUSION
A novel virtual anthropological approach to sorting commingled human remains was created by Litavec [25] at the sacroiliac joint and has now been applied to two additional joint surfaces. Using deviation analyses and ROC curves, 63%–66% of atlantoaxial pairs and 87%–92% of first tarsometatarsal pairs were correctly classified, depending on the threshold value selected. The Combination Score was the most effective at sorting commingled atlantoaxial joints, and the Qualitative Assessment value was the least effective. The Root-Mean-Square and Combination Scores were the most successful at sorting commingled first tarsometatarsal joints, and the Qualitative Assessment values were the least successful. It is recommended that future practitioners employ this method to both exclude and reassociate first tarsometatarsal joint pairs. The atlantoaxial joint should only be used to exclude potential articulations in conjunction with other methods.
ACKNOWLEDGMENTS
The author would like to thank Dr. Elizabeth DiGangi for her support and mentorship throughout this project. Thanks also go to Dr. Rolf Quam, Dr. Angela Soler, Dr. Ralph Garruto, and Dr. Laure Spake for their guidance and advice. The author is also grateful to Dr. Dawnie Steadman for granting access to the skeletal specimens at the William M. Bass Donated Skeletal Collection. Thank you also to Mei-Hsiu Chen at the Binghamton University Statistical Consulting Services for assistance with the statistical analyses.
FUNDING INFORMATION
This work was supported by the National Institute of Justice [Award 2020-R2-CX-0025].
CONFLICT OF INTEREST STATEMENT
The author has no conflicts of interest to declare.


