Osteon shape variation in the femoral diaphysis: A geometric-morphometric approach on human cortical bone microstructure in an elderly sample
This research was presented in the Forensic Anthropology Society of Europe (FASE) 20th Anniversary Symposium, August 30 to September 1, 2023, in Marseille, France.
Abstract
Geometric morphometrics (GMM) have been applied to understand morphological variation in biological structures. However, research studying cortical bone through geometric histomorphometrics (GHMM) is scarce. This research aims to develop a landmark-based GHMM protocol to depict osteonal shape variation in the femoral diaphysis, exploring the role of age and biomechanics in bone microstructure. Proximal, midshaft, and distal anatomical segments from the femoral diaphysis of six individuals were assessed, with 864 secondary intact osteons from eight periosteal sampling areas being manually landmarked. Observer error was tested using Procrustes ANOVA. Average osteonal shape and anatomical segment-specific variation were explored using principal component analysis. Osteon shape differences between segments were examined using canonical variate analysis (CVA). Sex differences were assessed through Procrustes ANOVA and discriminant function analysis (DFA). The impact of osteonal size on osteonal shape was investigated. High repeatability and reproducibility in osteon shape landmarking were reported. The average osteon shape captured was an elliptical structure, with PC1 reflecting more circular osteons. Significant differences in osteon shape were observed between proximal and distal segments according to CVA. Osteon shape differed between males and females, with DFA showing 52% cross-validation accuracies. No effect of size on shape was reported. Osteonal shape variation observed in this study might be explained by the elderly nature of the sample as well as biomechanical and physiological mechanisms playing different roles along the femoral diaphysis. Although a larger sample is needed to corroborate these findings, this study contributes to the best of our knowledge on human microanatomy, proposing a novel GHMM approach.
Highlights
- Geometric histomorphometric landmark protocol demonstrates repeatability and reproducibility.
- On average, osteons show a circular shape potentially influenced by age.
- Osteon shape differs significantly between proximal and distal anatomical segments.
- Sex differences were observed in both osteonal shape and size.
- The developed protocol could be used in the future for bone fragments or species identification.
1 INTRODUCTION
Through a cyclic process known as remodeling, bone responds and adapts to mechanical stress [1-3]. Osteons comprise the structural and functional basic units of cortical bone tissue, and are the result of the coupled and coordinated activity of osteoclasts and osteoblasts (bone multicellular units) responding to physiological and biological processes [3-7]. Age accounts for one of the main factors influencing osteon number, size, and shape [8, 9]. Age-related changes include an increment in osteon number as age increases with old bone tissue being replaced by new bone tissue through cortical bone remodeling [10]. This physiological mechanism also implies the decrease in osteon size as a product of higher numbers of osteonal structures as well as the thinning of the cortex with advancing age. Research indicates that a higher number of cement lines and more circular shaped and smaller osteons appear as age increases, which might improve cortex fatigue life preventing microdamage [9, 11]. Mechanical loading further plays a crucial role in bone remodeling, with disuse or loading absence inducing rapid bone mass loss due to increased bone turnover [12]. Adaptative changes in cortical bone microstructure arrangement have been reported where osteons respond to specific loading with more circular or elliptical shapes, and studies suggest differentiational osteonal morphology depending on lower or higher strain modes [13-15].
The traditional methodology used for the assessment of osteonal structures relies on bone histology and histomorphometry, and cortical bone histomorphometry has been shown to provide valuable information about skeletal tissue biomechanics, aging, and pathology [8, 13, 16, 17]. Extensive research has delved into both qualitative and quantitative aspects of osteon analysis, focusing on parameters such as frequency, size, and shape (e.g., [18, 19]). Software tools like ImageJ have facilitated the collection of data on osteon area, perimeter, and shape [20]. Osteon shape assessment commonly employs the osteon circularity index, comparing osteonal shapes to perfect circles using raw parameters like area and perimeter [9, 15, 21]. However, the inclusion of the size component as well as the limited morphological comparison to a true circle might omit diverse variations of the actual osteon shape [22, 23]. While osteon circularity has been valuable for age estimation, human–animal differentiation, and biomechanical insights [10, 24, 25], challenges such as observer error, intra-skeletal variability, and inconclusive findings for species identification have been reported [15, 24, 26]. Moreover, other osteonal characteristics such as collagen fiber orientation have been used to support findings on biomechanical influences [27]. Similarly, while sexually dimorphic features such as greater femoral cortical thickness in males have been identified [28], literature investigating sex differences in osteonal size and circularity report inconsistent results [9, 15, 29-31]. Hence, further research and alternative methodologies are warranted to address these complexities and provide deeper insights into the subject.
Techniques such as landmark (LM)-based geometric morphometrics (GMM) methods have proven to be effective tools for macroscopic shape analysis of biological structures (e.g., [32, 33]). Biological shape and size variation is assessed through GMM using anatomical LMs to define the shape by generating cartesian coordinates for mathematical and statistical analysis, with GMM techniques being applied to two- and three-dimensional data [32, 34, 35]. Shape analysis using GMM can be independent of size and the analysis retains more information about shape than traditional morphometric assessment [36, 37]. Despite its recent popularity and its wide area of application, the use of GMM to investigate human cortical bone microstructure is extremely limited. Dillon et al. [22] first implemented a geometric histomorphometrics (GHMM) attempt to quantify osteon shape and size in two female individuals, exploring three different sections within the femoral diaphysis. The authors applied a complex Fourier analysis with designed custom Excel macros, based on a LM independent method following Ferretti et al.'s [38] protocol for assessing the shape and size of fossilized ring structures. A resampling strategy was then utilized to determine the optimal number of LMs per osteon, resulting in 50 points per microstructure, with an in-house sampling protocol developed for identifying regions of interest (ROIs) within the femoral cross section. Given the exploratory nature of their study and the limited sample size, they conducted only a preliminary analysis examining osteonal shape differences among the three femoral segments. The results were not further interpreted in relation to common factors influencing cortical histomorphometry, such as age or biomechanical properties.
Since then, no further research has been conducted on GHMM, thus, the aims of the present paper are twofold. First, to develop a manual LM-based GHMM protocol using freely available GMM software, while testing its repeatability and reproducibility through intra- and inter-observer error to ensure its feasibility of implementation. Second, to apply the designed protocol on osteons from a sample of six elderly human femora from which cross sections were extracted from three key anatomical segments within the shaft (proximal, midshaft, and distal). The sampling location strategy targets key biomechanical locations within the chosen skeletal element. The femur is a weight bearing bone subjected to compression and tension forces when active during bipedal standing and walking, with the overall stress decreasing in the distal region when compared to the proximal or midshaft areas [39, 40]. Moreover, finite analysis studies have shown that compression forces are highest in the medial midshaft and proximal diaphysis, while tension is highest laterally [41, 42]. The data generated from the developed GHMM protocol were analyzed statistically to investigate whether the depicted osteonal shape variation can be interpreted and extrapolated in relation to the existing knowledge on human cortical bone microstructure. Subsequently, the results were examined with regard to the effects of age and biomechanics, taking into account the mean age of the sample and the complex biomechanical dynamics experienced by the femur. Other potential factors influencing osteon morphology, such as sex, were considered in an attempt to elucidate whether osteonal shape data obtained from GHMM techniques could contribute to the ongoing debate on cortical bone sex differences.
2 MATERIALS AND METHODS
The sample consisted of six individuals from an elderly Scottish population obtained from the body donation program at the Centre of Anatomy and Human Identification (CAHID) at the University of Dundee (Scotland). Ethical permission for the use of this skeletal material for research is covered by the Anatomy Act (1984) and the Human Tissue (Scotland) Act 2006. This legislation allows for human material to be used for anatomical examination, education, and training as well as research purposes [43]. Additionally, approval for this project was granted by the University of Dundee Thiel Advisory group which reviewed the research and granted access to the sample, with all work being authorized and overseen by a Licensed Teacher of Anatomy [44]. Known demographic information for the individuals consisted of age, sex, and cause of death. Three males and three females were included in the study, with the mean age being 80 years (SD = 4.4) and 80.3 years (SD = 3.5), respectively. The characteristics of the sample offer new avenues for interpreting the results in relation to tissue aging in the elderly, providing insights into cortical bone aging and biomechanical response in a target population prone to microarchitecture deterioration.
The left femur of each individual was used for this research. From each bone, three anatomical segments within the femoral diaphysis were sampled: proximal, midshaft, and distal (Figure 1). The proximal segment was extracted inferior to the lesser trochanter, just before the linea aspera forms at the pectineal- and gluteal lines. The midshaft section was extracted from the midpoint between the proximal and distal sections. The distal cross section was taken at the beginning of the supracondylar lines, superior to the adductor tubercle [45]. The subsequent sample processing protocol was then implemented. The bones underwent cleaning to remove excess debris and soft tissue, utilizing periosteal elevators, tweezers, clamps, and scalpels, with careful attention to preserving the periosteal surface integrity. After cleaning, a cross section of approximately 3–5 mm thickness was carefully extracted using a Dremel 3000 rotary tool. The thickness of this initial cut ensured the integrity of the section while polishing it for histological analysis (approx. thickness 50–70 μm), with the cross section being perpendicular to the bone's axis to prevent distortion of the section plane. Thin sections were manually prepared for histological analysis following existing protocols [46]. A total of 18 thin sections were produced.
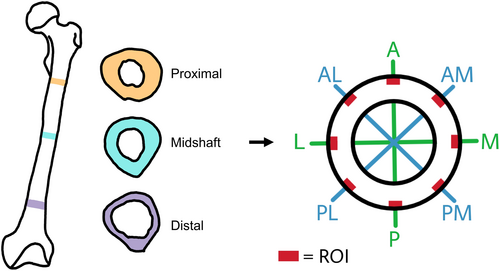
Eight sampling locations along the periosteal envelope were identified within each cross section, with the aim to cover anatomically representative areas from diverse biomechanical regions within the femur cross section [47, 48]. The ROIs considered are anterior (A), posterior (P), medial (M), lateral (L), anteromedial (AM), anterolateral (AL), posteromedial (PM), and posterolateral (PL) (Figure 1).
Photomicrographs of each ROI were taken at 100× magnification using a Leica DM2000 light microscope with a Leica DFC295 microscope camera (Leica Microsystems GmbH). Only intact secondary osteons were included in this study, considering intact osteonal structures those with complete or ≥90% complete cement lines as assessed qualitatively. This is because intact secondary osteons showing cement line resorption indicate undergoing remodeling and no longer reflect the original osteon shape. During preliminary observations, an optimum of six complete secondary osteons meeting the inclusion criteria was visible in the ROI photomicrographs, dictating the average number of osteons to be assessed on each ROI throughout this study.
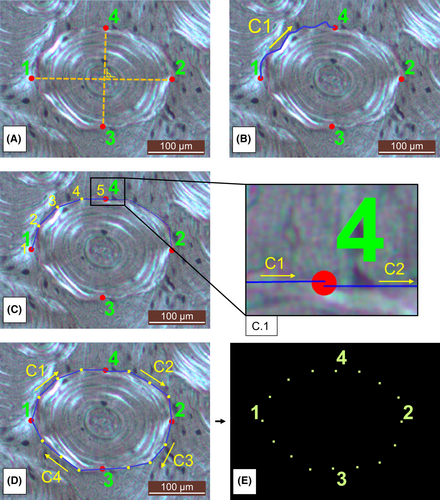
The shape of a total of 864 secondary osteons was assessed, with a total of 288 osteons being landmarked per anatomical segment. Each osteon was manually landmarked using tpsDig2 version 2.31 [49]. LMs refer to anatomically homologous points with semi-LMs (semi-LMs) being used to quantify curves and surfaces lacking biological homologies or distinct characteristic points [50, 51]. Four fixed LMs were placed on the cement line of each osteon. As osteons do not have homologous points on their outer rim, the Haversian canal present in every osteon served as a “fix point” where the major and minor axes should intersect at approximately 90°. The protocol for LM placing was adapted using major and minor axis parameters [29, 52]. Figure 2A presents the landmarking protocol with all four LMs being placed on the osteon cement line. LM1 and LM2 correspond with the major axis of the osteon, defined as the longest diameter between two extremes of the entire osteon, with the axis passing through the center of the Haversian canal. LM1 and LM2 were consistently placed from left to right. LM3 and LM4 correspond with the minor axis of the osteon, defined as the shortest diameter between the two extremes of the entire osteon, with the axis also passing through the Haversian canal. LM3 and LM4 were placed from lower to upper (Figure 2A). Based on this protocol, drifting osteons were excluded because it was not possible to define the intersection of the major and minor axes through the canal, due to the elongated and twisted shape of these osteonal structures [53]. Additionally, 12 semi-LMs were placed on each osteon to mark the curvature and scalloping of the cement line (Figure 2C,D). Curves were consistently drawn clockwise and in the same order, starting at LM 1 (Figure 2B). Each curve was resampled to five points by length, creating three semi-LMs between each of the four fixed LMs. The total number of LMs placed on each osteon for data analysis was therefore 4 fixed LMs and 12 semi-LMs, which outlined the overall shape of the osteon (Figure 2D,E).
2.1 Statistical analysis
All statistical analyses were performed in MorphoJ software version 1.07a [54]. Thin plate spline data were further processed using tpsUtil version 1.82 [55].
Intra-observer and inter-observer reliability (performed by authors LL and JGGD, respectively) were assessed by re-landmarking a random selection of 7 microphotographs (42 osteons) through Procrustes ANOVA [56].
Sample variation in shape is detected using Procrustes superimposition, which consists of the re-scaling, rotating, and aligning of the LMs [32]. To investigate the overall average femoral osteon shape, a Procrustes fit was first performed for the entire dataset (including all anatomical segments). Through rotating and re-scaling, the Procrustes fit aligns the LMs along the principal axes of the average shape configuration [32, 57]. Subsequently, the data were checked for outliers by generating an outlier curve, showing the squared Mahalanobis distance on the X-axis and the cumulative frequency on the Y-axis, with no outliers being identified through this procedure. The expected multivariate normal distribution and the actual distribution of the dataset are then presented as curves [57]. Principal component analysis (PCA) was performed to explore the main patterns of shape variation through multivariate statistics, including all segments. The influence of size on morphological shape changes, including their statistical correlation, is referred to as allometry [35, 50]. Linear regression analysis was used to test the effect of size on shape, with the proxy for size being represented by the centroid size [58]. Scatterplots of dimensional data were generated to visualize shape variation patterns with the axes of each scatterplot reflecting the direction of variation [37]. The analysis was repeated on each anatomical sampling segment (proximal, midshaft, and distal, separately). Canonical variate analysis (CVA) was conducted to compare shape differences between groups, testing for statistically significant differences between the three segments along the length of the femur. A permutation test for pairwise distances with 10,000 iterations was performed by comparing the group means [57], with the CVA scatterplots generated indicating the greatest difference between the three femoral anatomical segments [59]. Shape changes explained by PCA and CVA are visualized by wireframe graphs and vector analysis graphs on a transformation grid, with the scale factor demonstrating the magnitude of variation along the respective axis in comparison to the average shape with a zero scale factor [22, 57]. To test the differences in osteon shape between males and females, a PCA was performed to understand shape variation patterns between the sexes. A Procrustes ANOVA was performed to test whether statistically significant differences in the overall shape of osteons are suggested between the sexes. Discriminant function analysis (DFA) was carried out using a pairwise permutation test with 1000 iterations while considering both original and cross-validated correct group allocations [57, 60, 61].
3 RESULTS
3.1 Intra- and inter-observer error
Intra- and interobserver results are presented in Table 1. The Procrustes ANOVA analysis reports mean square values for Error 1 that are lower than the individual mean squared values, suggesting that there is a negligible shape difference between the first and second rounds of single-observer's assessment as well as no difference between the two different observers.
| Intra-observer error | |||||
|---|---|---|---|---|---|
| Effect | SS | MS | df | F | p (parametric) |
| Centroid size | |||||
| Individual | 1877989.83 | 45804.63 | 41 | 467.16 | <0.0001 |
| Error 1 | 4118.0758 | 98.049424 | 42 | ||
| Shape | |||||
| Individual | 1.14034 | 0.000993 | 1148 | 3.86 | <0.0001 |
| Error 1 | 0.30278 | 0.000255 | 1176 | ||
| Inter-observer error | |||||
|---|---|---|---|---|---|
| Effect | SS | MS | df | F | p (parametric) |
| Centroid size | |||||
| Individual | 1109320.63 | 27056.60 | 41 | 1.35 | 0.1711 |
| Error 1 | 844697.3466 | 20111.84 | 42 | ||
| Shape | |||||
| Individual | 0.88859 | 0.000774 | 1148 | 1.30 | <0.0001 |
| Error 1 | 0.69769 | 0.000593 | 1176 | ||
- Abbreviations: df, degrees of freedom; F, Goodall's F statistic; MS, mean squares; SS, sum of squares.
3.2 Osteon shape variation across the total sample
The average osteonal shape for the sample under study was obtained by performing a Procrustes fit for the entire dataset (including all osteons landmarked on the proximal, midshaft, and distal anatomical segments). The average osteon produced by this analysis presents an elliptical shape (Figure 3A). PCA was performed on the entire dataset to understand the main patterns of osteonal shape variation across the sample. PC1 and PC2 combined, explained over 50% of the total variance (31.27% and 23.29%, respectively). The direction of variation is shown in Figure 3B. PC1 indicates a shortening of the major axis and a lengthening of the minor axis, resulting in a more circular structure, while the variation seen in PC2 shows a shift in the position of the minor axis. The combination of PCs 1–5 explains about 80% of the variance, with PC3, PC4, and PC5 each representing <10% of the variance (9.78%, 9.15%, and 7.39%, respectively) (see supporting material for all PCA values).
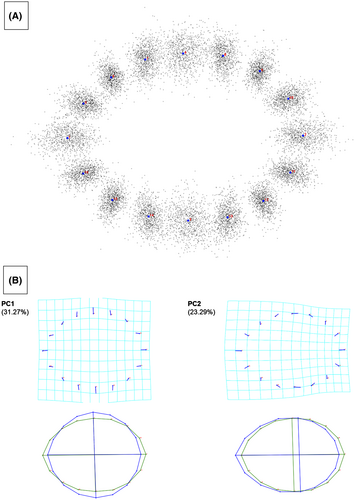
The influence of size on shape was investigated by performing a linear regression using the centroid size as a proxy of size. The results demonstrate that size is responsible for only 0.1426% of shape variation (Table 2).
| Sum of squares (SS) | |
|---|---|
| Total SS | 17.89241351 |
| Predicted SS | 0.02550632 |
| Residual SS | 17.86690719 |
| Influence of size-shape | |
|---|---|
| % predicted | 0.1426 |
| p-Value | 0.261 |
3.3 Inter-segment osteonal shape variation
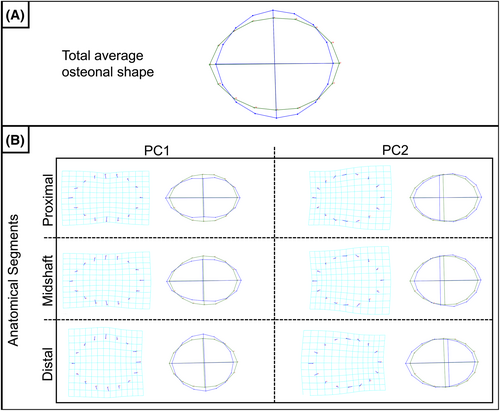
To explore osteon shape variation between the three femoral anatomical segments, a Procrustes fit and a PCA were performed for each segment (proximal, midshaft, and distal segments, separately). PCA results demonstrate that PC1 and PC2 explain over 50% of the variance, with PCs 1–5 explaining about 80% of the variance in each section (Table 3). Figure 4 shows the shape variation for each respective segment for PC1 and PC2, as represented by vector analysis and wireframe graphs. Overall, PC1 of the proximal and midshaft segments indicate an elongation of the major axis and a shortening of the minor axis, resulting in a more oval osteonal shape. PC1 of the distal segment experienced an opposite shift, resulting in a more circular target shape structure. PC2 presents a positional shift in the minor axis for all three segments. All PCA values for each segment are reported in the supporting material.
| Proximal | Midshaft | Distal | ||||
|---|---|---|---|---|---|---|
| Variance (%) | Cumulative variance (%) | Variance (%) | Cumulative variance (%) | Variance (%) | Cumulative variance (%) | |
| PC1 | 34.05 | 34.05 | 31.84 | 31.84 | 28.94 | 28.94 |
| PC2 | 20.29 | 54.34 | 24.22 | 56.05 | 25.38 | 54.33 |
| PC3 | 9.61 | 63.96 | 10.96 | 67.01 | 10.25 | 64.57 |
| PC4 | 8.16 | 72.12 | 10.06 | 77.08 | 8.41 | 72.98 |
| PC5 | 7.29 | 79.42 | 7.58 | 84.66 | 7.82 | 80.80 |
CVA was performed to test for statistically significant differences in osteon shape among the three anatomical segments. A permutation test with 10,000 iterations for Procrustes distances revealed a statistically significant difference between the proximal and distal sections (Procrustes distance = 0.0210, p-value = 0.0131). CVA results are plotted to visually demonstrate the configuration of the data in relation to the proximal, midshaft, and distal segments, with 0.90 confidence ellipses. As seen in Figure 5, overlapping of the three segments occurs mostly in the middle portion of the scatter plot, with the distal segment datapoints being located toward the lower left corner and the proximal segment datapoints being positioned toward the upper right corner.
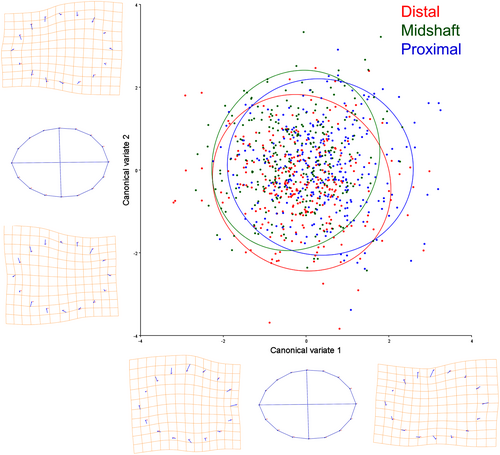
Linear regression was performed for each of the anatomical segments to investigate the effect of size on shape, with the results showing no statistically significant influence (proximal: 0.4596%, p-value = 0.229; midshaft: 0.2095%, p-value = 0.725; distal: 0.5583%, p-value = 0.139).
3.4 Sex differences in osteonal shape variation
To explore the average osteon shape variation between males and females, a Procrustes fit and a PCA were performed for each sex separately. Figure 6 shows the main pattern of osteon shape variation as explained by PC1 for males and females. PCA results present similar percentages of variance as the overall osteon shape analysis, with PC1 and PC2 explaining over 50% of the variance and PCs 1–5 presenting about 80%. PC1 target shapes for both sexes result in a shortening of the major axis and a lengthening of the minor axis to form a more circular structure, like the shape pattern reported for the entire dataset. See supporting material for PCA values for males and females.
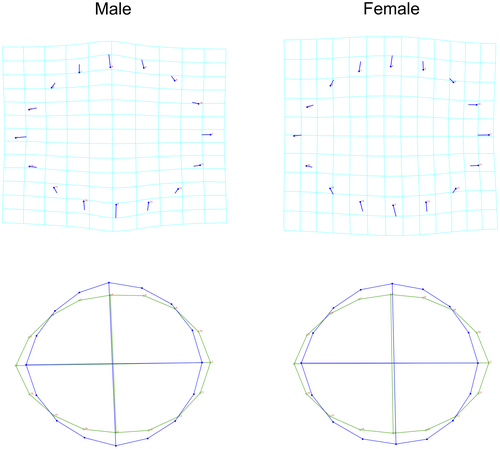
A Procrustes ANOVA was performed to investigate differences in the overall osteon shape between males and females, with the results indicating a statistically significant difference for both centroid size and shape (Table 4).
| Centroid size | |||||
|---|---|---|---|---|---|
| Effect | SS | MS | df | F | p (parametric) |
| Individual | 116113.758755 | 116113.758755 | 1 | 9.09 | 0.0026 |
| Residual | 11007853.418577 | 11007853.418577 | 862 | ||
| Shape | |||||
|---|---|---|---|---|---|
| Effect | SS | MS | df | F | p (parametric) |
| Individual | 0.03868903 | 0.0013817511 | 28 | 1.87 | 0.0036 |
| Residual | 17.85372448 | 0.0007397135 | 24,136 | ||
- Abbreviations: df, degrees of freedom; F, Goodall's F statistic; Individual, sex; MS, mean squares; SS, sum of squares.
DFA was conducted for sex group classification based on average osteon shape, utilizing a permutation test with 1000 iterations to identify the Procrustes distances (Procrustes Distance = 0.0133, p = 0.088). Overall, 58% of the sample was allocated correctly, and a 52% correct classification was obtained in cross-validation. Similar allocation rates for males and females were attained during the original and cross-validation tests (see supporting material for further details on DFA classification).
Further exploratory analysis was performed to test for sex variation within each of the anatomical segments. A Procrustes ANOVA demonstrated a statistically significant difference between males and females for only the centroid size of the distal segment (F = 7.51, p-value = 0.0065). The overall cross-validated DFA results demonstrated a correct classification of 52.1%, 53.9%, and 56.3% for the proximal, midshaft, and distal segments, respectively.
4 DISCUSSION
The present research aimed to validate the potential of GHMM in identifying geometric as well as morphometric properties of osteonal structures along the femoral length in a sample of elderly individuals. The findings will be discussed with the current literature on the reliability of GMM techniques, bone microstructure in relation to aging and biomechanical influences, as well as including the potential impact of sexual dimorphism.
4.1 Landmarking digitalization error
The manual landmarking protocol developed for assessing osteonal shape in this study demonstrates high repeatability and reproducibility, based on the MS values reported by Procrustes ANOVA [62]. This is in agreement with other authors who report a minimal error in the repeated digitalization of osteon shape [22].
The development of the LM-based GHMM protocol to capture the shape of secondary osteons presented some challenges. Osteons lack anatomically homologous points, therefore, LMs cannot be placed using established GMM methods that are based on the presence of homologies [22, 51]. The Haversian canal consequently served as the homologous point along which the intersection of the major and minor axes was orientated. This made it possible to standardize the placement of 4 LMs on the cement lines of the osteons, and consistently define the osteon shape via curves and semi-LMs. Although the value of semi-LMs is still being discussed in current literature because their extensive use might influence the distribution of variance across the LMs during the Procrustes superimposition, their application has been proven to result in a more accurate description of the object's shape [63]. Based on the observer error results, the osteonal shape constructed in this study can be replicated, suggesting a reliable protocol.
4.2 Average osteon shape variation
The average osteon shape for the entire dataset suggests a circular osteon morphology, as reported by PC1, and a slight shift in the minor axis position as represented by PC2 (Figure 3). These two GHMM patterns explained 58.8% of osteonal shape variation, with each of the remaining PCs reflecting <10% of the variation.
In terms of the circularity of the reported osteonal shape, the circularity index categorizes osteons according to their resemblance to a perfect circle, and it is believed to be associated with both aging and loading histories [9, 15]. The evaluation of osteon circularity in the midshaft femur aligns with the reported tendency for older individuals to exhibit more circular osteons [29]. The relationship between age and osteon circularity relates to the increase in remodeling rates, resulting in the production of smaller osteons that can fit within a progressively thinning cortex. Circular osteons are more resistant to compression and tension forces, and help reduce the increased risk of microdamage propagation due to advancing age [9, 64, 65]. Due to the elderly nature of the sample examined in the present study, the increased observation of a circular osteonal shape was expected.
The second largest average shape pattern was driven by a shift in the position of the minor axis. The position of the Haversian canal seems to shift away from the center, suggesting a slight drift on one side of the osteon. Based on the osteon inclusion criteria, long-tailed drifting osteons were excluded due to the inability to place LM1-2 to LM3-4 perpendicularly across the Haversian canal. Drifting osteons were reported to be inversely correlated to age in some studies, with thicker and less crowded cortical areas in younger individuals allowing the osteon to drift throughout the cortex to potentially produce more elliptical osteonal structures [66-68]. However, other authors have observed this osteon type across all age ranges [53, 69]. Although osteons become less elliptical with age, an overall elliptical osteonal shape in cross section has been reported, with longitudinal orientation not accounting for the deviation from the circular shape [70]. Van Oers et al. [13] suggested that strain gradients can cause the drifting osteon to move toward the endosteum, near the marrow cavity where the strain's magnitude decreases. Studies on elk calcaneus also reported the widest osteons to be found on the endosteal cortical areas that are under tension, rather than in the compressed periosteal regions [25, 71]. The present study cannot confirm this based on the periosteal sampling area chosen, but further research could investigate both periosteal and endosteal envelopes. This could corroborate whether the slight osteonal drift is responding to cross-sectional strain-controlled mechanisms. A larger and more representative sample should be investigated as the accumulation of physiological and biomechanical alterations with age might also have an impact on the results obtained [72]. Moreover, the shift observed in the Haversian canal could be further explored by focusing only on the canal shape variation as well as landmarking osteons through consecutive thin sections providing a more holistic overview of osteon shape changes along the length of the bone axis.
4.3 Osteon shape variation by anatomical segment
To explore GHMM osteonal properties throughout the femur and its potential relationship with biomechanics, three anatomical segments were explored. The results demonstrate that significant shape variations could be observed between the proximal and distal segments, with around 34% of the proximal segment variation being represented by a more elongated elliptical osteonal structure and 29% of the distal variation being driven by a more circular shape. Both anatomical locations presented a relatively centered Haversian canal, as indicated by their PC1 (Figure 4).
To date, only one paper has attempted GHMM using a LM-independent method [22]. Statistically significant differences were reported between three femoral sections, based on 544 complete secondary osteons landmarked from two female individuals. The implications of the findings were not discussed by the authors due to limitations in sample size and representative groups for comparison (e.g., males and females). Direct comparison between their study and the one presented here might not be possible, because the LM protocols vary and the different cross-sectional sampling strategies could potentially impact osteon characteristics [40, 73, 74]. Due to an inability to run a direct comparison with previous studies based on the novelty of the GHMM approach, our results will be discussed in relation to findings reported through two parameters: osteon circularity and osteon morphotypes [26, 27].
Osteon circularity, as assessed by previous authors, explained a higher amount of variability for age in the rib than in the femur [9]. Perhaps, the more complex biomechanical influences of the lower limb are reflected in this outcome. Human and non-human long bones present different osteon circularity indexes as well as intraskeletal variation, which could indicate different strain-mode distributions related to diverse loading histories [15]. Osteon circularity is presumed to be greater on specific skeletal elements in non-human species, due to the higher strain applied being associated with more circular osteonal structures [15]. However, some studies have reported contradictory results [21, 26].
Keenan et al. [21] investigated osteon circularity and osteon elliptical shape on different species. The authors suggested that the parameter's discriminatory power could be useful for human versus non-human identification although interspecies and intraspecies differences are being reported. Regarding habitual load complexity, the most circular osteons were observed in the moderate complexity category, while more elliptical osteons were observed in the low complexity category. This indicates that potential changes in loading applied to the bone might be reflected in osteon characteristics. Elliptical osteonal shapes are expected within 50% of the femoral diaphysis because it adapts to torsion and shear with a reduction of regional variations [21]. This reduction in regional variation, where the load complexity increases along with higher inter-specimen variability in strain distribution, could explain the “intermediate” osteonal shape reported by PC1 for the mid-diaphysis in the present study. No significant difference was observed between the mid-diaphyseal segment and the other two anatomical segments, producing an osteonal shape reflecting a transition from the proximal segment (more elongated) to the distal segment (more circular) (Figure 4). Data on animal calcanei showed that the cranial compression cortex demonstrated smaller and more circular osteons when compared to the caudal tension cortex [25, 75]. Further investigation is warranted to determine if the compression-tension stresses experienced in the proximal midshaft lead to elongated osteonal structures. Additionally, exploring whether the morphology, size, and distribution of forces exerted on the knee joint due to increased anterior–posterior bending affect the circular properties of osteons in the distal segment would be valuable [27, 76, 77]. This exploration should ideally involve a larger sample size to enhance the robustness of the findings.
Studies on osteon morphotypes report collagen fiber orientation (CFO) data that supports the different loading femoral complexities (e.g., [78]). Overall, the strain distribution in the human femur changes from the subtrochanteric region and proximal diaphysis to the mid-diaphysis [27, 40]. The proximal metaphyseal-diaphyseal region exists under habitual tension-compression forces in a lateral-medial orientation, which is supported by observations on CFO studies representing higher bending than torsion on the subtrochanteric region when compared to the mid-diaphysis [27, 78, 79]. The mid-diaphysis presents a complex loading environment with different degrees of torsion and bending (the linea aspera acting as a tensile force) for which neither the CFO nor osteonal characteristics are so clearly defined, producing highly variable histological patterns [27, 80]. Perhaps the mid-diaphysis intermediate osteonal shape pattern seen in our sample reflects this lack of regional variation in the femoral mid-diaphysis because it presents a transition between proximal and distal osteonal shapes. Regarding the distal segment, bone cross-sectional studies demonstrated that the highest antero-posterior bending peak occurs in the distal half of the diaphysis, with strain distribution changing from the proximal to the distal third domain [77, 81]. This distinction in circular osteonal shape in the distal segment might be supported by results reported by Endo et al. [40]. Experimentally imposed maximum principal stress was not in alignment with other morphological parameters tested on the distal segment, while they did correlate at other levels on the femur. These findings may suggest a different pattern of force distribution in the distal end of the femoral shaft. Thus, regional differences in elastic anisotropy, which are significant toward the epiphyseal regions [82], might be the result of osteon shape given the statistically significant differences between the proximal and distal anatomical segments identified in this study. Research on rat ulnae has demonstrated that threshold strains were higher distally where locomotor strains are also higher, with osteogenic response being more significant on the periosteal surface than on the endosteal surface [83]. Further research exploring the relationship between osteonal shape and osteonal CFO should be conducted to confirm whether the shape variation reported here relates to the loading history data provided by osteon morphotypes [27].
4.4 Other considerations
Regarding sex, shape variations were detected for both shape and centroid size. The pattern of shape variation in each sex is consistent with the main variation seen across the entire sample, with both sexes presenting an overall circular shape (Figure 6). Some authors have found no statistically significant sex differences in osteon circularity for femoral mid-diaphysis [9, 29], but differences have been reported for parameters related to size and CFO [29, 84]. Our results suggest that osteon shape did not show discriminatory power for sex, as DFA indicated a correct allocation of around 50% for a two-group classification.
In general, cortical long bone histomorphometric differences between males and females in the femur are an open debate. Sex-related changes in remodeling rates, including specific bone turnover rates associated with hormonal changes seen with advanced age, might be reflected through the traditional histological parameters commonly used [85-87]. Our sample size does not allow for a conclusive view of sex differences in osteon shape. A larger sample with a wider age bracket could provide more information on whether the hormonal changes experienced throughout life may have had an effect on osteon shape that can be revealed through our GHMM protocol. Further research could elucidate if the overall osteonal shape variations observed result from actual sex differences, which could reflect osteonal adaptation to different locomotion or hormonal age-related changes [88-91].
Although exploring size was not the main purpose of this study, the centroid size was used as a proxy for size in the analysis. It was concluded that size has no effect on shape. No overall association between size and shape thus indicates that allometry has minimal impact on the total shape variation, which has been similarly reported in other GMM macroscopic studies [58]. The correlation between osteon circularity and osteon area was also found to be non-significant or low, indicating that independent factors might be controlling size and shape [21, 26].
5 CONCLUSION
This study is just the second attempt in existing literature at exploring the feasibility of using GHMM to further understand osteonal GMM properties along the length of the femur. A larger sample with a higher representation of individuals from different age ranges is needed to corroborate our preliminary results, and other influences such as disease, genetics, or nutrition could be further considered as they might have an impact on cortical bone microscopic arrangement [26, 84]. Our findings suggest a circular-elliptical osteonal shape for the elderly sample, with differences between specific femoral anatomical segments supporting mechanical loading changes along the femur. Sex variation was confirmed for the average osteonal shape, while no shape differences were found for each segment. Lastly, size did not influence osteon shape, indicating a similar pattern as reported by traditional histomorphometry.
Future work should explore the inclusion of ROIs from the mesosteal and endosteal surfaces to allow for a more complete understanding of osteon shape variation, as differences in remodeling rates and strains have been suggested within the cross section [13, 74]. Moreover, a larger sample size will allow for further analysis of ROIs in relation to shape variation, to explore different loading applied through the longitudinal and transverse femoral axes [77]. Further research should consider femur size/shape and the potential influence on osteon size and shape as well as potential Haversian canal shape variation. Additionally, our findings have the potential to promote the utilization of osteonal shape as a tool for elucidating loading histories and shedding light on biomechanical adaptations in bone microstructure. This could prove beneficial across disciplines such as paleoanthropology, offering deeper insights into species with varying locomotory patterns.
This research can also provide further insights into the potential use of GHMM to assist in the identification of different anatomical segments of the femur in case highly fragmentary remains are encountered. If the preliminary patterns observed here are confirmed by future studies, GHMM osteonal properties could be used to classify small bone fragments into proximal and distal femoral segments. Especially when macroscopic assessment is deemed inviable, the information provided by osteonal GHMM shape could assist the forensic anthropologist in the sorting of commingled remains as well as in the choice of the age estimation method as the anatomical location would be potentially known.
ACKNOWLEDGMENTS
We would like to acknowledge Dr Sangchay for collecting the original sample used for this research, and the CAHID Histology group team for processing the thin sections. We would also like to thank the Carnegie-Wits Alumni Diaspora Program for allowing the researchers to connect and collaborate.
CONFLICT OF INTEREST STATEMENT
The authors declare no conflict of interest.


