The Potential for Yield Improvements in Developing Countries to Reduce Their Exposure to Extreme Weather Shocks in Exporting Countries
ABSTRACT
This article explores the impact of extreme weather on food availability and how yield gap reductions in developing countries could make them less vulnerable to the imported effects of extreme weather shocks. Our extreme weather scenario results show that simultaneous weather-related shocks to crop yields in main exporting countries could lead to substantial increases in world food prices, threatening food security in countries strongly reliant on food imports. Maize and wheat prices increase by 40% and 50% due to extreme weather, increasing food expenditure in import-dependent countries (by up to 5%). Countering this effect, closing yield gaps in developing countries would substantially lower international prices and food expenditures, especially in developing countries. If the yield gap is reduced by 20% relative to economic potential over a 6-year period (yield gap scenario), maize and world prices decrease by 20% and 15%, decreasing food expenditure per capita in import-dependent countries. Finally, a combined scenario shows that the yield improvements only partially offset the impact of imported shocks on import-dependent countries, and these effects vary by country, depending on their production capability and their net-trade position. World maize and wheat prices increase by only 9% and 26% and still raise food expenditure in import-dependent countries.
1 Introduction
According to the UN WFP (2024), the frequency of extreme weather events has more than doubled in the last decade, transforming them into a key driver for hunger vulnerability in countries that rely heavily on their own agricultural production for food security. Indeed, extreme weather events were the primary driver of food crises in 18 countries, affecting 77 million people in 2023 (GRFC 2024). The year 2023 was the second hottest year on record, with widespread extreme weather events, including flooding, storms, droughts, and wildfires (World Meteorological Organization 2024; GRFC 2024). The year 2024 was the warmest year on record and, on average, over 1.5°C above the pre-industrial global average (C3S 2025).
These extreme events pose significant threats to agricultural production and global food security. The primary effect of extreme weather on food security is due to crop failures and decreased crop yields (Nóia-Júnior et al. 2025). The higher frequency of extreme weather events also affects crop growth, particularly during critical phenological crop stages like anthesis and grain filling, leading to substantial yield losses (Yin and Leng 2022). Water availability is also sensitive to adverse weather, and supply chains that deliver food to markets can also be negatively affected, impacting food availability and access (Scharadin et al. 2023). Lesk et al. (2016) examine the impact of extreme weather events on cereal production across multiple countries from 1964 to 2007, finding that droughts and extreme heat significantly reduced average country-level cereal production by 9%–10% and contributed to a 6.2% decrease in total global cereal production between 2000 and 2007.
Recent history has shown that the distributional effects of these extreme weather events exacerbate existing inequalities as they affect vulnerable populations disproportionately and lead to hunger in some parts of the world (UN WFP 2024). Small farmers are more vulnerable as they experience significant yield losses. Ensuring appropriate safety nets for farmers and vulnerable populations is essential to mitigate the impacts of these events. Rosenzweig et al. (2001) analyse the distributional impacts of extreme weather on food production across major agricultural areas, including North America, Europe, Asia, Africa and Latin America. They show that risk-prone regions, such as coastal areas or regions with poor infrastructure, may experience more severe disruptions. Thus, extreme weather widens the gap between high-yield and low-yield regions.
Climate change and, more specifically, extreme weather events pose wider threats to food security via the impacts of reduced productivity on food prices (Gupta et al. 2021; Ortiz-Bobea et al. 2021), including impacts on livestock products. Soybean, which is largely used for livestock feed, is one of the crops most impacted by extreme weather, according to the World Economic Forum (2024). Global agricultural markets are increasingly vulnerable to extreme weather events, especially when these events occur simultaneously in major producing and exporting regions. When simultaneous shocks occur, the cumulative effect on crop yields and disruption to supply chains drive up international food prices.
Import-dependent countries1 are most vulnerable to these disruptions, with a larger portion of the population relying on agriculture for their livelihood and higher food prices affecting a larger share of the population (Gupta et al. 2021). Given the disproportionate number of low- or middle-income countries dependent on imports from international markets, there is concern that increasing price volatility would result in more food insecurity.
Yield gaps represent the difference between the potential yield of crops under optimal conditions and the actual yield achieved by farmers. Closing these gaps can increase food production without increasing farmland extension (Mueller and Binder 2015). For example, closing rice yield gaps in Asia has the potential to feed 400 million additional people annually (Hu et al. 2023), highlighting the potential of higher crop yields in addressing global hunger. In Southeast Asia, improving yields may reduce the need for rice imports and/or improve export opportunities, which could have a significant impact on both local and global food availability (Yuan et al. 2022).
However, climate extremes may widen yield gaps, either directly (by lowering crop yields during sensitive growth stages like flowering and grain filling) or indirectly (through soil erosion or pest outbreaks), as well as exacerbate year-on-year variability. Closing yield gaps is one potential method to enhance the resilience of food systems when facing adverse events.
The objective of this paper is to explore the impact of extreme weather on food availability and prices and how yield gap reduction in developing countries could make global agricultural markets more resilient and reduce food insecurity. We analyse how crop yields react to weather shocks and the consequent impacts on food supply, food commodity prices, and food access and affordability, especially in import-dependent developing countries. For this, we make use of a global agri-food commodity market model and construct three counterfactual scenarios.
First, we simulate ex-ante (year 2032) how extreme weather events could affect wheat, maize, and soybean production in the main exporting regions (Argentina, Australia, Brazil, Canada, European Union, Kazakhstan, Russian Federation, Ukraine, and United States of America). Then, we analyse the effects of yield gap reductions in developing countries (more prone to being import-dependent) on the global agricultural markets. Finally, we consider the extent to which the effects of extreme weather shocks can be softened via improvements in yields by modelling the two previous scenarios together. With this combined scenario, we aim at assessing the vulnerability of import-dependent nations to external extreme weather shocks and the potential of targeted yield-gap reducing interventions to boost resilience to such shocks.
2 Methodology
For our analysis, we use the Aglink-Cosimo model (OECD/FAO 2022b; Pieralli et al. 2022). Aglink-Cosimo is a partial equilibrium recursive dynamic model jointly developed by the Organisation for Economic Co-operation and Development (OECD) and the Food and Agriculture Organization (FAO). It is designed to simulate the medium-term developments in annual supply, demand, and prices for the main agricultural commodities produced, consumed, and traded worldwide. The model covers around 100 commodities across various countries and regions, enabling a comprehensive analysis of global agricultural markets.
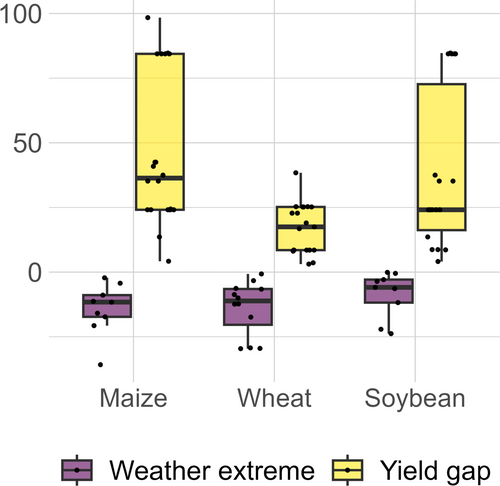
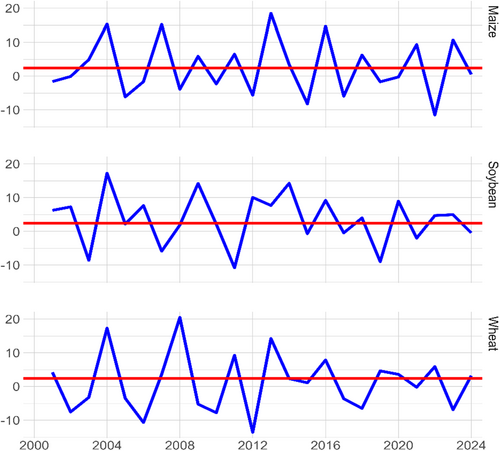
We employ the 2024 version of the Aglink-Cosimo model to simulate three scenarios (see Table 1). First, in the extreme weather scenario, severe climatic conditions in major exporting regions lead to substantial reductions in wheat, maize, and soybean production, triggering market volatility and potential disruptions to global food availability and prices. The shocks are averages of the worst 3-year Combined Stress Indexes (CSI) between 1990 and 2018 (Zampieri et al. 2017; Chatzopoulos et al. 2021). These correspond to weather extremes (in terms of water anomaly and temperature) and are used to obtain exogenous shocks to yields. As explained in Pieralli and Pérez-Domínguez (2025), the CSI indicator is a parsimonious indicator composed as a weighted average of two other nonparametric indices (the Heatwave-Magnitude-Day Index and the Standard Precipitation-Evapotranspiration Index). The extreme weather yield shocks are corroborated by considering the observed past variability in crop yields in the countries considered for the shocks (see Figure A2). Second, the yield gap scenario enhances resilience in low-income (World Bank 2023), import-dependent countries by narrowing the relative yield gap between the last OECD-FAO projected yields and the Global Yield Gap Atlas (2024a, 2024b) estimated yield potentials in developing countries by 20%. This target aligns with the need to boost global agricultural productivity by 28% to achieve Zero Hunger by 2030 while reducing direct GHG emissions by 6% (OECD/FAO 2022a). By choosing a 20% gap reduction, we strike a balance between ambition and feasibility. This percentage target improvement corresponds to a realistic potential for closing fertiliser application gaps and incentivising the use of improved seed and crop protection products (OECD/FAO 2024).
| Scenario | Description | Assumptions |
|---|---|---|
| Extreme weather scenario |
Simultaneous occurrence of extreme weather events in the major exporters of maize, soybeans, and wheat, causing a reduction of their yield production capacity in the year 2032 The scenario introduces negative yield shocks derived from a Combined Stress Index (CSI) developed by Zampieri et al. (2017) for Australia, Brazil, Canada, Kazakhstan, Russia, Ukraine, the United States, Argentina, and the European Union |
|
| Yield gap scenario |
This scenario assumes that a group of developing countries and regions[1] will close 20% of their estimated current yield gap. This is measured as the difference between their average 2019–2023 yields (for wheat, maize, and soybeans and based on the 2024 OECD-FAO outlook) and the maximum rain-fed yield potential estimated by the Global Yield Gap Atlas (GYGA) by 2031 We simulate a linear yield increase from 2025 through 2031, with yields improving by 20% of the gap over the entire period and remaining stable thereafter |
|
| Combined scenario | The combined scenario integrates the two scenarios above, examining the interaction between extreme weather-induced shocks from global exporters and yield improvements in developing countries. This combined approach highlights how strengthening local productivity can mitigate the adverse effects of external supply shocks, ultimately contributing to a more stable and resilient global food system |
|
- Note: Yield gap countries/region: The country/region codes and names for the relevant areas are as follows: ‘AFL’—Africa Southern Least Developed, ‘AFN’—Other North Africa, ‘AFS’—Other Sub-Saharan Africa, ‘ANL’—Least Developed North Africa, ‘ETH’—Ethiopia, ‘IDN’—Indonesia, ‘IND’—India, ‘IRN’—Iran, ‘MEX’—Mexico, ‘NEO’—Other Near East, ‘PRY’—Paraguay, ‘SAC’—Other South America, ‘EGY’—Egypt, ‘ASA’—Other Asia developing, ‘ASL’—LDC-Southern Asia, ‘VNM’—Vietnam, ‘THA’—Thailand, ‘NGA’—Nigeria, ‘PAK’—Pakistan, ‘PHL’—Philippines, ‘PER’—Peru, ‘ASC’—Central Asia.
Finally, the combined scenario integrates both previous scenarios, illustrating how targeted yield improvements in developing countries can mitigate the adverse effects they face as a consequence of extreme weather events in major exporting countries.
Figure 1 shows the yield shocks' distributions across commodities in the different scenarios. The boxplots that illustrate the distributions of percentage points decrease (left-hand boxplots for the weather extreme scenario) and increase (right-hand boxplots for the yield gap scenario). The boxplot representations follow standard features (Wickham 2016).
By modifying the projected yields from the 2024 OECD-FAO Agricultural Outlook, we simulate the impacts of climate-induced extremes and yield enhancements on global supply, demand, and prices of key commodities.
When estimating the biophysical and agronomic yield potential of crops, a wide range of modelling approaches is available (Müller 2024; FAO-GAEZ 2020; Aramburu-Merlos et al. 2024). However, not all these methodologies and tools provide publicly accessible, globally comprehensive data. Two widely recognised and openly accessible resources are the FAO-Global Agro-Ecological Zones (FAO-GAEZ) database and the Global Yield Gap Atlas (GYGA). Both offer valuable insights into yield potential but differ in their underlying assumptions, data used, and spatial frameworks.
On the one hand, the GAEZ methodology uses a top-down approach built on global crop models, broad assumptions, and gridded synthetic inputs and is available worldwide with high-resolution estimates. This data, however, has limited local validation and is available in a spatial format, which is not suitable for integration in the Aglink-Cosimo model. The GYGA data, on the other hand, leverages site-specific data, measured weather and soil variables, and locally calibrated crop models to deliver estimates of yield potential (Aramburu-Merlos et al. 2024; Rattalino Edreira et al. 2021; Global Yield Gap Atlas 2024a, 2024b). Furthermore, GYGA's open-access format and alignment with national or sub-national production zones make it well-suited for integration into large-scale economic simulation models, such as Aglink-Cosimo.
In this article, we draw on GYGA's rainfed yield potentials of wheat, maize, and soybean to develop the shocks used in the yield gap scenario. We define the potential yield gaps as the difference between the five-year average yield (2019–2023) from the OECD-FAO 2024 baseline database (2024) and the maximum potential rainfed yield (GYGA).
The GYGA protocol uses a ‘bottom up’ approach by applying crop models to estimate the difference between theoretical yield levels based on local biophysical limitations and actual yields. The protocol then estimates yield gaps at larger spatial scales by upscaling location-specific yield potential estimates, using a climate zonation scheme supplemented by local weather, soil, and cropping system data. By doing so it provides a global set of yield gap data that accounts for location-specific underlying factors (Van Bussel et al. 2015; Van Ittersum et al. 2013). We simulate a scenario in which developing (among which are import-dependent) countries gradually close 20% of the yield gap between 2025 and 2031 and maintain increased yields throughout the projection period. We express these gaps for each crop and region in percentage terms and apply such percentages to the projection values in the OECD-FAO baseline data. Similarly to the extreme weather scenario, we apply the yield improvement shocks to the model residuals to incorporate the biophysical potential identified by GYGA. We use GYGA data to demonstrate how partial yield gap closures in import-dependent countries can hypothetically bolster productivity and support the long-term stability of the global food system (Mueller et al. 2012; OECD/FAO 2022a; FAO-GAEZ 2020).
To consider baseline inequality in world agricultural markets, we make use of the Lorenz curve and Gini coefficient concepts. Sadras and Bongiovanni (2004) used Lorenz curves and Gini coefficients to measure yield inequality in maize crops in Argentina. More recently, Monteleone et al. (2023) have used Lorenz curves to analyse crop vulnerability due to the effects of extreme weather events on regional yields. In their contribution, the gap between high-yield and low-yield areas is widened, indicating greater inequality.
3 Medium-Term Baseline
We analyse the results of our scenarios in terms of producer prices, quantities (availability), import dependence, food energy supply, and food expenditures. To begin our analysis, we show baseline inequality for total agricultural production through the lens of the Gini coefficient and Lorenz curves across the world. We evaluate the world distribution of different quantities related to food security such as produced quantity, domestic supply (production plus imports minus exports), food energy supply (in calorie terms), and total food expenditure (in equivalent real USD).
The Lorenz curves are lines that connect cumulative proportional quantities (along the vertical axis) to cumulative proportions of the world population (along the horizontal axis). The aggregation of the countries in Aglink-Cosimo does not provide a representation of all the countries in the world, and for this reason, the Lorenz curves may appear non-smooth. In principle, a Lorenz curve that shows equality across the world distribution, from poorer to richer countries, would be a straight line equal to the equality line included as a grey dashed line.
In the Lorenz curves presented, countries' populations are ordered by the GDP per capita in real USD terms so that the poorest countries are always on the left-hand side of the horizontal axis distribution while richer countries are positioned towards the right of the distribution. Given that the ordering of the variables along the horizontal axis does not change, we are able to stack along the vertical axis different variables or scenarios.
Total production is the aggregate of all commodities considered in the model. We consider total agricultural production to exemplify the differences in the world distributions through Lorenz curves (Figure 2) and related Gini coefficients.
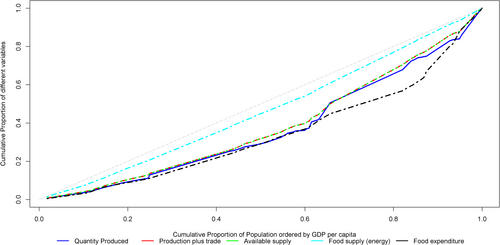
The Gini coefficient for total agricultural production is 0.265, highlighting some degree of concentration in world production across countries. Approximately 29% of the global agricultural output is produced in countries accounting for the poorest half of the world's population. The next 35% of the world population supplies an additional 45% of the global agricultural output, so that 85% of the world's population, ordered according to average income, produces approximately 74% of the world's agricultural output. This second group of countries mentioned includes big producers such as Argentina, Mexico, Brazil, China, Kazakhstan, Russia, and Türkiye. The last 26% of global production is produced by the richest 15% of the world population. Within this last group, the EU and the USA contribute 8% and 12%, respectively, of the total production. The supply of global agricultural output (production plus net trade) is slightly more equally distributed across countries than production (Gini coefficient of 0.24).
There is less inequality across countries in food consumption than in production and supply. The Gini coefficient is much lower at 0.07 in terms of calorie consumption but much higher at 0.32 if the total food expenditure is considered. This more unequal distribution shows the poorest 50% of the population eat 44% of the global food calories but spend proportionally less (only 29% of world food expenditure). The next 35% of the world population (from the 50th to the 85th percentile of the wealth distribution) secure approximately 40% of food and spend a similar amount in percentage terms (33% of world expenditure). The richest people (the highest 15%) secure approximately 16% of global food calories but pay for 38% of world's food expenditure. This higher inequality in food expenditure than in terms of available food quantities produced or food availability is mainly due to the higher bill for food paid by richer countries. This higher bill may reflect dietary composition (e.g., more livestock products) and higher domestic prices (e.g., due to higher quality).
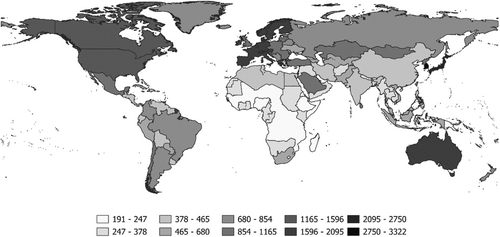
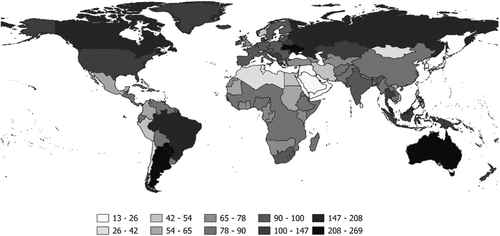
In Figure 3 we present baseline food expenditures in the world highlighting the disparities in levels. Food expenditures in import-dependent countries (for reference see Figure A1), especially in North Africa and the Middle East, are relatively low in the baseline. However, they are not the lowest, such as in Sub-Saharan Africa and parts of Southeast Asia. The highest expenditures are in high-income countries like the United States of America, Canada, Australia, and Japan.
4 Scenario Results
The simulated extreme weather shocks with their negative impacts on crop yields result in lower production of the crops considered. Lower production and adjustments in food and feed demand, in turn, lead to higher prices of all commodities. Global production of wheat, maize, and soybeans declines by around 7%, 6%, and 4%, respectively, resulting in corresponding price increases of 51%, 41%, and 27%, in the shock year (Table 2).
| Weather extreme | Yield gap | Combined | |||||||
|---|---|---|---|---|---|---|---|---|---|
| Price | Production | Trade | Price | Production | Trade | Price | Production | Trade | |
| Meat | |||||||||
| Sheep | 7.9 | 0.0 | 0.5 | −8.2 | 0.7 | −0.3 | −1.0 | 0.8 | 0.1 |
| Beef and veal | 8.0 | −0.4 | 0.2 | −9.2 | 1.6 | 0.4 | −2.3 | 1.2 | 0.6 |
| Pork | 15.0 | −0.1 | −2.8 | −11.4 | −0.1 | 0.6 | 1.7 | −0.2 | −1.7 |
| Poultry | 19.0 | −2.6 | −6.7 | −11.4 | 1.7 | 2.4 | 4.4 | −0.6 | −4.4 |
| Dairy | |||||||||
| Cheese | 9.6 | −0.2 | −0.3 | −3.7 | −0.1 | −0.7 | 4.9 | −0.3 | −0.9 |
| Skim milk powder | 5.2 | 1.4 | −0.6 | 0.5 | −1.3 | −0.3 | 5.0 | −0.3 | −0.8 |
| Whole milk powder | 7.0 | −0.2 | −0.7 | −1.8 | −0.5 | 0.1 | 4.6 | −0.6 | −0.4 |
| Butter | 13.0 | −1.4 | −0.7 | −6.6 | 3.3 | −1.1 | 5.5 | 1.9 | −1.8 |
| Grains | |||||||||
| Wheat | 51.2 | −7.0 | −15.3 | −15.7 | 1.2 | −1.7 | 26.4 | −5.7 | −17.1 |
| Maize | 40.8 | −6.0 | −13.8 | −18.6 | 2.5 | −6.3 | 9.2 | −3.2 | −18.8 |
| Other coarse grains | 19.5 | 0.2 | −2.4 | −14.8 | 0.4 | 1.0 | 0.9 | 0.6 | −1.8 |
| Rice | 3.6 | 0.1 | 0.8 | −6.8 | −0.3 | 0.8 | −3.6 | −0.2 | 1.5 |
| Oilseeds and pulses | |||||||||
| Soybean | 27.3 | −3.6 | −3.8 | −11.8 | 1.4 | −0.2 | 11.2 | −2.2 | −3.8 |
| Pulses | 14.4 | 0.4 | −2.9 | −13.7 | 0.6 | −0.8 | −1.8 | 1.0 | −3.2 |
| Other oilseeds | 10.7 | 0.1 | 0.3 | −8.7 | 0.4 | 0.4 | 0.2 | 0.5 | 0.7 |
| Other processed products | |||||||||
| Total protein meal | 30.2 | −1.1 | −1.1 | −16.1 | 1.1 | 1.3 | 8.3 | 0.0 | 0.6 |
| Vegetable oils | 4.2 | −0.3 | 0.3 | −4.4 | 0.5 | −0.2 | −0.4 | 0.2 | 0.1 |
| White sugar | 1.3 | NA | 0.6 | −3.5 | NA | −0.4 | −2.3 | NA | 0.1 |
| Biofuels | |||||||||
| Biodiesel | −0.7 | −0.1 | −0.3 | 5.7 | 1.1 | −0.1 | 5.1 | 1.0 | −0.5 |
| Ethanol | −3.7 | 0.2 | 0.5 | −6.8 | 0.2 | 0.4 | −9.8 | 0.3 | 0.9 |
Crops that are close substitutes to the shocked ones on the feed demand side, such as other coarse grains, also experience sharp price increases due to a very inelastic short-term supply response. Conversely, crops such as rice that are not as close substitutes experience more modest price changes. The strong impacts on the feed markets cause the price of animal-based products to increase as well. Global meat prices increase by 8%–19% due to higher feed costs and dairy prices by 5%–13%. The changes in prices and production quantities respond to different substitutions and complementarities and their price elasticities of supply. The dynamic supply shifts in agricultural markets built into the model imply that prices will remain elevated for several years after the weather shock (Figure 4).2 The global crop production shortfalls associated with the extreme weather scenario also lead to sharp reductions in world trade of agri-food products. Grains witness the largest reductions in import and export, followed by poultry (Table 2).
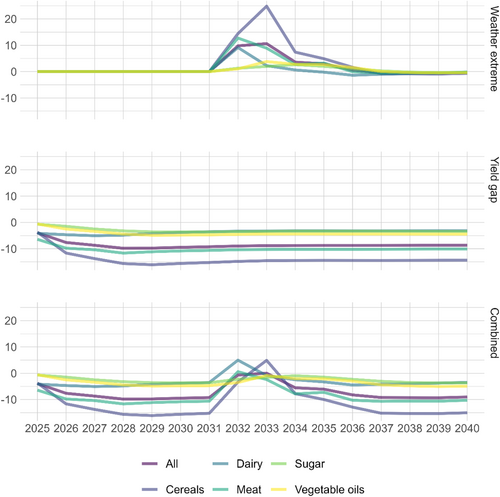
Lower crop production in the main exporting countries leads to lower imports in low- and lower-middle-income countries, which tends to improve their self-sufficiency (Figure 5). However, this is associated with higher prices, so the impact on food security is likely to be negative. In upper-middle-income countries, the self-sufficiency and food availability impacts are marginal, but prices are higher. Most of the people who cannot afford a healthy diet live in the lower- and upper-middle-income countries (FAO et al. 2024). The extreme weather scenario could therefore have a potentially serious impact on global food and nutrition security.

In the yield gap scenario, higher crop yields in developing (among which import-dependent) countries result in essentially opposite effects to the extreme weather scenario, namely higher global production and lower prices. However, the impacts are generally more modest when compared to the effects of the extreme weather scenario. Therefore, qualitatively, the combined scenario impacts are generally similar to the ones from the extreme weather scenario, albeit less extreme, since they are moderated by the yield improvements (Table 2). Interestingly though, in the combined scenario, the higher crop yields in developing countries (among which import-dependent) combined with the lower yields in the main exporting countries result in an increase in low- and lower-middle-income country self-sufficiency ratios, together with modest increases in food availability and decreases in food expenditures. These decreases originate from lower domestic commodity prices in developing countries that have their yield gaps reduced. The net impact in the upper-middle-income countries is essentially zero, whereas the high-income countries experience a modest increase in food expenditures in the combined scenario. The prevalence of food insecurity is generally low in high-income countries (FAO et al. 2024, 27), so that global food security is likely to improve in the combined scenario.
In Figure 6, we present the relative changes in food expenditure (per capita) in the different scenarios in panels A, B, and C with respect to the baseline expenditure (Figure 3). Figure 6 displays a disparity in food expenditure increase in the world. Food expenditure in import-dependent countries (see Figure A1) increases proportionally more than in other countries, given the increase in world prices due to extreme events in big exporter countries and the reduced capability of import-dependent countries to react to increased world commodity prices through higher production (panel A). While the effects are diminished when the yield gap is reduced in developing countries (panel B), the combined effects still show higher expenditures in more import-dependent countries (panel C) with respect to the baseline.
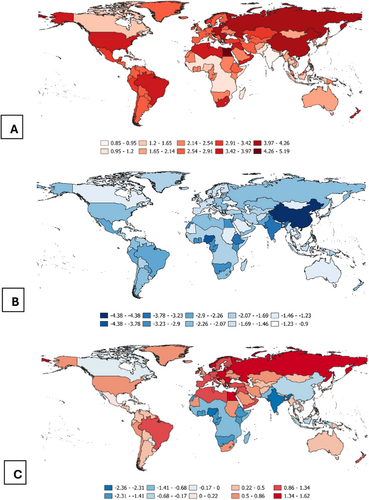
Total food expenditure (per capita) increases unequivocally in all countries in the extreme weather scenario. This increase ranges from +1% in India and Vietnam to +5% in Egypt. These effects result from these countries' net trade export positions linked to the effects of the weather extremes (fewer exports) and the positive yield response in unaffected countries (no big producers and exporters), where producer prices increase dramatically in the shock year. For example, Vietnam's maize yield increases by +3.3%, Iran's wheat yield rises by +2.2%, and India's soybean yield increases by +1.2%.
In the case of the yield gap scenario, all countries improve their food expenditure bill, ranging from −1% in Vietnam to −4% in Ethiopia and Nigeria. Countries that do not benefit directly from an improvement in yield gaps (such as, for example, Brazil, Russia, and the USA) also decrease their food expenditure bill by around −2%.
In the combined scenario, where both weather extremes and yield improvements are included, only a few countries decrease their food expenditure with respect to the baseline. The decreases in food expenditure involve India (−2.4%), Nigeria (−2.3%), Ethiopia (−1.5%), other Sub-Saharan Africa (least developed −0.7% and other countries by −1.4%), and Pakistan (−1%). In these cases, the yield improvements are higher than the extreme weather shocks. In most cases, however, the opposite is true, with the weather extreme shock being higher than the yield improvement effect. Some of the biggest increases in food expenditure are from the Other Near East (NEO) region3 (+1.3%), Egypt (+1.6%), and other North African countries (+1.4%). This is a notable drop in the intensity of the increase that is seen in the weather extreme scenario, which highlights that, in import-dependent countries, closing yield gaps has the potential to reduce the exposure to negative price effects from adverse weather events.
We clarify the disparity in impacts under different scenarios by examining a selection of countries with varying levels of import dependence, income, and productive capacity in Table 3. The comparison in this Table highlights the diverse consequences for these countries based on their agricultural production and import dependency. For example, Egypt, despite being a significant agricultural producer, imports around 60% of its maize and wheat for domestic use. In contrast, Nigeria relies almost entirely on wheat imports for its food needs while being nearly self-sufficient in maize. The NEO countries are net importers (importing nearly 100% of both maize and wheat consumption) with limited or no production capacity. Finally, Kazakhstan is a major net exporter of wheat and a small net exporter of maize and experiences its own distinct impacts. More importantly, unlike the other three countries, Kazakhstan is impacted negatively by the weather shock (−11% to maize and 29% to wheat) in both the extreme weather and the combined scenario.
| Indicator | Country | Extreme weather scenario | Yield gap | Combined |
|---|---|---|---|---|
| Maize price | Egypt | 39 | −26 | −4 |
| Nigeria | 3 | −75 | −74 | |
| Kazakhstan | 32 | −13 | 11 | |
| Near East Other | 40 | −18 | 9 | |
| World | 41 | −19 | 9 | |
| Wheat price | Egypt | 47 | −17 | 21 |
| Nigeria | 49 | −16 | 25 | |
| Kazakhstan | 59 | −15 | 34 | |
| Near East Other | 48 | −16 | 24 | |
| World | 51 | −16 | 26 | |
| Food in calories | Egypt | −3 | 1 | −1 |
| Nigeria | −1 | 2 | 2 | |
| Kazakhstan | −2 | 1 | −1 | |
| Near East Other | −1 | 0.5 | −1 | |
| Food expenditure per-capita | Egypt | 5 | −3 | 2 |
| Nigeria | 2 | −4 | −2 | |
| Kazakhstan | 3 | −2 | 1 | |
| Near East Other | 4 | −2 | 1 | |
| Reference values | SSRa (%) | GDP per capitab ($) | Wheat yield gapc (%) | |
| Egypt | 51.6 | 3380 | 31.5 | |
| Nigeria | 83.3 | 2320 | 31.7 | |
| Kazakhstan | 144 | 11,875 | 23.7d | |
| Near East Other | 25.8 | 8420 | 10 |
- a Self-sufficiency ratio (in calories) in % for 2023 (OECD-FAO Outlook 2024).
- b GDP nominal per capita in USD for 2023 (OECD-FAO Outlook 2024).
- c The gap closing applied % between the estimated rainfed potential from GYGA and the OECD-FAO 2024 outlook average for 2019–2023.
- d This is not applied to Kazakhstan in the yield gap and combined scenarios.
In the extreme weather scenario, Kazakhstan's negative wheat production shock is partially transmitted to world markets, resulting in a stronger domestic price reaction than for Egypt and Nigeria, which are partially self-sufficient. In the combined scenario, despite Kazakhstan being exposed to the extreme weather shock but not having improved yields, the price effects are aligned fairly closely to world price movements. Kazakhstan's experience highlights the importance of domestic production as a buffer when international trade is disrupted and the importance of international trade as a buffer when domestic production is disrupted.
Effects on domestic producer prices are fully transmitted in regions like the Other Near East (NEO), where price shifts are directly tied to global market fluctuations due to their status as net importers with limited or no production capacity. Even in scenarios where yields for maize and wheat improve, the benefits are minimal because the region's arable land is scarce.
5 Discussion
The ability to close yield gaps to reduce food insecurity is not only dependent on price shifts but also on a country's intrinsic agricultural capacity, such as arable land availability and production capability, which varies significantly across regions. The implications of these disparities become even more apparent when examining the rise in real food expenditures per capita, including all food consumed (meat, dairy, cereals, etc.). In a region with a highly diverse population, such as the Near East, the poorest people are particularly vulnerable. As their diets are primarily made up of staple crops (e.g., wheat), any price increases will have a disproportionate negative impact. This effect is compounded by rising prices of animal products, as the costs of wheat, maize, and soybeans—key inputs for animal feed—also push up prices for meat, dairy, and other animal-based products. Pairing yield gap closure with more structural development policies would further increase resilience and imply lower reliance on exogenously imposed trade restrictions to support domestic industries (e.g., export bans or import tariffs).
The negative effects of extreme weather events in exporter countries may have cascading risks. For example, a drought, as a primary climate hazard, reduces soil moisture and puts water resources at risk. The direct agricultural impact of the droughts is lower agricultural production due to reduced agricultural yields. Even though temporarily relieving the direct effects of a drought, a country using more irrigation water in drought-prone areas would potentially increase salinisation and long-term loss of soil productivity. These effects may be felt in import-dependent developing countries, as a reduction in crop production will reduce exports, increasing staple crop prices and lowering feed available for animal production, thus also increasing animal production costs.
Moreover, and more often concurrently, bigger shocks to agricultural production may come from outside the EU as production and supply chain risks may be higher in the world, compounded by a growing world population and changing demand towards goods (such as meat) that require cereals and other crops as feed.
Climate-related shortages can increase food price volatility and may have international consequences depending on the prominence of the exporter country in the world. This variability may threaten the affordability of nutritious food for low-income households, both in countries directly hit by major climate events and in countries that are import-dependent. More generally, crop failures in main exporter countries may provoke famines in import-dependent countries if these are not able to diversify the sources of their food intake. Depending on the level of import dependence, in some cases, food price volatility may spark social unrest (e.g., the Arab Spring initial movements) and climate migration to find countries that are less subject to climate change or extreme events.
6 Conclusions
We analyse the effects of extreme weather events in big exporting countries and the effects of moderate yield improvements in developing countries on world agricultural production, trade, food access, and food affordability. We also consider the combined effects of both scenarios to understand if yield improvements can alleviate the projected negative effects of extreme weather events in the future. We analyse the extent to which yield improvements in developing countries can offset impacts resulting from extreme weather events in major producer and exporter countries, for which import-dependent countries may be susceptible. Our main findings can be summarised as follows. First, simultaneous weather-related shocks to crop yields in the main exporting countries can lead to substantial increases in world food prices. These increases result in large domestic price responses in the countries affected by the lower crop yields and in countries strongly reliant on food imports. These effects confirm the vulnerability of strongly import-dependent countries to international price and supply shocks. Second, closing yield gaps would result in substantially lower international prices and food expenditure, especially in developing countries. Finally, the combined effect of yield gap narrowing and the extreme weather shocks depends on the country production capabilities and their net trade positions. Sub-Saharan Africa's higher unexploited yield potential, in the combined scenario, highlights its potential to be less vulnerable to weather shocks. However, not all developing countries have the potential to increase their yields. The Middle East and North African countries, for example, are import-dependent and have low yields in general but are nonetheless close to their potential. Consequently, changes in prices are not homogeneous worldwide and are more impactful on import-dependent countries due to price transmission effects, potentially compounded by exchange rate effects, tariffs, and domestic market infrastructure.
In the combined scenario, food expenditure is higher for import-dependent countries, in particular upper- and lower-middle-income countries. As long as import-dependent countries remain strongly dependent on outside production, they are exposed to higher external price shocks that can originate in leading producer and exporter countries.
Developing countries that have room for increasing their agricultural productivity and for unlocking untapped yield potential stand to gain the most from closing yield gaps. This would provide a solution to reducing their vulnerability to imported price shocks. Yield gap reductions would significantly and sustainably increase domestic production, lower food prices, and reduce import dependence, but would not fully counteract extreme weather shocks, especially in regions with limited agricultural potential, like North Africa. The reduction of yield gaps should be complemented by structural development policies to enhance resilience.
Some caveats stem from the stylised scenario used in our analysis. First, our analysis does not consider the potentially even stronger effects of extreme weather in developing countries. These effects could exacerbate the import dependence of some of these countries and threaten food access for the most vulnerable. Second, this analysis does not consider additional yield gap reductions in major food exporters beyond baseline projection improvements. Given our results, these improvements could soften the effects of the extreme weather scenario on more food-insecure and import-dependent countries even if their net importing position could increase. Third, we consider that the agroclimatic yield potential increases under present conditions. However, future climate change may prevent these yield potentials from being realised. For example, by diminishing precipitation in some locations, the yield potential in those areas may effectively be decreased. Our findings also show that higher crop yields in countries with substantial yield gaps alleviate the negative impacts of an extreme weather scenario. Countries closing higher unexploited yield potential are among the ones that stand to benefit the most. However, the yield gap reductions considered do not completely offset the extreme weather shock effects in the years of the main climate shocks. Although the combined impact on food expenditures is softened with respect to the extreme weather scenario, our analysis probably underestimates the food security impacts from the relative price changes in the combined scenario, given the strong reliance of potentially vulnerable people on staple crops. Fourth, even though we focus our combined scenario analysis on the year 2032, in which the weather extremes occur, reducing yield gaps is more structural, and improvements last further into the future. Finally, our analysis does not consider the increases in input costs necessary to reduce yield gaps (e.g., additional fertilisers, improved seed, crop protection products, and capital investments).
Disclosure
The opinions expressed and arguments employed herein are those of the authors and do not necessarily reflect the official views of the European Commission. [Correction added on 6th June 2025, after first online publication: A Disclosure section has been added in this version.]
Conflicts of Interest
The authors declare no conflicts of interest.
Endnotes
Appendix A
Open Research
Data Availability Statement
Data sharing is not applicable to this article as no new data were created or analyzed in this study.


