The Intriguing 4D Seismic Signature of Reservoir Pore Collapse in Weakly Cemented Sandstones
Funding: The authors received no specific funding for this work.
ABSTRACT
Time-lapse seismic signals and their relation to variations in reservoir pore pressure and fluid saturations are, in general, well understood. Occasionally time-lapse (4D) seismic data do present some intriguing anomalies that cannot be properly explained by our general well stablished expectations, forcing us to consider less conventional hypotheses. We present one such case, occurring in a weakly cemented sandstone reservoir in the North Sea. This reservoir presents a few 4D seismic softening signals occurring as a response to pore pressure decrease, where no saturation changes are expected. With a detailed multidisciplinary analysis, we assess all possible explanations for this type of signal and show that conventional explanations in terms of fluid saturation changes and/or elastic stress variations fail to explain the full characteristic of the observed anomalies. As an alternative hypothesis, we propose the possibility of pore collapse, an inelastic rock damage process, as an unconventional explanation to the observed anomalies. We show that this hypothesis is the only one that explains all the characteristics of the observed anomalies in terms of their lateral and vertical extents, as well as their magnitude and temporal evolution behaviour. We then conduct a theoretical modelling feasibility study to estimate the critical pressure for initiation of rock damage and estimate the amount of rock damage needed to produce the observed 4D seismic signals. This feasibility study suggests that the reservoir effective pressure achieved during field production is likely not enough to crush grains and cause reservoir compaction. However, they may be enough to cause cement and weak grain cracking, which we estimate through rock physics modelling to be a sufficient mechanism for producing the observed softening anomalies. This makes weakly cemented sandstones more prone to this type of counterintuitive signal, as cement damage occurs at lower effective pressures, more commonly achieved during reservoir production. We also highlight important considerations regarding plans of CO2 storage into depleted reservoirs, as the possibility of rock damage during production would complicate the monitorability of the injected CO2 plume.
1 Introduction
The sensitivity of rock elastic properties to variations in effective pressure is a crucial element in time-lapse (4D) seismic data interpretation. Fluid production and injection activities in subsurface reservoirs cause pore pressure changes that lead to variations in seismic wave velocity. These velocity variations may produce observable 4D seismic signals, so 4D seismic data can provide information about the pore pressure changes in a subsurface reservoir. To properly interpret the 4D seismic signal in terms of pore pressure changes, we must understand the behaviour or sensitivity of the rock elastic properties to variations in effective pressure. Laboratory experiments that measure ultrasonic velocities while compressing rock samples can provide a basis for this comprehension. In most cases, these experiments show a non-linear behaviour. Ultrasonic velocities increase sharply as effective pressure raises from zero to a few MPa, and as it continues to rise, there is a gradual decrease in the rate of velocity increase until it reaches a maximum asymptote velocity. Many theoretical models have been proposed to explain this non-linear behaviour (e.g., Mindlin 1949; MacBeth 2004; Vernik and Kachanov 2010). In terms of reservoir pore pressure variations, this behaviour means that pore pressure increases lead to seismic velocity decreases (softening) and pore pressure decreases lead to seismic velocity increase (hardening). The non-linear character of this curve also informs that, starting from a fixed initial reservoir pressure, softening signals from pore pressure increase are more intense than pressure decrease hardening signals. These laboratory observations and theoretical models are largely confirmed by 4D seismic observations. Many publications report strong softening signals where pressures increase around fluid injector wells, whereas weak pressure–related hardening signals are observed around depleting fluid production wells (MacBeth et al. 2019).
However, there are some cases where the observed 4D seismic signatures do not follow these expectations. These are related to situations where pore pressure changes cause inelastic damage to the rock structure. This can occur around injector wells if pore pressure increases beyond the rock fracturing strain limit. This produces fractures in the rock, leading to 4D seismic softening signals with magnitudes even higher than what is expected from elastic pore pressure increase (e.g., Saul and Lumley 2015; Côrte et al. 2023). Rock damage can also occur when pore pressure decreases so that effective pressure goes beyond a critical limit. This causes the weight of the overburden to crush the reservoir rocks, in a process commonly referred to as pore collapse, which leads to the creation of micro-cracks and porosity loss by compaction. A detailed review of the pore collapse process and its theoretical treatment can be found in Wong and Baud (2012). Scott (2007) offers a simple geophysics-oriented review. From a 4D seismic perspective, the most important thing is how the seismic wave velocity behaves across this inelastic rock damage process. Although compaction causes seismic velocity increases related to porosity decrease, the creation of cracks causes seismic velocity decreases. So, depending on the balance between these two micromechanics processes, pore collapse may lead to entirely opposite 4D seismic anomalies. In compacting reservoirs, it produces hardening signals with much higher magnitudes than what is expected from elastic pore pressure decrease (e.g., Johnston and Toksöz 1980; Soares et al. 2002; Corzo et al. 2013). In non-compacting reservoirs, it may lead to intriguing softening signals upon pore pressure decrease; hence, the opposite polarity to what would be expected in elastic conditions. Fortin et al. (2007) show a good example of this behaviour in a laboratory experiment with a Bleurswiller sandstone sample (Figure 1). In this experiment, the rock sample was compressed until extensive grain crushing damage was observed, leading to a 7% velocity decrease. Reports of this type of signal on 4D seismic data are few (e.g., Barker et al. 2008), but this does not mean this is a rare phenomenon. This counterintuitive response is difficult to properly characterize and may be easily misinterpreted or regarded as noise. However, in some cases, it may be crucial to characterize the occurrence of rock damage to properly predict and monitor subsurface reservoirs. For example, we highlight the high importance of this characterization for plans of CO2 storage into highly depleted oil and gas reservoirs. If rock damage occurs in these reservoirs during the production/depletion phase, this may complicate considerably the monitorability of the injected CO2 plume later.

Below we present a real case example of a reservoir where such a signal is observed in two different areas. The Snorre field contains examples where 4D seismic softening anomalies are observed in regions where only pore pressure decrease had occurred, with no expected saturation changes. This is a consistent pattern that occurs in different regions and different seismic monitor surveys. It produces clearly observable regular anomalies on high-quality streamer and permanent reservoir monitoring (PRM) 4D seismic data. These cannot be dismissed as noise or data incoherence, although conventional interpretations fail to explain the full signal characteristics. In this work, we provide a detailed analysis of the pore collapse hypothesis as an explanation for these intriguing softening anomalies observed in the Snorre field. We provide a detailed interpretation of two separate softening anomalies, assessing all possible explanations for this signal with a multidisciplinary analysis of the signal characteristics. We consider the anomalies location with respect to producer and injection wells, the injected fluid and pore pressure behaviour in their surroundings, their lateral and vertical extents, magnitude and their temporal evolution behaviour. This analysis shows that conventional hypotheses for softening signals fail to explain the full characteristics of the observed anomalies, whereas the rock damage hypothesis succeeds in all cases. To further validate the viability of the pore collapse hypothesis in Snorre, we conduct a theoretical feasibility study. First, we quantify the critical pressure for initiation of pore collapse in the Snorre rocks with a grain crushing model (Appendix A). Then we devise an inelastic stress-sensitive petro-elastic model and calibrate it to both well log data and stress sensitivity laboratory experiments (Appendix B). This model allows us to estimate the amount of rock damage needed to produce the observed anomalies, which helps in determining the feasibility of the proposed pore collapse hypothesis. We also use the calibrated model in a simulator for seismic modelling workflow (Sim2Seis) to show how the proposed hypothesis is the only option that can model the full characteristics of the observed anomalies.
2 Field Description
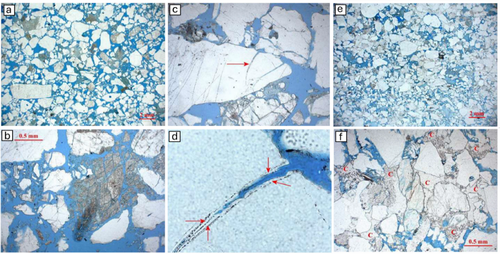
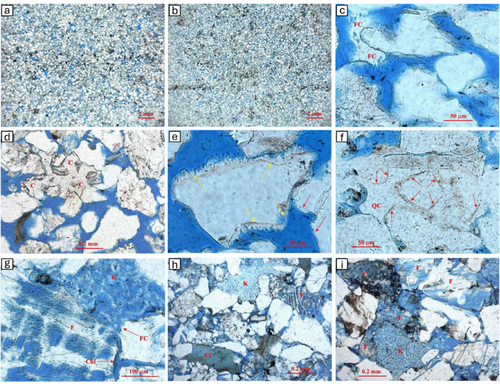
The Snorre field is located on the Norwegian Continental Shelf, with top reservoir depths ranging from 2.3 to 2.5 km and an oil column thickness of around 200 m. It consists of Triassic and Early Jurassic sandstones distributed in a repetitive sequence of fluvial-channel sandstones, non-channelized sands and silty overbank shales (Caillet et al. 1991). The area has gone through two rifting episodes, which led to the breakage of this sandstone structure into a few rotated fault blocks. The whole structure dips to the southwest and is eroded at the top, at the base-cretaceous unconformity, which makes the seal (Dahl and Solli 1993; Hesthammer et al. 1999). Because of the structure dip, the oil reservoir rocks vary from southwest to northeast. The younger Statfjord and upper Lunde formations form the oil-bearing reservoir in the southwest portion of the field, whereas in the northeast, the oil reservoir is mainly in the older mid and lower Lunde formations. In Snorre, the Statfjord and upper Lunde formations are positioned along depths within the transition zone between mechanical and chemical compaction by quartz cementation (approximately 1.9–2.1 km) (Owais 2016). Thus, the Statfjord and the upper Lunde formations are weakly cemented sandstones. The mid and lower Lunde formations are mostly positioned at depths within the chemical compaction region, so these are more heavily cemented than the previous (Owais 2016). Across the whole reservoir, cementation increases with depth, both within each formation and across the stacked formations. Figure 2 shows thin section images of core samples from the Statfjord formation in the Snorre field. These show the difference in cementation levels at different depths within the Statfjord (Figure 2a,e). They also show a few naturally cracked grains (Figure 2b,c), some with quartz cement filling in the crack space (Figure 2d). This suggests some level of grain crushing has occurred at natural reservoir stress conditions. Crack-filling cement (Figure 2d) and the grain contact calcite cement (Figure 2f) are weak points within the rock structure that may facilitate the initiation of the pore collapse process. The large grain sizes observed in these samples also contribute to a lower critical pressure, based on Hertzian grain crushing theory (Wong 1990; Appendix A). Figure 3 shows thin section images of core samples from the upper Lunde formation in the Snorre field. The smaller grain sizes make grain crushing more difficult, requiring higher effective pressures. However, abundant features like partly dissolved feldspar grains and micro-porous kaolinite (Figure 3g–i) constitute weak grains that may crack and crumble at lower effective pressures. Cementation increase with depth within the upper Lunde is shown in Figure 3a,b. Different types of contact and grain coating cement are shown in Figure 3c–f; these also constitute weak points that may help pore collapse initiation at lower effective pressures.
Softening anomalies as a response to pore pressure depletion are observed in a few regions of the Snorre reservoir. They are better characterized in the initial period of production because at this point, there is little fluid injection, and it is possible to isolate the effects of pore pressure changes without interference from fluid saturation changes. At later production times, injected fluids tend to swamp over the areas where these anomalies are observed, making the characterization of this specific effect much more difficult. We will focus on two regions where these 4D softening anomalies are observed, and we will analyse three streamer seismic surveys, shot during the initial period of production, in the years of 1997 (baseline), 2006 (Monitor 1) and 2012 (Monitor 2). We estimate, from the 4D signal on time-lapse time-shifts and seismic amplitudes, that the studied softening anomalies are related to a seismic velocity decrease in the range of 3%, where they are weakest, up to 7% where they are strongest. In the anomaly regions, pore pressure had decreased by around 10–20 MPa from an initial reservoir pore pressure of around 40 MPa. Anomalies are observed at depths ranging from 2.5 to 2.7 km, so overburden stress is 60 MPa on average (assuming a 1 psi/ft lithostatic gradient). This puts the effective pressure at the regions of interest, ranging from 20 to 40 MPa.
It is also worth noting that overburden time-shifts are observed throughout the reservoir in many different regions and many seismic monitoring surveys (Røste et al. 2015). Both overburden extension (slow-down, softening) and overburden compression (speed-up, hardening) time-shift signals are observed directly above pore pressure decrease and increase regions, respectively. This itself is an indication that the Snorre rocks are geomechanically active. Overburden extension time-shifts are observed directly above the reservoir softening anomalies we address in this study, but not only there. These also appear in other regions with pore pressure depletion and no reservoir softening anomalies. So they are an indication that the reservoir is contracting upon pore pressure decrease; however, this is not definite evidence of pore collapse, as reservoirs may compress and expand elastically. To determine if the reservoir compression occurs inelastically (rock damage, pore collapse), we must analyse the 4D signal at the reservoir level and assess all the possibilities that could explain this signal.
-
Oil-replacing water
-
Pore pressure increase
-
Fluid pressure effect (low rock stress sensitivity)
-
Gas saturation increase due to gas injection
-
Gas saturation increase due to gas exsolution (as a response to pore pressure decrease)
-
Pore collapse
The first two options are easily dismissed in this study. Because the softening anomalies in question are observed in initially oil-saturated regions going through pore pressure decrease. The four other options (3–6) will be assessed further by analysing the 4D signal characteristics in terms of its magnitude, lateral and vertical extents and temporal evolution along two seismic monitor surveys.
2.1 Bubble Point Pressure and Gas Exsolution
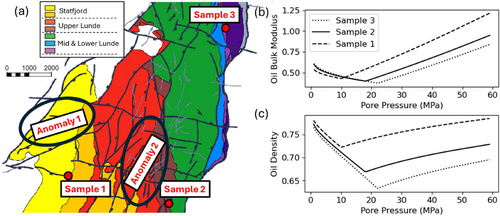
The most common explanation for observing softening signals upon pore pressure decrease is related to gas that comes out of solution in the oil because pore pressure has decreased below bubble point pressure. This leads to an increase in free gas saturation, which results in a bulk rock seismic velocity decrease. This is a common process in many reservoirs and depends only on the pore pressures achieved during production and the oil bubble point pressure. To determine bubble point pressures, we rely on laboratory experiments on oil fluid samples that were extracted from the specific reservoir in question. In Snorre, the oil is undersaturated throughout the field, and there is a segregation of oils between different structure compartments. There is a northeast-to-southwest decrease in the content of light hydrocarbons, and gas–oil ratio decreases from 160 to 60 (Caillet et al. 1991; Jorde and Diesen 1992). With such spatial variations in oil composition, bubble point pressures also vary throughout the reservoir. For this study, we had access to laboratory data from three oil samples from the Snorre field (Figure 4). These data and previous publications (Jorde and Diesen 1992) show bubble point pressures varying from 9 to 22 MPa depending on the reservoir region. The estimated low pore pressure limits achieved in the studied regions are generally above the estimated bubble point pressures. However, both these estimations are uncertain, and bubble point pressure varies considerably throughout the reservoir. Given this uncertainty, pore pressures may have gone below bubble point pressure in some of the softening anomaly regions, but probably not in all of them. Further analysis of each anomaly and their full characteristics, especially in terms of their temporal evolution, will be shown in a later section and should help shed light on whether gas exsolution is a viable hypothesis for explaining the observed softening signals.
3 Data Analysis
3.1 Anomaly 1
Anomaly 1 is present in a western region of the Snorre field, where the oil-bearing reservoir is the Statfjord sandstone (Figure 4a). Figure 5 shows a cross-section of the baseline seismic survey (1997) and the 4D difference for two monitors (2006 and 2012). In this region, the Statfjord formation is a thin reservoir (20–35 m) directly overlain by the Dunlin shale formation. For this reason, anomalies in this region are single-cycled and can be visualized and analysed in map view without much information loss. Figure 6 shows time-lapse difference maps of RMS amplitudes and the reservoir simulation results for pore pressure, water saturation and gas saturation. These time-lapse maps were extracted along the Statfjord level for both monitor surveys. The Statfjord formation in this region is subdivided into three fault blocks distributed from north to south, with the southernmost being the deepest. All three fault blocks dip to the west. A producer well is placed at the north edge of the north fault block, and two water-alternating gas (WAG) injector wells are placed one in each of the other two fault blocks.
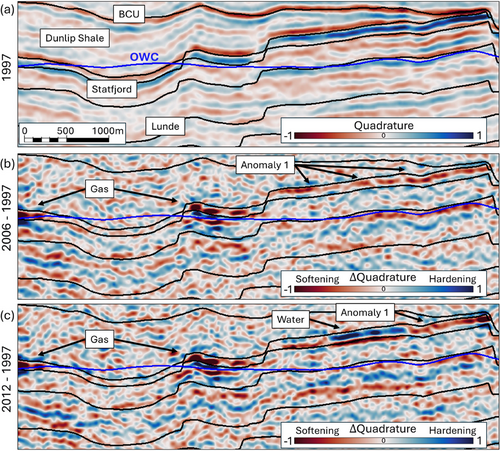
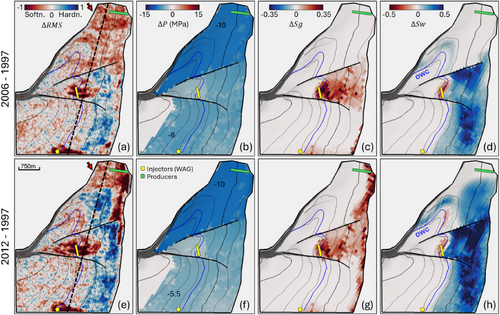
At the time of the first monitor seismic survey (2006), the north fault block had undergone pore pressure depletion of around 8–10 MPa (based on both reservoir simulation predictions and well down hole pore pressure measurements). Anomaly 1 is a weak but well-defined softening signal observed across the whole north fault block. In the middle and south fault blocks, injected fluid anomalies are observed extending from both injectors. The hardening anomalies are related to the injected water, and the strong softening anomalies to the injected gas. These gas-related softening anomalies are much more intense and localized than the broad and weak signal observed in the north fault block. Injected gas migrates first along the fault blocks towards the crest at the east, then along the crest towards the north. Faults are permeable at the crest of these fault blocks. As time progresses, the fluid anomalies extend to the north and begin to interfere with the weaker softening anomaly in the north fault block. In the 2012 survey, most of the north fault block is taken over by fluid-related anomalies, but there is a small region at the northwestern edge that maintains the same softening magnitude as before.
3.1.1 Gas Hypothesis
Observing the fluid dynamics in these two survey differences, it is quite clear that the 2006 anomaly in the north block is not related to injected gas. Both its magnitude and lateral extents show very different characteristics from the injected fluid anomalies extending from the injector wells. Injected gas forms intense and localized softening anomalies. Injected gas is seen to migrate first towards the crest, then along the crest towards the producer. It would not fill in the whole of the north block with low enough saturations to produce the weak softening anomaly observed in the 2006 survey. The broad and weak characteristics of Anomaly 1 could be explained by gas that has come out of solution from the oil, across the highly depleted region. If pore pressure had gone below bubble point pressure across the whole of the north fault block, gas would come out of solution from the oil across the whole area homogeneously. Depending on the pore pressure, it might reach a low saturation below critical gas saturation (5%) and remain in this state. At these low saturation levels gas is not mobile, so it would not float to the crest. We model this hypothesis with Sim2Seis (Figure 8c), imposing a 5% gas saturation increase across the north fault block. This shows a reasonable match to the observed anomaly in terms of shape and magnitude, so it seems gas exsolution would be a good explanation for Anomaly 1. The only strange thing is that the pore pressure reached (∼20 MPa) is nearly 10 MPa above the expected bubble point pressure in this region. From the three fluid samples we had access to, one was extracted in the same formation in the surroundings of the anomaly (Sample 1—Figure 4), and it showed a bubble point pressure of 10 MPa. So this hypothesis would require bubble point pressure in the north fault block to be considerably higher than the value measured in laboratory experiments with a fluid sample extracted in the vicinity.
3.1.2 Fluid Expansion Hypothesis
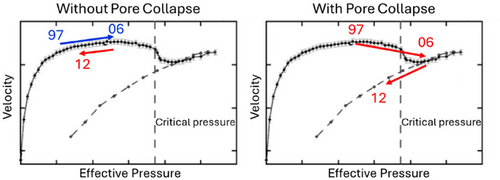
Another possible explanation for the observed signal is that when pore pressure decreases, the rock-saturating fluids expand, leading to a bulk seismic velocity decrease. However, the porous rock structure itself also responds to this pressure variation, in an opposite way. As pore pressure decreases, effective pressure increases, compressing the rock and making it stiffer, which leads to a seismic velocity increase (within elastic behaviour conditions). The softening effect of pore pressure decrease on fluids is usually lower than the hardening effect it has on the porous rock frame itself, so we tend to expect hardening signals upon pore pressure decrease. However, there are certain situations where the effect of stress changes on the rock frame may be low enough that the fluid pressure effects are larger, leading to 4D seismic softening signals. The non-linear behaviour of wave velocities with effective pressure observed in Figure 1 is a common curve shape for sandstone sample experiments within the elastic domain. The curve shows that velocity increases at gradually lower rates as effective pressure increases until it reaches a maximum asymptote velocity. At this point, within the elastic domain, the seismic velocity may not respond to stress changes at all, reaching an asymptote high velocity limit. In Figure 1 experiment, this insensitive stress range would be between 125 and 140 MPa. But these values could be very different for a different sandstone. Hence, if effective pressures are high enough to reach the asymptote range of the rock frame stress sensitivity curve but not high enough to cause rock damage, the fluid pressure softening response may be larger than the rock frame response, resulting in a fluid expansion softening anomaly. The pore collapse processes may also contribute to low rock frame sensitivity to stress changes. As we discussed earlier, pore collapse does not necessarily result in seismic velocity decrease. Depending on the rock compaction rate, there may be a situation where the porosity decrease (hardening) balances out the crack formation (softening), leading to an apparent insensitivity of the rock frame seismic velocity to stress variations.
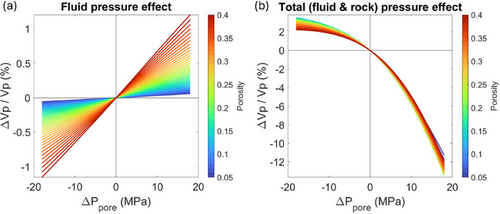
To assess the possibility of the observed softening signals being related to fluid pressure responses only, we conduct a petro-elastic modelling study using a model calibrated to well log data from the Snorre field (Appendix B). In this modelling exercise, the rock frame stress sensitivity is turned off, so we can estimate the magnitude of the velocity decrease related to the fluid pressure response only. To make the fluid modelling as realistic as possible, we calibrate an equation of state (EOS) to three fluid samples from the Snorre field (shown in Figure 4). The three fluid samples show a slightly different response to pressure, so we pick the sample that is most sensitive to pressure changes for this modelling. Figure 7 shows the seismic velocity relative variation as a function of pore pressure changes for the porosity range of rocks in the Snorre field. This shows that, even in the most extreme cases of porosity as high as 35% and pore pressure decreases of 20 MPa, velocity decreases due to fluid expansion responses are only around 1%. Even with the high-quality streamer surveys, we do not expect 1% velocity changes to produce observable anomalies above noise levels. Given the estimation that the observed softening anomalies are related to at least 3% velocity decreases, this modelling exercise indicates that the fluid pressure responses alone do not have the potential to produce the observed anomalies. This hypothesis is also modelled with Sim2Seis (Figure 8b), showing that fluid effects alone would produce an anomaly of the same shape and lateral extent of Anomaly 1. However, as expected from this initial fluid modelling exercise, this is not enough to produce anomalies with the magnitude of Anomaly 1.

3.1.3 Rock Damage Hypothesis
The final hypothesis to be considered is that rock damage occurs across the north fault block, leading to a softening of the rock frame itself. We also model this hypothesis with Sim2Seis (Figure 8d) and show that pore collapse can produce an anomaly that matches the observed in terms of shape, lateral extents and magnitude. Time-lapse time-shifts were also modelled and found to be similar in magnitude and shape to the measured time-shifts. In conclusion, Anomaly 1 can be explained by two hypotheses: gas exsolution or pore collapse. However, gas exsolution requires bubble point pressures considerably lower than what is expected from laboratory measurements done in a fluid sample extracted in the surroundings of the anomaly. So it seems to be an unlikely explanation. Pore collapse, on the other hand, is in agreement with all the gathered data and interpretation in this region.
3.2 Anomaly 2
Anomaly 2 is present in a central graben region of the Snorre field, where the oil-bearing reservoir is the upper Lunde sandstone (Figure 4a). In this region, the oil column in the Lunde is around 200 m thick. For this reason, visualization with maps cannot represent the process in detail, but it does provide a spatial awareness of the reservoir dynamics in this region. Maps and cross-sections of time-lapse changes for two monitor surveys (2006 and 2012), differenced with the same baseline (1997), are shown and interpreted below. Figure 9 shows vertical average maps of the reservoir property variations (pore pressure and gas saturation) as predicted by the reservoir simulator, as well as overburden time-shift and reservoir RMS difference seismic attributes. Figure 10 shows time-lapse difference cross-sections along the dashed lines shown in Figure 9d. The main anomaly of interest is marked with red arrows in both figures.
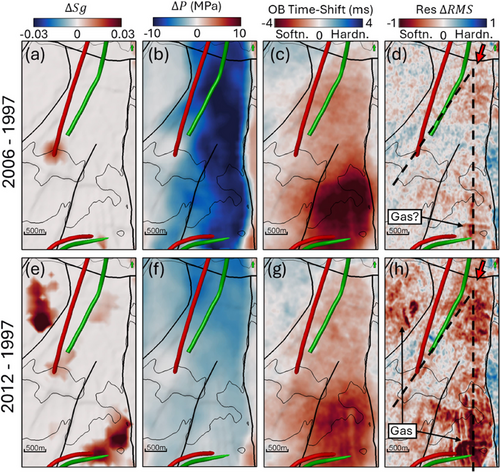
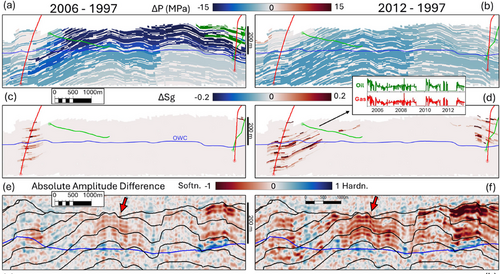
Anomaly 2 appears in the north of this fault block, around the heal of a producer well (Figure 9d,h). This region is possibly connected to two WAG injectors, one positioned around 1.5 km to the southwest of the anomaly and another further away, nearly 3 km to the south. The cross-section shown in Figure 10 cuts across these three wells. The southwest injector (left in sections) has been operational since the beginning of 2006, but the south injector (right in sections) begins injecting in 2010 to provide pressure support to a region that is severely depleted by a nearby producer. By 2006, the reservoir pore pressure had decreased by around 14 MPa in the main anomaly region (north) and up to 18 MPa in the southern portion (history matched simulation model predictions). This difference cannot be appreciated on the vertical average maps (Figure 9b) but is clear on the cross-section (Figure 10a), where we see that this extreme −18 MPa pore pressure change occurs only at the topmost layers of the reservoir. The overburden time-shift does show evidence of this depletion as well, with overburden extension signals (softening/slow-down) both in the north and south, but with stronger magnitude in the south (Figure 9c), reflecting the stronger depletion. From 2009 to 2012, there is a pore pressure increase across the whole fault block of around 8–14 MPa. Pressures are still below initial reservoir pressure, though. The overburden time-shifts show evidence of that as well, with extension signals that are weaker than in 2009 (Figure 9g). So the overburden extension signal is reversible and decreases in magnitude as the reservoir pore pressures are reestablished and the overburden relaxes back closer to its original position (or stress condition). The reservoir amplitude signal, on the other hand, is not reversible. The 2006 amplitude difference maps show two separate weak softening anomalies, in the north and in the south (Figure 9d). Both anomalies increase in magnitude in the 2012–1997 amplitude difference map (Figure 9h). So these reservoir anomalies are irreversible with respect to the pore pressure variations.
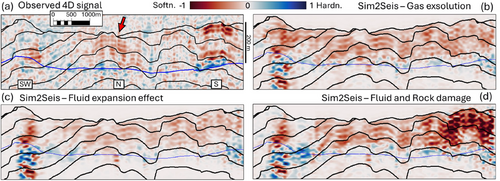
Let us focus on the 2006 absolute amplitude difference cross-section (Figure 10e). It shows two separate softening anomalies in the north and in the south. The north anomaly presents multiple stacked softening cycles with very similar magnitudes, spanning the whole 200 m oil column (red arrow). The 14 MPa pressure depletion in this region also spans nearly the whole oil column but does not extend into aquifer depths with the same magnitude (Figure 10a). The south anomaly is different in shape. It is stronger in magnitude at the top of the reservoir, which coincides with the more heavily depleted top layers. Both anomalies could be linked with rock damage due to pressure depletion; however, they might also be explained by other processes.
3.2.1 Gas Hypothesis
The first possibility to explain the anomalies is injected gas. This might be a reasonable explanation for the southern anomaly. The south injector in the figures is not yet operational in 2006, but there are other injectors further south from where this gas might have come from. Reservoir simulations do not predict enough gas to produce the anomaly here, but these predictions might be inaccurate. If injected gas had reached the south region in 2006, it should create a similar anomaly, with stronger magnitudes at the top of the reservoir, as gas floats up and pools at the top of the structure. The north anomaly (red arrow), on the other hand, cannot be well explained by injected gas, though. This option is inconsistent with the position and vertical distribution of this anomaly and with production data as well. Injection begins in the southwest in 2006, and by the time of the seismic survey, there is not enough injected gas to produce the observed anomaly. If there was, gas might have migrated 1.5 km laterally to fill in the north anomaly region, but it should also show some upwards vertical migration, which would lead to stronger amplitudes at the top of the structure. Furthermore, production data from the producer in this region shows a nearly perfect correlation between oil and gas production rates across the whole production period (Figure 10d), indicating that this well has only produced solution gas even up to 2012.
Another viable explanation for the softening signals is gas exsolution. This option could explain both the 2006 anomalies in the north and south, but it struggles to explain the irreversibility of the anomalies in 2012. Fluid sample 2 is extracted from a region nearby, and it shows a bubble point pressure of 19 MPa in laboratory experiments (Figure 4). The reservoir simulation predicts pore pressures in 2006 at 23 MPa in the north region and 19 MPa in the south. These pressure estimates are uncertain, so real reservoir pore pressures may have gone below bubble point pressure in both regions in 2006. If this occurred, it should in concept create anomalies similar to the ones observed, in form and magnitude, considering that more gas might come out of solution in the south than in the north, given the lower pore pressures achieved. One detail should be mentioned here. For the North 2006 Anomaly to be well explained by gas exsolution, gas saturations must have been below critical gas saturation (∼5%) and this should require a pore pressure below but very close to bubble point pressure. The reason for this is that, if gas saturations become higher than critical gas saturation, the released gas becomes mobile and floats to the top of the reservoir. The vertically homogenous magnitudes observed in the north anomaly could be explained by vertically homogeneous gas saturations, and this could only be achieved at saturations below critical gas saturations. Figure 11b shows a Sim2Seis modelling result where we impose a 5% gas saturation increase across the whole oil column to show that this situation should produce an anomaly similar to the one observed in 2006. However, higher gas saturations would induce upward gas migration, and the anomaly should change its format, showing higher amplitudes at the top of the structure.
Let us now shift our attention to the 2012 monitor survey (Figure 9h and Figure 10f). In 2012, both the north and the south anomalies become much more intense and maintain the same shape as in 2006. The north anomaly keeps the vertically homogenous magnitudes across the whole 200 m oil column (Figure 10f). This vertical distribution itself cannot be explained by gas exsolution, as the observed magnitudes in 2012 should require gas saturations above 5%, and this should lead to upward gas migration. Furthermore, from 2006 to 2012, there is a pore pressure increase of around 8 MPa in the north region and 14 MPa in the south region (Figure 10a,b). If gas had come out of solution in 2006, this pore pressure increase should either push the gas back into solution, making the anomalies disappear, or the gas might be trapped out of solution and remain in similar saturation levels. So the magnitude increase in both anomalies from 2006 to 2012 cannot be explained by gas exsolution. For the south anomaly, the magnitude increase could be explained by a gas saturation increase due to gas injection in the vicinity, though. The WAG injector in the south begins injecting gas in 2011, and simulations predict a considerable amount of gas in this region by 2012. Hence, the south anomaly in 2006 and in 2012 can be fully explained by gas saturation increase as a result of gas exsolution and gas injection. So it cannot be used as evidence of rock damage in Snorre. Although if rock damage occurred in the north area, it probably occurred in the south area as well, which went through more intense depletion levels. However, the north anomaly remains unexplained. Injected gas had not reached the north region by 2012, and even if it had, it could not have filled the whole 200 m oil column with homogenous saturation levels.
3.2.2 Fluid Expansion Hypothesis
The fluid expansion softening hypothesis also fails to explain the temporal evolution of the north anomaly. Figure 11c shows a Sim2Seis result (2006–1997) where the rock stress sensitivity is turned off, so only the pressure effect upon the fluids is modelled, together with saturation changes. Considering uncertainties, the 2006 magnitudes might be reached by fluid expansion only, but this effect is entirely reversible with pressure recovery. So, if the 2006 anomaly was related to fluid expansion only, it should disappear completely in 2012 with the pore pressure increase.
3.2.3 Rock Damage Hypothesis
We have seen that conventional interpretations for softening signals fail to explain the full character of Anomaly 2, especially the fact that it is irreversible and increases in magnitude after pressure recovery. This temporal evolution can be explained very well by rock damage processes, though. That is because rock damage is irreversible, and its occurrence changes completely the rock stress sensitivity, making the damaged rock more sensitive to subsequent pressure variations. Figure 12 shows an illustrative scheme of the wave velocity evolution with the pore pressure variations. If rock damage occurs by 2006, the pore pressure increase (unloading) from 2006 to 2009 will not bring the velocities back along the same path as was followed in the pore pressure decrease (loading) process. The unloading path after rock damage sends the velocities further down to even lower values. Hence, a pore pressure increase after pressure depletion induced rock damage brings an additional softening signal. This additional softening is not an indication of further rock damage; it is a conventional pore pressure increase softening response, but now on a damaged rock, following a steeper unloading stress sensitivity curve. Figure 11d shows a Sim2Seis result using the calibrated inclusion rock damage model (Appendix B), showing how this hypothesis can replicate all the anomalies, their magnitudes, vertical extents and temporal evolution. We also modelled time-lapse time-shifts and found them to be similar in magnitude and shape to the measured time-shifts. This hypothesis is also in agreement with all the production and injection data, as well as the history-matched reservoir simulation predictions.
3.2.4 Implications for CO2 Storage
One important final remark must be made, which is better illustrated by focusing on the south anomaly. Notice how, because of the uncertainty in the occurrence of rock damage, we cannot be sure if the softening signals in the south region are related to gas saturation increase or not. Both hypotheses can explain the south anomaly well enough; in fact, most likely both occur simultaneously. So it is very hard to determine how far the injected gas has reached in this region from 4D seismic data, because the gas-related softening signal is likely comingled with a rock damage softening signal, and it is very hard to distinguish the two. The fact that the damaged rock is more sensitive to pressure changes makes things even more difficult. Even small pressure changes can now create strong 4D seismic signals that may obscure fluid-related signals more easily than before or even be mistaken for fluid-related signals themselves. This makes 4D seismic monitoring in damaged rocks much more difficult and uncertain. So it raises an important cautionary sign, especially for plans of CO2 storage into highly depleted reservoirs. If rock damage occurs during the reservoir depletion period, the pore pressure increase from CO2 injection will create softening signals stronger than what is expected from elastic domain laboratory studies. These signals may obscure the CO2 plume, making it more difficult to locate and characterize the CO2 distribution, and may even be mistakenly interpreted as the CO2 plume itself. To make things even more alarming, as we have discussed, pore collapse does not necessarily produce an observable signal at all. Depending on the amount of damage and of porosity decrease, pore collapse may occur without leaving any observable evidence at first. However, even small damage will make the rocks more sensitive to pressure changes. So we should expect stronger pore pressure increase softening signals with injection into highly depleted areas, even if there is no observable evidence of prior rock damage.
3.3 Discussion
The observations and data interpretation presented above indicate that pore collapse is likely the best hypothesis to explain the observed 4D anomalies. To validate this hypothesis further, we conduct a physics-based modelling study. First we estimate the critical effective pressures needed to initiate pore collapse in Snorre with a grain crushing theory model (Appendix A). Then we use a petro-elastic model calibrated to Snorre well log and stress sensitivity data to estimate the amount of rock damage needed to produce the anomalies observed in Snorre (Appendix B).
3.4 Estimation of Critical Pressure
The initial estimation of critical pressure with a grain crushing model indicates that the reservoir pore pressures achieved in Snorre are enough to crush grains in the Statfjord sandstone but not in the upper Lunde sandstone. Predicted critical pressures for most rock samples from the Statfjord formation fall within the Snorre effective pressure range (during production). This indicates that some level of grain crushing may occur even at natural reservoir stress conditions. Figure 2b–d is evidence of this, showing cement-filled grain cracks, which are not uncommon in the Statfjord core samples. Samples from the Lunde formation, on the other hand, show a minimum critical pressure of 102 MPa, far above the Snorre effective pressure ranges.
So based on this modelling, we should not expect grain crushing to occur in the Lunde formation. However, the model assumes a homogenous rock fully made of uncemented quartz grains; it does not account for weak points in the rock frame. Laboratory experiments on different rocks with similar porosity and grain sizes have shown that critical pressures vary wildly (13–496 MPa) depending also on rock mineralogy, clay content, grain shapes, cementation levels and lithification processes (Tembe et al. 2008). Well log and petrological data show that the upper Lunde sandstone is weakly cemented and contains partly dissolved feldspar and kaolinite grains (Figure 3), which are weaker than the more abundant quartz grains. Cement and dissolved grains could constitute weak points in the rock that might break earlier, at lower effective pressures than those initially estimated. Could these initial weak point cracks produce considerable velocity decrease? The experiment in Fortin et al. (2007) hints at this possibility. Observe in Figure 1a that the critical pressure (P*) was interpreted at the beginning of rock compaction (increased porosity decrease rate), at an effective pressure of approximately 190 MPa. However, velocity decrease begins earlier, at approximately 150 MPa (Figure 1b). By the time rock compaction begins, the velocity has already decreased by around 2%–3%. This could be attributed to initial rock damage that does not cause rock compaction, possibly related to cement and contact breakage that occurs at lower effective pressures than grain crushing. This makes weakly cemented rocks more prone to these types of anomalies than well-consolidated rocks that are heavily cemented and harder to crack. Unconsolidated/Uncemented rocks would also be harder to crack, as grain crushing would be necessary for fracture formation. So both heavily cemented and uncemented rocks would require higher effective pressure to cause rock damage.
3.5 Rock Physics Modelling
So it is possible that the effective pressures reached in Snorre were enough to break cements and contacts but not to crush the grains themselves. But this would amount to considerably small damage to the rock. Then the question that arises is, would this small rock damage be enough to produce the observed softening anomalies ()? To address this question, we make use of an inclusion-based stress-sensitive petro-elastic model (Appendix B). We calibrate this model to both well log data (from nine wells in the Snorre region of interest) and laboratory stress sensitivity data (nine rock samples from Snorre sandstones). Using this calibrated PEM, we can model a reference rock with total porosity equal to the porosity observed at the hypothetic pore collapse location in Snorre (). Then we can estimate the amount of crack inclusion needed to produce the observed velocity decrease. Figure 13 shows the results of this modelling exercise.
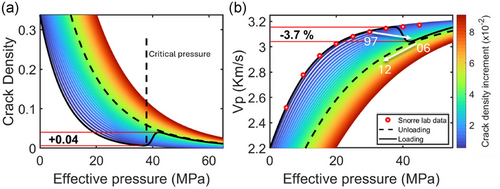
We show that, to produce the softening anomaly, it would require less than half as much rock damage as what was observed in the Fortin et al. (2007) experiment, where extensive grain crushing occurred. So perhaps grain crushing is not a necessary mechanism to produce these anomalies. Maybe a milder damage of weak points in the rock would be enough, and this could occur at lower effective pressures more commonly achieved during reservoir production.
A similar rock physics analysis could also be done using pressure-sensitive contact cement models, such as in Saul and Lumley (2015) or Yu et al. (2025). In both these cases, the authors consider weakening/crumbling of contact cements as a response to large pore pressure increases. However, these models could also be modified to incorporate this weakening effect as a response to pore pressure decrease beyond a certain limit (as is done in this article). We chose to use an inclusion-based cement cracking model instead because this is the approach followed by Fortin et al. (2007) in their pore collapse laboratory study. This experiment and their model estimations (Figure 1) were the best comparison example we could find in the literature for the pressure decrease rock damage process studied in this article.
4 Conclusions
The pore collapse phenomenon may occur in depleted reservoirs, and it is difficult to assess its occurrence. 4D seismic data can provide information that helps in characterizing this phenomenon in reservoir rocks. In some specific cases, rock damage may lead to observable 4D seismic softening signals. We presented the Snorre example, where rock damage is likely the best hypothesis to explain the full character of the observed softening signal.
4.1 Data Interpretation
A multidisciplinary analysis was needed to interpret all possible explanations for the signal in terms of its magnitude, lateral and vertical extents and its temporal evolution and reach a reliable conclusion. For this analysis, we integrate information from petrological studies and stress sensitivity experiments on reservoir core samples, well log and production data, as well as reservoir simulation and 4D seismic data. We show that some anomalies can be partly explained by gas saturation increase processes, but these hypotheses fail to explain the full dynamic behaviour of the anomalies. The main characteristics that saturation changes fail to explain are the vertically homogenous magnitudes across a 200-m oil column and the temporal irreversibility with pressure recovery. The rock damage hypothesis explains these and all other characteristics and agrees with all analysed multidisciplinary data. Reservoir rock damage is an unusual explanation for these signals; however, it may be more common than it seems. We do expect more examples of this phenomenon may come to light as awareness is raised for this possibility.
4.2 Rock Physics Modelling
To further validate the proposed rock damage hypothesis, we conduct a theoretical rock physics study. Using a grain crushing model, we estimate that the effective pressures achieved in Snorre are enough to crush grains in the Statfjord sandstone but not in the upper Lunde sandstone. Laboratory experiments indicate that velocity decrease begins prior to rock compaction, at lower effective pressures. This indicates that rock damage processes milder than grain crushing, such as cement cracking, may have a role in this initial velocity decrease. To assess the magnitude of velocity variations that this mild rock damage process can induce, we conduct a petro-elastic modelling study using a crack inclusion PEM. This shows that to produce the velocity decrease observed on the 4D seismic data would require around one-third of the crack creation that was observed in an extensive grain crushing experiment. With this we argue that small damage to rocks, related to cracking and crumbling of cements and crushing of weak dissolved grains, could be enough to produce observable softening anomalies. These micromechanics processes occur at lower effective pressures, so they could be achieved more commonly during reservoir production.
4.3 Implications for CO2 Storage
One important observation is that, when pore collapse occurs, it increases the rock stress sensitivity substantially. Hence, subsequent pore pressure increases will lead to softening signals more intense than what may be expected from elastic domain stress sensitivity studies. This raises an important warning sign for plans of CO2 storage into depleted reservoirs, as the occurrence of pore collapse during reservoir production phase would hinder considerably the monitorability of the CO2 plume as injection raises reservoir pore pressure gradually.
Acknowledgements
We thank Equinor ASA and partners Petoro AS, Vår Energi ASA, INPEX Idemitsu Norge AS and Harbour Energy Norge AS for data donation and publication approval, and the sponsors of the Edinburgh Time-Lapse Project, Phase VIII (ADNOC, AkerBP, BHP, BP, CNOOC, ConocoPhillips, ENI, Equinor, ExxonMobil, Harbour Energy, Neptune, Petoro, Petrobras, Sharp Reflections, Shell, Taqa, Tullow and Woodside). For insightful discussions, we thank Anne-Kari Furre, Nicholas McArdle, Kristian Stormark, Vincent Wagner, Jorg Herwanger, Euripides Papamichos, Elma Charalampidou and Hamed Heidari.
APPENDIX A: Critical Pressure Analysis
| Sandstone | Porosity | Mean grain radius | Maximum grain radius |
|---|---|---|---|
| Statfjord | 20 | 0.95 | 5.15 |
| Statfjord | 18.7 | 0.75 | 3.65 |
| Statfjord | 20 | 0.6 | 3.4 |
| Statfjord | 17.3 | 0.65 | 4.65 |
| Statfjord | 22.3 | 1 | 3.2 |
| Lunde | 18.7 | 0.31 | 1.52 |
| Lunde | 21 | 0.27 | 1.23 |
| Lunde | 20 | 0.25 | 1.68 |
| Lunde | 25.3 | 0.25 | 0.79 |
| Lunde | 15 | 0.35 | 0.86 |
| Lunde | 15 | 0.35 | 1.1 |
| Lunde | 11.3 | 0.35 | 1 |
| Lunde | 11.7 | 0.34 | 0.85 |
| Lunde | 10.7 | 0.23 | 0.74 |
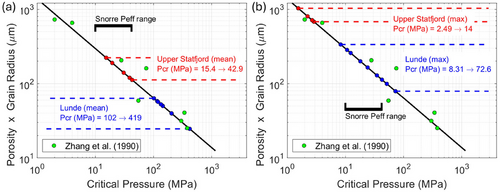
This analysis shows that Statfjord rocks are likely prone to grain crushing in the Snorre production effective pressure range, but Lunde rocks should require higher effective pressures. However, this type of analysis serves only as an initial reference point, and it may be misleading. It only estimates critical pressures if the Lunde sandstones were fully made of uncemented quartz grains. Laboratory experiments on different rocks with similar porosity and grain sizes have shown that critical pressures vary wildly (13–496 MPa) depending also on rock mineralogy, clay content, grain shapes, cementation levels and lithification processes (Tembe et al. 2008). For example, the weaker, partly dissolved feldspar grains observed in the Lunde samples should crack at much lower effective pressures than the more abundant quartz grains. This indicates that pore collapse cannot be precisely modelled by grain crushing processes alone. Other processes such as cement cracking and crumbling and contact sliding and cracking of weaker grain types or forms have an important impact on pore collapse activation pressures. Cement and grain contacts are weaker than the grains themselves and should begin cracking at lower effective pressures than those that are needed to crush the grains. Many other more complex analytical and numerical models for estimating critical pressure are available in the literature (Li and Holt 2004; Zhu et al. 2010; Nicolas et al. 2017; Sun et al. 2020); however, given the uncertainties related to these estimations, we chose to follow a multidisciplinary 4D seismic data interpretation approach to provide evidence of pore collapse.
Another aspect of reservoir compaction that has a considerable impact on pore collapse onset pressures is the stress path. Fortin et al. (2005) conduct tri-axial laboratory experiments that show critical pressures varying from 59 to 106 MPa in different samples of the same sandstone that are compressed with different lateral confining stress (50 and 110 MPa, respectively). Generally, reservoirs are assumed to follow a uniaxial compression stress path upon pore pressure decrease (Scott 2007). Papamichos et al. (1993) develop a theoretical model to estimate critical pressures for uniaxial compression and show that these must be considerably lower than for hydrostatic compression. Hence, uniaxial compression laboratory experiments would be ideal for estimating critical pressures at reservoir conditions experimentally. However, reservoir stress path is uncertain and might not be exactly uniaxial. Its estimation requires detailed, full-scale geo-mechanical modelling. Furthermore, laboratory estimations of critical pressure are likely biased to higher values than those that occur in reservoir conditions. That is because, as rock core samples are extracted from the subsurface, they go through unloading processes that lead to cracking and crumbling of the weakest cement and contact links (Alvarado et al. 2012; Vajdova et al. 2012; Tengattini et al. 2014).
Hence, estimating critical pressure for the onset of pore collapse at reservoir conditions, be it theoretically or experimentally, is a very uncertain process. Given this large uncertainty in a priori estimations, instead of relying on them, studies in compacting reservoirs tend to use geo-mechanical models to calibrate the critical pressure value numerically by matching geo-mechanical model outputs to 4D seismic overburden time-shift data (Vejbæk et al. 2014) or well production data (Sun et al. 2020). For the Sim2Seis modelling shown in previous figures, we follow a similar approach. Instead of estimating critical pressure theoretically or experimentally, we use an in situ calibration of this value to match the 4D seismic signal modelled with Sim2Seis to the observed data.
APPENDIX B: Rock Damage Modelling With a Stress-Sensitive Inclusion Model
So we replace the unknown parameter by the well log–calibrated parameter . Then we calibrate parameters and , to match the laboratory stress sensitivity data. With this our stress sensitivity model is jointly calibrated to both well log and laboratory stress sensitivity data.
Open Research
Data Availability Statement
The data that support the findings of this study are available from the corresponding author upon reasonable request.


