Analysing two-dimensional effects in central loop transient electromagnetic sounding data using a semi-synthetic tipper approach
ABSTRACT
We present a simple and feasible approach to analyse and identify two-dimensional effects in central loop transient electromagnetic sounding data and the correspondingly derived quasi two-dimensional conductivity models. The proposed strategy is particularly useful in minimising interpretation errors. It is based on the calculation of a semi-synthetic transient electromagnetic tipper at each sounding and for each observational transient time point. The semi-synthetic transient electromagnetic tipper is derived from the measured vertical component of the induced voltage and the synthetically calculated horizontal component. The approach is computationally inexpensive and involves one two-dimensional forward calculation of an obtained quasi two-dimensional conductivity section. Based on a synthetic example, we demonstrate that the transient electromagnetic tipper approach is applicable in identifying which transient data points and which corresponding zones in a derived quasi two-dimensional subsurface model are affected by two-dimensional inhomogeneities. The one-dimensional inversion of such data leads to false models. An application of the semi-synthetic transient electromagnetic tipper to field data from the Azraq basin in Jordan reveals that, in total, eight of 80 investigated soundings are affected by two-dimensional structures although the field data can be fitted optimally using one-dimensional inversion techniques. The largest semi-synthetic tipper response occurs in a 300 m-wide region around a strong lateral resistivity contrast. The approach is useful for analysing structural features in derived quasi two-dimensional sections and for qualitatively investigating how these features affect the transient response. To avoid misinterpretation, these identified zones corresponding to large tipper values are excluded from the interpretation of a quasi two-dimensional conductivity model. Based on the semi-synthetic study, we also demonstrate that a quantitative interpretation of the horizontal voltage response (e.g. by inversion) is usually not feasible as it requires the exact sensor position to be known. Although a tipper derived purely from field data is useful as a qualitative tool for identifying two-dimensional distortion effects, it is only feasible if the sensor setup is sufficiently accurate. Our proposed semi-synthetic transient electromagnetic tipper approach is particularly feasible as an a posteriori approach if no horizontal components are recorded or if the sensor setup in the field is not sufficiently accurate.
1 INTRODUCTION
The transient electromagnetic (TEM) method using a loop source has an outstanding depth-to-lateral investigation ratio, and the generated current systems are prevalently focused under the transmitter loop (Spies and Frischknecht 1991). Hence, it is widely used for the investigation of essentially one-dimensional (1D) structures such as shallow sedimentary basins and valley structures (Jørgensen, Sandersen and Auken 2003; Danielsen et al. 2003; Yogeshwar, Tezkan and Haroon 2013; Yogeshwar and Tezkan 2017). Moreover, the TEM method is widely used for groundwater studies and aquifer characterisation, for example, contamination and salinisation problems (Fitterman and Stewart 1986; Goldman and Neubauer 1994; Tezkan 1999). Fundamental overviews of the TEM method are given in Nabighian and Macnae (1991) and Spies and Frischknecht (1991) and in several comprehensive reviews related to near-surface applications of electromagnetic techniques (e.g. Pellerin 2002; Auken et al. 2006; Everett 2011).
As stated by Goldman, Tabarovskyt and Rabinovich (1994), the conventional 1D interpretation of TEM data by 1D layered earth models has proved feasibility in numerous case studies. Therefore, TEM data are often interpreted by 1D inversion or quasi two-dimensional (2D)/three-dimensional (3D) schemes using laterally and/or spatially constraints to link models together (cf. Auken and Christensen 2004; Viezzoli et al. 2008). These conventional and basically 1D techniques are applied in most cases, because the availability of stable 2D/3D inversion algorithms for TEM data is limited. Furthermore, 2D/3D inversion algorithms require comparably large computational resources. Often, quasi 2D models are presented by stitching 1D models together along the profile line. However, there are cases where distortion effects have to be considered and the field data should be explained neither by 1D models nor by quasi 2D/3D schemes (Newman, Anderson and Hohmann 1987; Goldman et al. 1994). If no clear distortion effects are visible in the transients (e.g. sign reversals), the 1D inversion is usually possible and 2D effects can easily be overlooked. Nevertheless, in such cases, a 1D interpretation can lead to significant and severe misinterpretations. To avoid misinterpretation, it is of interest to identify structural features in derived quasi 2D sections that may be caused by 2D affected data. Some authors used horizontal magnetic field components to investigate multidimensional structures. For example, Newman et al. (1987) described the behaviour of the horizontal magnetic field over 3D conductors. On the basis of a 3D synthetic geothermal model, they showed that the horizontal magnetic field component may be utilised to identify the flanks of a buried anomaly. Spies and Frischknecht (1991) utilised the same model to illustrate the benefit of the TEM tipper. Koch et al. (2003) and Rödder and Tezkan (2013) applied a three-component receiver setup to investigate structural features on the Araba fault in southeast Jordan.
In this paper, we present a simple and feasible approach to analyse and identify 2D effects in central loop TEM sounding data and the corresponding derived quasi 2D models. The proposed strategy is particularly useful in minimising interpretation errors. It is based on the calculation of a semi-synthetic TEM tipper along an investigated profile line. The tipper is calculated at each sounding location and for each observational transient time point. The suggested semi-synthetic TEM tipper is derived from the measured vertical component of the induced voltage  and the synthetically calculated horizontal component
  using a 2D forward calculation of 1D stitched models (quasi 2D models). The approach is computationally inexpensive and involves one 2D forward calculation of an obtained quasi 2D section (for each sounding to be investigated with the tipper approach). The numerical modelling is carried out with a well-known time-domain electromagnetic finite-difference algorithm (Druskin and Knizhnermann 1988, 1994, 1999). The algorithm uses a Krylov subspace projection technique and allows for arbitrary model discretisation in three dimensions.
Based on a synthetic example, we first demonstrate that the TEM-tipper approach is applicable in identifying which transient data points and which corresponding sounding locations in a derived quasi 2D subsurface model are affected by 2D inhomogeneities. Moreover, we show that the 1D inversion of 2D affected data leads to false models.
In the second step, we present an application to field data from the Azraq basin in Jordan. Although no clear distortion effects are visible in the data and it can be fitted optimally using 1D inversion techniques, the subsurface resistivity varies significantly along the profile line. Therefore, it is questionable if the 1D interpretation is adequate. Using the TEM-tipper approach, we are able to identify soundings that are affected by 2D distortion. To avoid misinterpretation, the correspondingly identified zones are then excluded from the interpretation of a derived quasi 2D model. Based on the semi-synthetic study, we also demonstrate that a quantitative interpretation of the horizontal voltage response (e.g. by inversion) is usually not feasible as it requires the exact sensor position to be known (Newman et al. 1987). Although a tipper derived purely from field data is useful as a qualitative tool for identifying 2D distortion effects, it is only feasible if the sensor setup is sufficiently accurate. Our proposed semi-synthetic TEM-tipper approach is particularly feasible as an a posteriori approach if no horizontal components are recorded or if the sensor setup in the field is not sufficiently accurate.
2 IMAGING TWO-DIMENSIONAL DISTORTION EFFECTS
For one-dimensional (1D) conductivity distributions, the induced currents flow in subsurface horizontal planes, and the electric field is purely toroidal. Hence, in the centre of a square transmitter loop, only a vertical component of the induced voltage exists due to a temporal alteration of the magnetic flux density. The diffusion process is illustrated in Fig. 1 as contour lines of the induced electric field  at distinct transient times
  μs and 10 μs after current switch-off in the transmitter. The conductivity model is two-dimensional (2D) with a vertical boundary at profile metre
  m (cf. Fig. 1). Likewise to the smoke-ring concept of Nabighian (1979), the maximum of the electric field diffuses downwards and outwards from the transmitter and follows roughly the red dashed line with a 30° slope. Depending on the transient time, the maximum of
  prevalently diffuses outwards and resides in the good conductive layer before it penetrates the resistor at depth. As the electromagnetic fields diffuse faster in a resistive environment and are decelerated in a conductor, lateral subsurface variations cause the electromagnetic field to become distorted. Therefore, the symmetry with respect to the transmitter is lost. Both toroidal and poloidal electric fields are generated, leading to a horizontal component of the induced voltage in the centre of the transmitter loop. In the case of the 2D distorted current system in Fig. 1, induced voltages of both the vertical and horizontal components of the magnetic field (
 and
and  ) are generated in the centre. Amongst others, Spies and Frischknecht (1991) suggested that the ratio of the weak component
  and the strong component
  may be used to analyse whether the subsurface is non 1D in the vicinity of a sounding. The ratio is referred to as the TEM tipper in accordance with the well-known tipper transfer function used in magnetotelluric or very low frequency methods (Vozoff 1991).
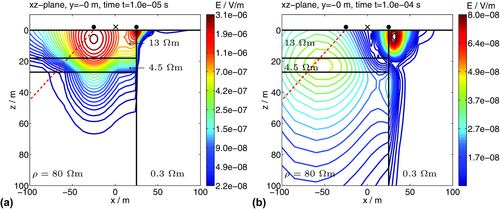
 at two distinct transient times after current switch-off in a 50 m × 50 m transmitter loop. The plane of view is an
  -slice at
  m through the centre of the transmitter. The transmitter is located at
  m at the vertical boundary. The transmitter edge positions are marked by black circles and the central loop receiver position by a cross. The model boundaries are denoted by black solid lines. The red dashed line is drawn at an angle of 30° and marks the approximate diffusion angle of the maximum of the electric field in a homogeneous half-space.
In order to identify which sounding locations and transient times are affected by 2D lateral inhomogeneities, two approaches are used. The first approach is commonly used for detectability studies or for the identification of multidimensional effects in synthetic data. Consider the exemplary 2D model depicted in Fig. 2 for the following steps. The illustrated 2D model is a simplification of a derived subsurface resistivity-depth section from data recorded in the central Azraq basin area (cf. Yogeshwar et al. 2013; Yogeshwar and Tezkan 2017).

 at each sounding. A three-layer 1D background model response is calculated left of the vertical boundary. Right of the boundary, the 0.3Ωm homogeneous half-space response is calculated. (2) Calculate the 2D response
  at each sounding location. (3) Calculate the error-weighted relative difference of the 2D response and the 1D background response for each sounding and transient time point:
 (1)
(1) is the error used for the synthetic 2D data. A relative percentage error of 2% is assumed for the synthetic 2D data. Hence, the absolute error in equation 1 reads
  . The error floor of 2% is meaningful and in accordance with the typical field data errors in Azraq (Yogeshwar et al. 2013). Absolute values of
  indicate that the 1D response
  does not fit the 2D response
  within the error bounds and the 2D effect is significant. Absolute values of
  indicate that the difference between the 1D and 2D responses is less than the assumed error bound and a 2D distortion effect is negligible. If
  , both responses are similar. Note that the value of
  depends on the assumed error. Hence, approach A is used mainly for comparison and to verify the tipper approach. The data fit χ is derived by calculating the root mean square of
  (usually at each sounding location):
 (2)
(2) denotes an optimal fit,
  denotes a poor fit, and
  denotes over-fitted data.
 and horizontal induced voltage response
  at each sounding location. (2) Calculate the TEM tipper:
 (3)
(3)According to Spies and Frischknecht (1991), the 1D interpretation is generally valid for tipper values  .
.  is zero for all transient times over a 1D earth and at the centre of the transmitter. If
  , the horizontal is equal to the vertical induced voltage response in magnitude. For field data, the measured vertical voltage response
  is used instead of the synthetic 2D response
  . Based on the synthetic model, we verify approach B using the result obtained with approach A. Approach B is then applied to the field data in a second step.
Note that the induced voltage  is given in units of V/Am2 (normalised to receiver area and transmitter current). For readability, we use the abbreviations vertical voltage response
  and horizontal voltage response
  , respectively. Moreover, 1D synthetic responses are marked by a hat and 2D synthetic response by a tilde, whereas measured data are unmarked (e.g.
  ,
,  , and
, and  ).
).
3 TIPPER APPLICATION TO SYNTHETIC DATA
The model displayed in Fig. 2 is similar to that in Fig. 1, except that the horizontal and vertical axis ranges are adjusted for consistency with the field survey layout in Azraq/Jordan (cf. Yogeshwar et al. 2013). The inter-station distance is 50 m, and the vertical boundary is located at profile metre  m (sounding A41).
The upper panel in Fig. 3 displays the 1D and 2D vertical voltage responses ( and
and  ) and the synthetic horizontal response
  for three exemplary soundings. For soundings A37 and A40 left of the boundary, the induced voltage increases at intermediate to late times. Depending on the lateral distance to the boundary, the difference between the 1D and 2D responses exceeds approximately one order of magnitude. The misfit is displayed in the middle panel of Fig. 3. Absolute values of
  indicate that the 1D response
  does not fit the 2D response
  within the assumed 2% error bounds. Therefore, the 2D effect is significant. The calculated fit
  increases significantly at approximately 0.2 ms for sounding A40 at a distance of 75 m from the boundary (cf. middle panel in Fig. 3(a) and (b)). In contrast to that, the 2D effect is completely negligible for sounding A43 at a distance of 75 m on the right side of the boundary. Hence, there is only a marginal difference between the 1D and 2D responses visible, and the error-weighted relative difference
  is below 1 throughout the complete transient time range (cf. middle panel in Fig. 3(c)).
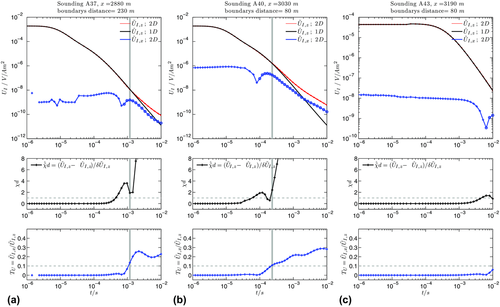
 and
and  ) and horizontal voltage response
  at the centre of a Tx-50 transmitter loop (for soundings A37, A40, and A43). The middle panel displays the error-weighted difference
  and the lower panel the tipper-response
  . The horizontal grey dashed line marks
  and
and  , respectively. The vertical grey line marks the time t where
  .
.Compared to the vertical voltage responses ( and
and  ), the horizontal voltage response
  is usually several orders of magnitude weaker. Both the horizontal and the vertical voltage response become comparable in magnitude depending on the distance from the vertical boundary, the subsurface conductivity, and the transient time. This leads to tipper values exceeding a value of
  at approximately 1 and 0.2 ms for soundings A37 and A40, respectively (cf. lower panel in Fig. 3(a) and (b)). The small oscillations in the horizontal voltage response at early times for sounding A37 are considered as numerical noise. Due to the high conductivity, sounding A43 right of the vertical boundary does not show any significantly increased tipper values throughout the complete transient time range. The comparability of the middle and the lower panel in Fig. 3 validates the TEM-tipper approach as an indicator for imaging 2D distorted data. The values of
  increase significantly at the approximate same transient times as
  exceeds a value of
  . Therefore, the threshold of
  suggested by Spies and Frischknecht (1991) is reasonable.
In order to visualise which soundings and corresponding time ranges are affected by 2D distortion, the calculated misfit  and tipper response
  are depicted as colour-coded sections in Fig. 4. The red dashed isoline in Fig. 4(a) marks
  . Below the line, 2D effects are significant, whereas above they are not. At sounding A41 directly on the vertical boundary, the response is significantly affected throughout the complete transient time range, whereas left of sounding A37, only the last transient times are affected (with
  ). In contrast to that, the 2D effect is completely negligible from sounding A42 onwards on the right-hand side of the boundary. Likewise to the misfit section, the calculated tipper response is consistent along the profile line. The strongest tipper response occurs directly at the location of the vertical boundary (ratios with
  are coloured dark red). The similarity of the TEM-tipper response to the error-weighted difference pseudosection displayed in Fig. 4(a) is obvious. The same number of soundings indicate to be 2D affected with tipper values
  . The red solid isoline with
  matches the red dashed isoline with
  well (cf. in Fig. 4(b)). Considering only the latest transient time
  of the field data (marked by a grey solid line), four soundings (namely, A38–A41) until approximately 200 m in distance from the boundary would be affected by 2D distortion. These soundings should be excluded from the interpretation of the quasi 2D model as the derived structure in the corresponding zone may not be reliable. In Fig. 4(c), the tipper
  is plotted for three distinct time points along the profile line. The vertical boundary is pin-pointed by a large tipper value with
  for
for  s.
s.
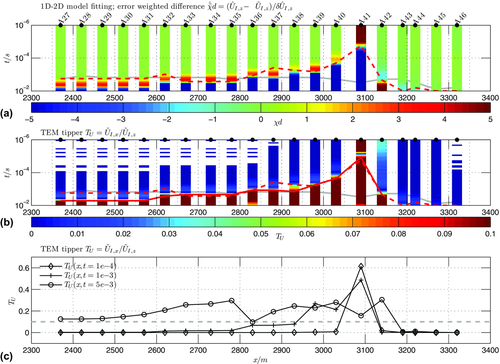
 ) and 1D background model response (
 ) using equation 1. (b) Synthetic TEM tipper
  . The solid grey line marks the last observed transient time
  in the field. The red solid isoline marks the transient time t where
  , and the red dashed line marks the
  isoline. (c)
  for three distinct transient times (the grey dashed line marks
  ).
).4 ONE-DIMENSIONAL INVERSION OF SYNTHETIC 2D DATA
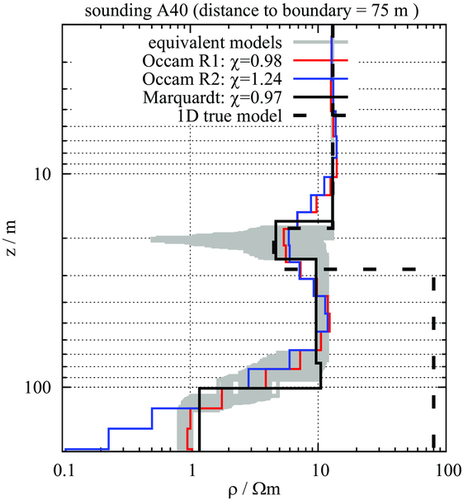
As shown in Fig. 3, the difference between the one-dimensional and two-dimensional responses exceeds approximately one order of magnitude at later times depending on the lateral distance to the boundary. Such an increase in the vertical voltage response  due to a conductor placed at the side of a sounding will consequently lead to a false conductivity model if a 1D interpretation scheme is applied. An exemplary inversion result for sounding A40 at a distance of 75 m left of vertical boundary is depicted in Fig. 5. We performed a Marquardt inversion using a starting model with five layers of 10 Ωm and also calculated corresponding equivalent models. To circumvent the dependency on the starting model, a smooth model inversion with first-order (Occam R1) and second-order roughness constraint (Occam R2) was used (Yogeshwar et al. 2013; Constable, Parker and Constable 1987). Although the 2D distortion effect is significant, the data can be fitted perfectly with
  using the 1D inversion schemes. All applied inversion techniques lead to well comparable but false models. The top two layers are reproduced rather well, whereas the 80-Ωm base layer is reconstructed with a far too low resistivity of
  Ωm. Moreover, at a depth larger than approximately 80 m, a good conductive layer with a resistivity of approximately
  Ωm appears. Conclusively, the structure deeper than approximately 30 m is not reproduced correctly. Depending on the distance from the boundary, a similar but with distance decreasing effect will be observed for the other soundings.
5 TIPPER APPLICATION TO FIELD DATA
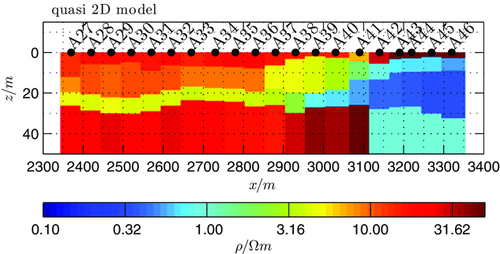
The quasi two-dimensional (2D) model displayed in Fig. 6 is constructed by stitching together one-dimensional (1D) Marquardt inversion results along the profile line. The central loop TEM data were recorded in Azraq/Jordan to investigate the thickness of sedimentary deposits (cf. Yogeshwar et al. 2013; Yogeshwar and Tezkan 2017). The obtained model is rather smooth and consistent along the profile line. A strong lateral resistivity variation occurs between soundings A37 and A42. Right of sounding A42, the resistivity decreases to approximately 0.3 Ωm. Therefore, it was questionable if the 1D interpretation of the data is adequate regarding the occurring lateral resistivity variations. Although the horizontal voltage response was not measured during the field survey in Azraq/Jordan, the TEM tipper is used in a semi-synthetic a posteriori approach to qualitatively investigate which zones of the derived quasi 2D model data distortion has to be considered. We refer to the approach as semi-synthetic because the TEM tipper is derived from the synthetically calculated 2D horizontal voltage response  and from the measured vertical induced voltage
  .
.
The upper panel in Fig. 7 displays the field data  , the synthetic horizontal
  , and the synthetic vertical 1D and 2D responses (
 and
and  ) for three exemplary soundings (A37, A40, and A43). The data are fitted optimally by 1D inversion models for all three sounding locations (cf. dashed black line in the middle panel of Fig. 7). In contrast to that, the 2D fit
  is deteriorated compared to the optimal 1D fit
  . Particularly, sounding A37 indicates a deteriorated 2D fit at late transient stages. The lower panel in Fig. 7 displays the calculated semi-synthetic TEM-tipper response. The transient time where the tipper response increases coincides well with the deteriorated 2D fit
  for sounding A37. A similar and comparable behaviour between the tipper and the 2D fit is not visible for exemplary sounding A40, which indicates a deteriorated 2D fit already at early transient stages. Sounding A43 on the good conductive formation does neither indicate an increased tipper response nor a deteriorated 2D fit. Hence, the structure is essentially 1D with respect to the sensed induction volume in the subsurface below that sounding. The optimal 1D data fit does not imply that the 1D interpretation by layered earth models is correct (cf. exemplary 1D inversion of synthetic 2D data in Fig. 5). On the contrary, as the 1D data are fitted optimally, it is meaningful that the 2D response of the quasi 2D model (
 ) does not fit the field data
  optimally. This is especially the case for soundings that are fitted optimally by 1D inversion models but are affected by 2D inhomogeneities. For essentially 1D structures, the data should be fitted similar.
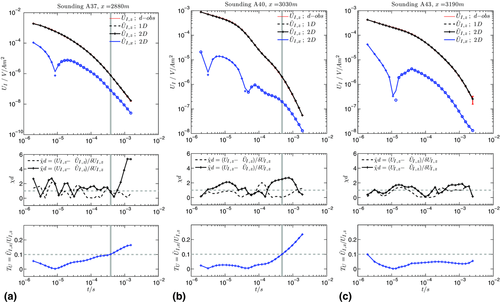
 , synthetic 1D and 2D vertical voltage responses (
 and
and  ), and horizontal voltage response
  at the centre of the Tx-50 transmitter loop (for soundings A37, A40, and A43). The vertical responses usually match well and are visually not distinguishable in the upper panel. The middle panel displays the error-weighted difference that is calculated using either the 1D or the 2D model response. The lower panel displays the tipper-response
  . The horizontal grey dashed line in the middle and lower panels marks
  and
and  , respectively. The vertical grey line marks the transient time t where
  .
.To simultaneously visualise the 1D data fit for all soundings, it is displayed as an error-weighted difference  pseudosection in Fig. 8(b). The fit is almost optimal with
  for all sounding locations. A systematically and time-dependent deteriorated misfit that correlates with the subsurface structure of the quasi 2D model is not evident (cf. 1D misfit pseudosection in Fig. 8(b) and dashed black line in Fig. 8(e)). In contrast to that, the 2D misfit pseudosection in Fig. 8(c) indicates a deteriorated fit for most data points. Peculiar is the reduced fit of a few soundings between A34 and A42 (cf. solid crossed line in Fig. 8(e)). This may be associated with a 2D distortion effect but a consistent correlation with the subsurface is not obvious. Particularly, a systematically deteriorated 2D fit at late transient stages is not evident in Fig. 8(c). For completeness and consistency with the synthetic modelling study (cf. Fig. 4(a)), the error-weighted difference
  of the synthetic 1D and 2D model responses for each sounding is displayed in Fig. 8(d). (As for the synthetic study, we assume a percentage error of 2% for the synthetic 2D data.) Likewise to the result in Fig. 8(c), a direct connection of the misfit with the subsurface is ambiguous.
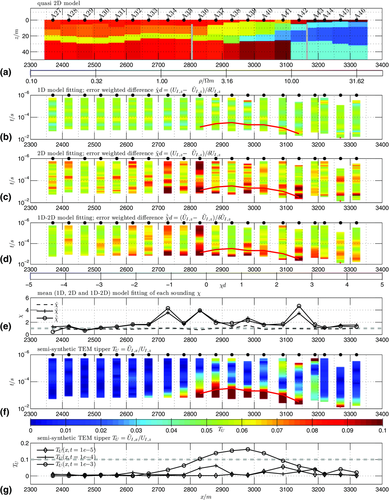
 ) calculated from the field data
  and the 1D model response
  . (c) 2D model fit (
 ) calculated from the field data
  and the 2D model response
  . (d) 1D/2D model fit (
 ) calculated from the 1D model response
  and the 2D model response
  . (e) χ at each sounding location along the profile line by calculating either the mean of
  ,
,  or
or  . The red solid isoline marks the transient time t at which
  . (f) Colour-coded semi-synthetic TEM tipper section
  . (g)
. (g)  plotted for three distinct times along the profile line (the grey dashed line marks
  ).
).The semi-synthetic TEM tipper  is displayed in Fig. 8(f) as a colour-coded section. The tipper response
  is meaningful and consistent with respect to the profile metre and transient time. The tipper response exceeds
  between soundings A36 and A42 at intermediate to late transient times. In this 300m-wide zone, the lateral resistivity variation of the model is maximal. Due to the large tipper values, the 1D interpretation in this zone is uncertain (marked by vertical grey lines in Fig. 8(a)). The stitched 1D inversion result of these data may lead to a false interpretation because the subsurface structure is not reconstructed correctly (cf. also with Fig. 5). Likewise to the synthetic study discussed in Fig. 5, the deeper structure of the model corresponding to 2D affected data is not reliable. However, without applying a 2D inversion scheme, the interpretation is uncertain.
Sounding A37 coincides with the shallow inset of the good conductive structure. Compared to the neighbouring soundings, the tipper value is increased already at earlier times for that sounding, and the 2D effect is obviously maximal (cf. Fig. 8(f) and (g)). The red solid isoline in Fig. 8(f) marks values with  . Hence, the transient data corresponding to the area below the isoline are apparently distorted by 2D effects. The transient times with increased tipper values coincide partly with the larger misfit values of the pseudosection displayed in Fig. 8(c). However, the larger TEM-tipper responses are not consistently linked to larger residuals as visible for the three exemplary soundings shown in Fig. 7.
The inconsistency of the error-weighted difference along the profile line demonstrates the drawback of subtracting a 1D background model response  from the 2D model response
  in order to identify distortion effects in central loop TEM data. The parts occurring from the strong layered earth response and the usually much weaker 2D response are both superimposed in the vertical voltage response
  . For realistic 2D models (as shown in Fig. 8(a)) where the subsurface structure is prevalently heterogeneous, it is difficult to directly link structural features to the calculated misfit. Therefore, we suggest the semi-synthetic TEM-tipper approach as an a posteriori tool for qualitatively analysing structural features, particularly if measured horizontal components are not available. The non-zero horizontal voltage response in the centre of the transmitter loop is a pure 2D response and, thus, useful. Moreover, the obtained semi-synthetic tipper results are consistent, and it is rather straightforward to identify distortion effects in the field data as well as in the obtained model. To avoid misinterpretation, these identified zones should be excluded from the interpretation of the quasi 2D model.
6 EFFECT OF SENSOR POSITIONING
The accuracy requirements usually limit the feasibility of measuring and interpreting horizontal induced voltage components in central loop TEM applications quantitatively. Figure 9 displays the synthetic horizontal voltage response  for sensor misplacements
  for the one-dimensional (1D) case. We assume the 1D layered background model at sounding A40 in Fig. 8(a). For minor but realistic sensor misplacements of, e.g.
  m off centre of a 50 m × 50 m transmitter loop, the horizontal voltage response increases significantly in magnitude. Therefore, a quantitative interpretation (e.g. by inversion) of measured horizontal components is hardly possible if the exact sensor position is unknown. The lower panel in Fig. 9 displays the calculated tipper response
  . The tipper is below
  for misplacements less than
  m throughout the complete time range. Moreover, it is obvious that the early times are more affected by changes in the positioning of the sensor than the late transient times. Note that the effect of sensor misplacement is marginal for the vertical component
  and, thus, neglected.
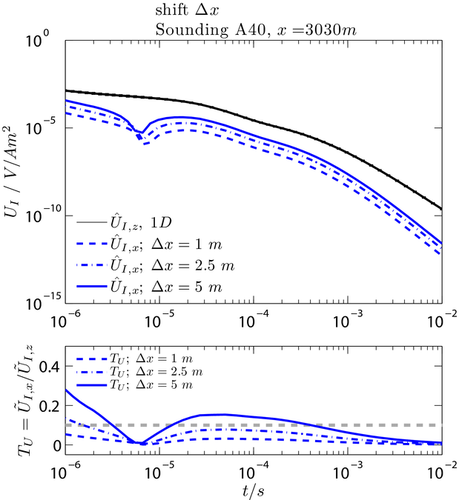
 and 1D horizontal voltage response
  for different offsets
  from the centre of a Tx-50 transmitter loop. The 1D background model for sounding A40 was assumed for the calculation (cf. Fig. 8(a)). The lower panel displays the calculated tipper response
  for the different shift values. The horizontal grey dashed line marks
  .
.Figure 10 displays the effect of different sensor misplacements  , horizontal sensor tilt β, and vertical sensor tilt α on the horizontal voltage and the tipper response assuming the quasi two-dimensional (2D) model in Fig. 8(a). The analyses are performed for sounding A40 in Fig. 8(a).
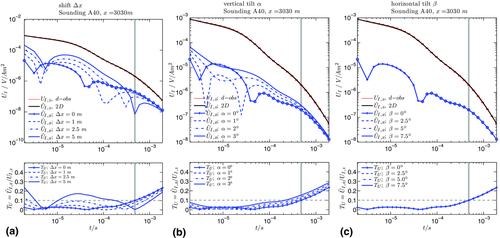
 and synthetic 2D vertical voltage response
  are displayed in red and black, respectively. The vertical responses usually match well and are visually not distinguishable. The horizontal voltage response
  is displayed in (a) for different offsets
  from the centre of the Tx-50 transmitter loop. In (b),
  is displayed for a vertical tilt α (rotation around the y-axis). In (c),
  is shown for a horizontal tilt β (rotation around the z-axis). The lower panel displays the corresponding tipper-response
  . The horizontal grey dashed line marks
  . The vertical grey line marks the time t where
  (assuming that the shift
  and tilt
  are equal to zero).
For a sensor misplacement between  and 1 m off centre of the Tx-50 loop along the profile line, the tipper responses
  are consistent and possess a similar trend. For values larger than 2.5 m, the effect of misplacement is significant. The increased tipper response occurs at later times. Moreover, at early times,
  is affected by the sensor misplacement, whereas at late times, the strong tipper response is prevalently an effect of the 2D structure (cf. Fig. 10(a)).
 ), the voltage response
  for a vertically tilted sensor is given by
 (4)
(4) is affected significantly. The corresponding tipper response
  is shifted by a constant factor at late times according to the tilt value. Tilt values less than
  lead to a tipper response that is only slightly affected/shifted (cf. Fig. 10(b)). Note that a properly levelled sensor is usually tilted less than 1°. The response
  for a horizontal tilt (assuming a rotation β around the z-axis) is negligible as
  vanishes due to symmetry in the 2D case (assuming a y-oriented strike direction (cf. Fig. 10(c))). Furthermore, the effect of a slightly tilted sensor is marginal for the vertical component
  and, thus, not considered.
Based on the synthetic study in Fig. 10(a)–(c), we demonstrate that slight possible inaccuracies in the handling of the sensor (such as sensor misplacement and horizontal sensor tilt) limit the quantitative interpretation of horizontal component TEM data (e.g. by inversion). The exact sensor position needs to be known very precisely. However, the tipper approach remains feasible as a qualitative tool in investigating distortions caused by 2D conductivity structures assuming moderate inaccuracies in the positioning of the sensor. Therefore, central loop TEM measurements of the horizontal voltage component are qualitatively useful in characterising multidimensional effects, but the setup geometry needs to be sufficiently accurate. Nevertheless, the effect caused by an incorrect handling of the sensor also depends on the subsurface conductivity, and these handling inaccuracies usually occur randomly in the field. The requirements for using horizontal components impose strong constraints on a TEM field survey and may, for example, reduce survey speed significantly. For that reason, horizontal components are often not measured at all or not measured sufficiently accurate. In that case, 2D effects can be analysed meaningfully by applying the proposed semi-synthetic TEM-tipper approach as an a posteriori modelling tool.
7 CONCLUSIONS
We introduced a semi-synthetic TEM tipper that is calculated from the synthetic horizontal induced voltage response  and the measured vertical induced voltage response
  . Based on a synthetic two-dimensional (2D) model, we first verified that the suggested tipper approach is well applicable and clearly identifies 2D distorted sounding data and the corresponding zones in a derived quasi 2D model. In the second step, we applied the semi-synthetic TEM-tipper approach to a field data example from Azraq, Jordan. Although no clear distortion effects were visible in the measured TEM sounding data, the subsurface resistivity structure varies significantly along the profile line. Therefore, it was questionable if the one-dimensional (1D) interpretation of the data is adequate in the region where the subsurface conductivity varies significantly. The derived semi-synthetic tipper response
  for the field data case is meaningful and consistent with respect to the profile metre and the transient time. We identified, in total, seven soundings in a 350 m wide zone between soundings A36 and A42, which is apparently affected by a 2D distortion due to lateral inhomogeneities. Usually, the early transient times are not affected but the intermediate and late times are significantly affected. The 1D inversion results of these data are not trustworthy and may lead to a false interpretation because the structure is apparently not reproduced correctly. We identified this zone using the tipper approach to exclude it from further interpretation. Furthermore, we demonstrated that a quantitative interpretation of the horizontal voltage response (e.g. by inversion) requires the exact sensor position to be known. Nevertheless, an incorrect sensor setup in the field does not limit the feasibility of using the TEM tipper as a qualitative tool in identifying effects caused by lateral inhomogeneities if the setup geometry is sufficiently accurate. Therefore, central loop TEM measurements of the horizontal voltage component are qualitatively useful in characterising multidimensional effects. However, the requirements for using horizontal components impose strong constraints on a TEM field survey and may, for example, reduce survey speed significantly. If horizontal components are not measured (or the setup geometry is too inaccurate), 2D effects can only be analysed using an a posteriori approach. The proposed semi-synthetic TEM-tipper approach is particularly useful as an a posteriori tool in qualitatively analysing structural features in obtained quasi 2D models and in minimising interpretation errors without using measured horizontal voltage components.
ACKNOWLEDGEMENTS
The project is funded by the Deutsche Forschungsgemeinschaft (DFG, grant number SFB-806/1) and hosted in the frame of the CRC-806 Our Way to Europe, established at the Universities of Cologne, Bonn, and Aachen.


