Dynamic microplasticity manifestation in consolidated sandstone in the acoustical frequency range
ABSTRACT
Microplasticity manifestations caused by acoustic wave in the frequency range of about 4.5 kHz–7.0 kHz are detected in consolidated artificial sandstone. Equipment was tested by means of comparison of data obtained for a standard material (aluminium) and sandstone. Microplasticity manifestations in acoustic records are present in the form of ladder-like changes in the amplitude course. The stress plateaus in the acoustic trace interrupt the amplitude course, transform the wavefront, and shift the arrival time along the time axis. Microplasticity contribution to the acoustic record changes with the increase in the strain amplitude value. The combined elastic–microplastic process conditions the wavefront steepness and its duration. Stress plateaus exert influence on the waveform and, accordingly, on pulse frequency response. These results confirm the earlier data obtained for weakly consolidated rock. This contribution to wave propagation physics can be useful in solving applied problems in material science, seismic prospecting, diagnostics, etc.
1 INTRODUCTION
In-depth study of the wave attenuation mechanism is still an important task in seismology and seismic prospecting. The new knowledge on rock inelasticity can be very promising to this effect. The well-known standard linear solid viscoelastic model is insufficient for explaining, e.g., amplitude dependence of wave velocity and attenuation in seismic exploration and acoustics. However, amplitude effects can offer potential for solving dynamic problems, e.g., in applied seismology. To explain the amplitude-dependent effect, we do not exclude the existence of some additional attenuation mechanism in rocks along with the already known mechanisms. The experimental detection of rocks microplasticity (Mashinsky 1994; Mashinskii 2005b) and the intermittent microplasticity in diverse materials give grounds for this supposition (Nishino and Asano 1996; Golovin et al. 2004). Lately, some researches in this area have shown that there are effects that can be connected with unusual inelasticity type.
The brief history is as follows. For the first time, a new type of rock inelasticity termed “microplasticity” (by analogy with solid-state physics) has been detected in quasistatic experiments on various natural materials (sandstone, siltstone, mudstone, quartz, and others) (Mashinsky 1994; Mashinskii 2005b). Microplasticity data were received by means of direct and separate measurement of residual and reversible (elastic) strains during loading and unloading. In contrast with macroplasticity, microplasticity presents irregular “plasticity insets” within a conditionally elastic region in the stress–strain curve. Microplasticity in rocks can be regarded as the plasticity on a microscopic scale in localized areas in material, e.g., at grain boundaries, i.e., it can be determined as local or interruptible inelasticity. Microplasticity process interrupts the elastic process at short times both during loading and unloading. The microplastic deformation component (together with the elastic component) contributes to total deformation and in this way influences the behaviour of the stress–strain curve σ (ε). The microplasticity process, as distinct from macroplasticity, occurs in the range appreciably below the apparent elastic limit. Direct data on rock microplasticity represented a good prerequisite for detection of this effect in rocks under dynamic stress caused by seismic wave.
The presence of local inelasticity (in particular, rock microplasticity) offers a reasonable explanation of an unusual increase in wave velocity and decrease in attenuation with increasing amplitude detected in some experiments (Johnston and Toksoz 1980; Mashinskii, Koksharov, and Nefedkin 1999; Mashinskii 2004; Mashinskii 2007a, 2008, 2012a; Zaitsev, Nazarov, and Talanov 1999). The microplasticity mechanism does not refute the well-known mechanisms but expands availability of traditional models that show the opposite situation with amplitude dependence of seismic parameters: The wave velocity decreases, and the attenuation increases with increasing amplitude (Mavko 1979; Winkler, Nur, and Gladwin 1979; Tutuncu, Podio, and Sharma 1994; Ostrovsky and Johnston 2001). The experiments performed on various rock specimens show that due to microplasticity, the modulus can both decrease and increase in compliance with the σ (ε) curve (Mashinsky 1994; Mashinskii 2005b). This occurs since the microplasticity contribution to total deformation can both increase and decrease with increasing (or decreasing) stress.
The connection of σ(ε) curvature with the modulus behaviour is confirmed theoretically (McCall and Guyer 1994; Guyer, McCall, and Boitnott 1995; Guyer and Johnson 1999). In the subsequent laboratory experiments, the wave velocity increase with increasing amplitude was detected in dolomites (Mashinskii and D'yakov 1999; Mashinskii 2004). This result was also confirmed by in situ observations (Mashinskii et al. 1999; Zaitsev et al. 1999; Mashinskii 2007b). A significant wave attenuation decrease induced by the amplitude increase in the μ-strain range was detected in sandstone and smoky quartz under confining pressure of 20 MPa (Mashinskii 2005a). The laboratory investigations performed on the dry and saturated sandstone under confining pressure showed that attenuation, in comparison with velocity, is more sensitive to the strain–amplitude variations (Mashinskii 2006, 2007a). These facts, although indirectly, confirm potential participation of microplasticity in the wave propagation process. Dynamic microplasticity in geologic materials is as yet little studied. This study goes on both in the experimental and theoretical plan (Mashinskii 2008; 2010; 2012b; 2014; Yarushina and Podladchikov 2008; 2010).
It is important to note that microplasticity in different solid states is well known (Nishino and Asano 1996; Golovin et al. 2004). The mechanism of action is explained by that defects or dislocations move in the lattice and act as carriers of slip in response to the applied stress. Modern data show that the stress–strain curve is composed of small jumps and plateaus that interrupt the “normal” stress course. This cannot be accounted for within the framework of continuous theories, and the whole process is governed by the intermittent avalanches in the material. An initial small strain burst and plateaus can be seen in the stress–strain curves (Zhou, Biner, and LeSar 2010). The absolute strain values are within nanometres in this case. Modern theories give a homogenized description of dislocation motion on the micro-scale (Berdichevsky 2005). There are models that provide a direct and quantitative link between the acoustic nonlinearity parameter and the cumulative plastic strain in the loaded specimen (Kim et al. 2006). The present model considers the contribution of the residual microplasticity only. An advantage of such models is that they are formulated in terms of cumulative plastic strain rather than dislocation density. It is also important to note that acoustic nonlinearity can be caused by a number of different sources.
The microplastic regime of a stress–strain curve is well studied using a simplified micro-structural model that explains the strain burst and avalanche phenomenon (Derlet and Maaf 2013). The parameters of this model, along with the mobile dislocation density, admit a diversity of microplastic behaviour involving intermittent plasticity in the avalanche-like process. Stress plateaus indicating strain burst activity are clearly visible in the stress–strain curves. The intermittent stress plateaus are separated by continuous elastic regions that are approximately linear. This is the microplastic regime of deformation.
The plateaus in the stress–strain curve have been detected in diverse solid states. These are identified as “pop-in” and “pop-out” effects that act under loading and unloading, respectively (Bradby and Williams 2004). Plateau means the continuity interruption (discontinuity and burst) in the stress course. Such transition from elastic to elastic–plastic behaviour occurs repeatedly during loading and unloading. Defects in material have a strong influence on the yielding behaviour. These effects have the threshold nature. Pop-in effects were detected even in dislocation-free crystals (Lorenz et al. 2003). Pop-in and pop-out effects take place also in minerals and rocks (silica, stishovite, silicon, sapphire, diorite, graphite, and mica) (Luo et al. 2007). These effects are similar to microplasticity manifestation. The stress plateau in the stress–strain curve is also well documented during sandstone compaction experiments (Baud, Vajdova, and Wong 2006). This is the quasi-static measurement result obtained at high stresses and strains. Here, compaction bands are accompanied by the АЕ activity, which is connected with microplasticity.
The dynamic-microplasticity manifestations in seismic records were first obtained in situ by means of borehole-to-borehole measurements in loams (Mashinskii 2010). During pulse propagation with diverse amplitudes, the shift of the arrival time and the pulse front protracting has been detected in the high-frequency seismic range. A detail description of waveform transformation that takes place owing to the microplasticity process in loam is given in the work (Mashinskii 2012). Microplasticity effects caused by seismic wave from two impulsive energy sources of opposite polarity at frequencies of hundreds of hertz are also detected in loams (Mashinskii 2014). In both cases, microplasticity manifestations are present in the seismic records in the form of the ladder-like changes in amplitude course. The stress plateaus on seismic trace interrupt the elastic amplitude course, transform the wavefront, and shift the arrival time and amplitude maximum along the time axis. The character of transformation depends on the initial deformation type (compression or tension) that generates the source with positive or negative polarity.
The ladder-like changes in the amplitude course detected in loam (Mashinskii 2014) denote an interrupted process. These and other results lead to an idea on the presence of some underestimated mechanism of deformation which can supplement the existing models and give a theoretical explanation. This paper describes the results of the laboratory testing of sandstone sample in the kilohertz frequency range. The experiment purpose is to examine the microplasticity effect in tight sandstone using the alternative method.
2 EXPERIMENTAL DATA
2.1 Method and equipment
The experiments were performed in laboratory on consolidated artificial sandstone specimen in the form of cylindrical rod. The rod length is 1 m, and the diameter is 0.08 m. The specimen has been molded using sifted river sand and cement mortar. Sandy grains have the sizes of 0.25 mm, 0.5 mm, and 1.0 mm. The sandstone density is about 2.0 × 10³ kg/м3, and porosity is approximately 15%. Compression wave velocity is about 2,400 m/s. The specimen is clamped between two rigid supports (walls) by means of a screw jack at an axial pressure of about 0.25 MPa. The experiments were conducted at a dry-room temperature.
Schematic drawing of the equipment is shown in Fig. 1(a). The source and receiver of acoustic signal represent piezoceramic transducers that are rigidly fixed at the rod ends. The piezoelectric transducer consists of a few disks rigidly connected with each other. During the experiments, due to the force of 115 kg applied by the screw jack, the specimen is under constant axial pressure that provides rigid contact of the source and receiver with the specimen. At the same time, this axial stress on the rod (approximately 0.25 МPа) ensures that the specimen is in the hanging position and excludes any acoustic contacts, except the contact on butts.
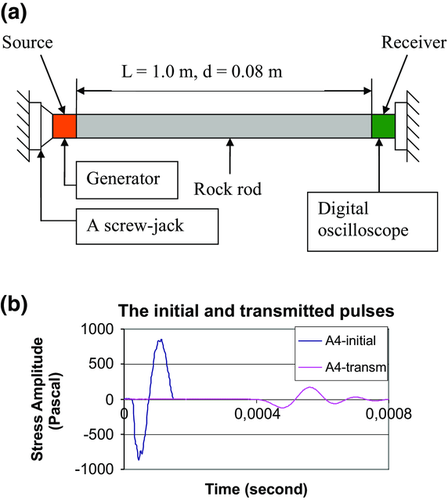
Pulse radiation is created by rectangular electric signal from generator in the amplitude range from 5 V to 60 V. The prevailing frequency of the initial pulse in the source is about 7 kHz. The transmitted wave arrives in the receiver and goes through the amplifier to the digital registering device. A time quantization step in the analog–digital converter (ADC) is tquan = 1 μs. An amplitude quantization step (Aquan) in ADC equals 78 μV. We record stress as a function of time  . The amplitude magnitude in volts was transformed in stress magnitude (Pascal). The typical forms of the initial and transmitted waves are presented in Fig. 1(b).
The transmitted signals were recorded in the digital form at high resolution (Bordo-B-421 system) and then were processed on a computer. Digital signals were recorded with accumulation (no more than 32), which raises the data adequacy. The discrete change in the amplitude value was fulfilled in a closed cycle, from the minimum to the maximum and backward (Amin = A1 → A2 → A3 → A4 → A5 → A6 → A7 = Amax → A6 → A5 → A4 → A3 → A2 → Amin, i.e., seven values upward and six values downward). Here, the amplitudes are A1-up = A1-down, A2-up = A2-down, A3-up = A3-down, A4-up = A4-down, A5-up = A5-down, and A6-up = A6-down. The amplitudes increase as A2 / A1 = 2, A3 / A1 = 4, A4 / A1 = 6, A5 / A1 = 8, A6 / A1 = 10, and A7 / A1 = 12. Maximum stress and strain in acoustic pulse during its propagation were estimated approximately. For the most part, the stress is in the limit from the first hundreds of Pascals to the first thousands of Pascals; the strain is in the range about 10−8–10−7. Thus, stresses and strains are small in the considerable part of the wavepath.
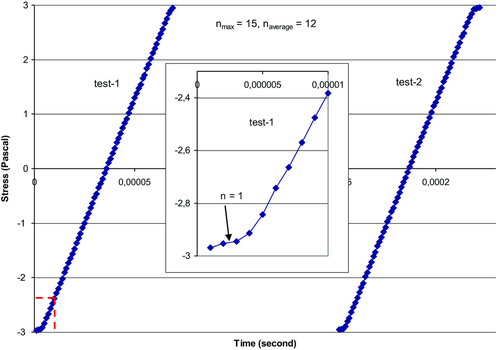
For testing the recording equipment, a special experiment was carried out. The error of the digital equipment was estimated by recording linearly increasing wavefront from special device with a capacitive transducer to generate pure monotonous electric signal without any jumps or interruptions. Multiple records were made, but as they are perfectly identical, only two records are shown in Fig. 2. Here, the amplitude value (in volts) is translated in the stress value (in Pascals). The signal amplitude in the record increases on average linearly with the slope naverage = 12, where n = 1 is the amplitude quantization step. The careful examination of this record reveals some deviations from average linearity (increase and decrease) in the amplitude course. However, there are no any jumps or interruptions, which means the absence of instrumental errors. Amplitude resolution in recording is seen in the initial part of the amplitude course, which is shown in the inset in Fig. 2 (marked by a red dotted line). As is evident from the figure, resolvability in the amplitude value is an amplitude quantum in ADC (n = 1); thus, the error in the amplitude determination does not exceed this value.
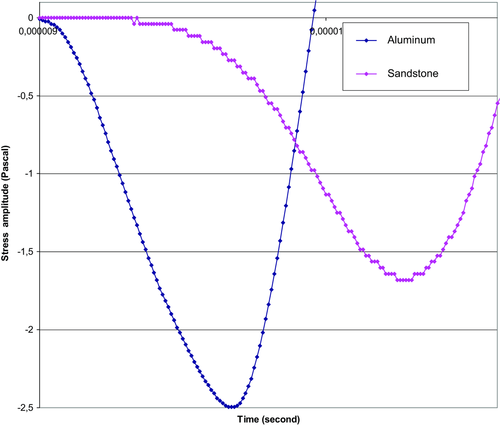
The second test with the aluminium standard and natural sandstone specimen during P-wave propagation at ultrasonic frequencies was performed, and the results were compared. The aluminium/sandstone specimen sizes and the test conditions were equal. The wavefront records are presented in Fig. 3. Here, for better consideration, the wavefront in sandstone is shifted to the left along the x-axis by 4 μs. The aluminium specimen shows practically elastic behaviour all along, except for a small part in the first arrival. The deflection in this part may be explained by the imperfect elasticity of such standard material. The sandstone specimen behaviour in a long time interval completely differs from the aluminium standard. There are numerous abrupt transitions at the wavefront. The character and presumable nature of this process are in detail considered below.
2.2 Results
The unusual staircase-like amplitude variations in the seismic trace (including the pulse arrival region) have been interpreted as the seismic microplasticity manifestations (Mashinskii 2010, 2012). Now, a similar effect has been detected in the sandstone specimen during different-amplitude wave propagation in the kilohertz-frequency range.
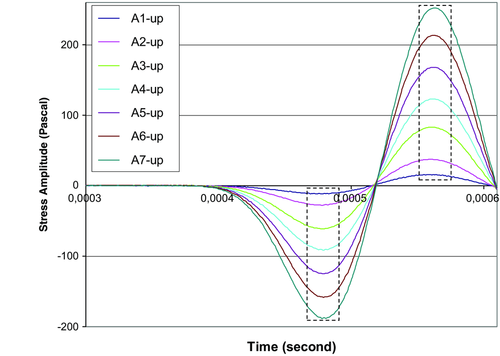
The analog wave traces recorded for seven upward amplitudes are presented in Fig. 4. The downward-amplitude traces are not presented as they are identical to the records obtained on the upward amplitudes. The analogue record, as distinct from the digital record, shows a general view of the waveform with different amplitudes without any details of the wave process evolution in time. The digital records of the signal arrival region and the wavefront are presented in Fig. 5. As shown in this figure, the high-resolution digital record on the higher scale is more informative in comparison with the conventional analogue record. Here, in every trace, there are sites with numerous plateaus that are regarded as microplasticity manifestations. The first-arrival time decreases with the increase in the amplitude value. The decrease in the first-arrival time in the amplitude range is about 3%.
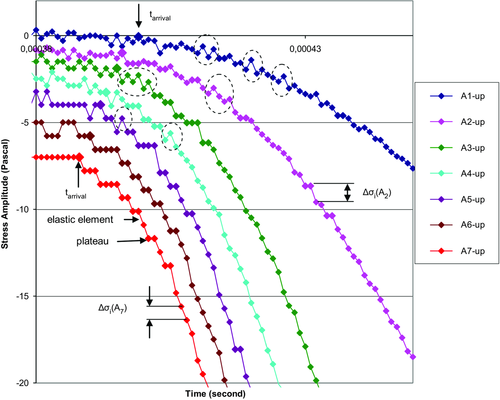
Every acoustic trace within one quantum tquan consists of simple straight-line (elementary) portions that have variable steepness (slope to time axis). The elementary steepness can change from zero to some value depending on the wave amplitude. Non-zero slope portions united together in the lengthy sections are the main component of the waveform. These sections determine the normal elastic stress-amplitude increment (Δσi) in any pulse part (see Fig. 5). There are also elementary portions within one or a few quantums tquan, which have zero slope (they are marked by heavy lines in Fig. 5). These zero-slope portions implanted between the main portions or sections are the additional component of the pulse forming. The elastic stress-amplitude increment in the zero slope interval is absent but there is an inelastic process. Inelasticity manifestation in the σ(t) trace is in the form of plateau and means the stress stop. The cascade of such stops leads to the ladder-like change in the stress-amplitude course.
The stress-amplitude increment that occurs due to the elastic elements in different parts of the waveform is inhomogeneous, and it takes place at any pulse-amplitude value in the source. For example, at the wavefront with the pulse amplitude A1 (Fig. 5), the stress increment in the elementary parts varies from one to ten quantization steps, ΔAquan. It is worth noticing that the stress increment in the elastic elements at all amplitude values (A1, A2, etc.) always exceeds the minimum value ΔAquan. Multilevel variation in stress micro-increment is the evidence of rock micro-inhomogeneity and of wide deviation in modulus of elasticity on the micro-scale. Microplasticity plateaus in the acoustic trace recorded at varied pulse amplitudes are often arranged arbitrarily. However, there are regions in the trace where their presence is always observed. Most plateaus are located near the first arrival, and some of them are at the wavefront. Duration of the plateaus located near the wave arrival is from one tquan to four tquan. Microplasticity plateaus jointly with the elastic elements generate the wavefront steepness.
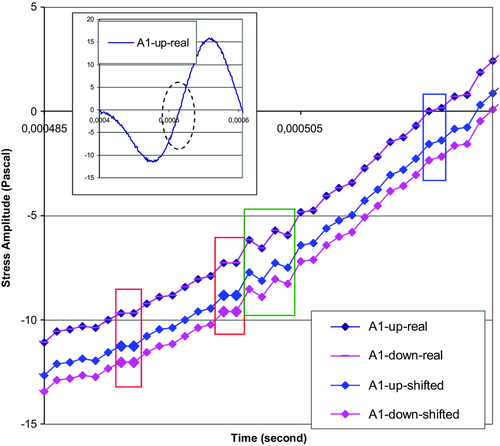
For the repeatability test of the result, the identity comparison was carried out for two similar records (the first and repeated) at each pulse-amplitude value. The first and repeated records at the same amplitude value are not always completely identical. Complete identity of two records at the equal amplitude (A1-up = A1-down) is presented in Fig. 6. Here, the ascending wavefront is shown (the fragment is marked in the inset). Inasmuch as the first and secondary records are exactly similar, these traces have complete coincidence with each other (upper curve in Fig. 6). Two subjacent traces are the same traces, but they are disconnected and shifted down for better viewing. The stress-amplitude increment at the wavefront is not monotonous in time. Such behaviour is not only due to the horizontal plateaus reflecting the stress increment absence, i.e., stress stop (see the area outlined by the red rectangle in Fig. 6). The non-monotonic stress increment at the wavefront occurs owing to the significant variation in steepness of the elastic elements: from minimum value equal to one amplitude quantum, 1×ΔAquan, to 14 × ΔAquan (see blue rectangle). There is also a wavefront area where the elastic behaviour is presented by the saw-tooth form and where the stress sharply rises and then also drops (see the area in the green rectangle). The saw-tooth form at wavefront can also be seen in Fig. 5.
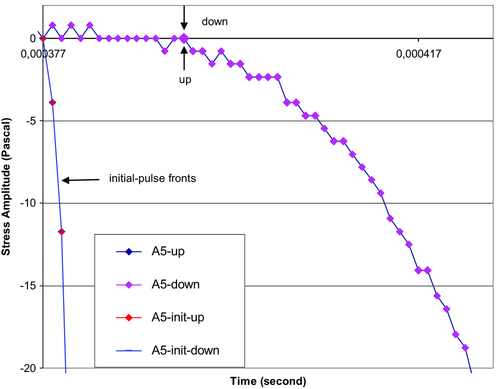
The complete identity of two traces recorded at the equal amplitude values (A5-up = A5-down) is shown in Fig. 7. It is obvious that the first-arrival time both for the upward and downward pulse amplitude is equal. The layouts of the elastic and microplastic elements in the trace completely coincide with each other. The initial pulse front is presented at the left of the diagram for the visual comparison with the transmitted wavefront. Here, the first-arrival time of the initial pulse does not correspond to a real time. As shown in Fig. 7, the initial wavefront steepness considerably exceeds the transmitted wavefront steepness.
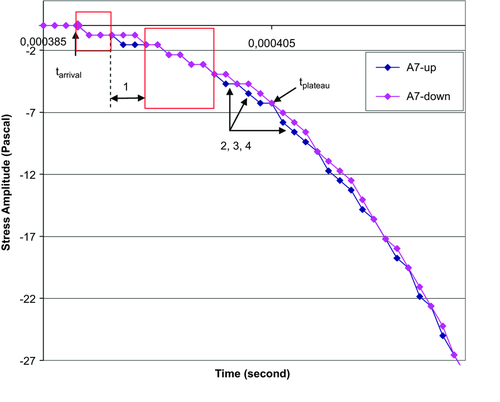
Even in the case when two records with the equal amplitudes are not completely identical, there is the complete identity in some parts of the acoustic trace in the records. An example of such record is shown in Fig. 8. It is seen that the first-arrival time both for the upward and downward amplitude is the same. Accurate similarity of two records takes place in the segments delineated by red rectangles. Here, the wavefront behaviour due to built-in plateaus is stairs like. In the other wavefront parts, the stress-amplitude increment in time for the downward amplitude as distinct from the upward amplitude goes by the other course. The two amplitude courses meet in the node point where the amplitude values for both courses have equal magnitudes. Geometrical figures of parallelogram, rhombus, etc., can be seen between the knots (see 1, 2, 3, 4, etc.). We see the phenomenon that the stress-amplitude courses at the time of the first and second measurements differ in small details but coincide on the whole. It is indicative that amount of plateaus at the wavefront both in the first and the second measurements is equal. In the time interval (tarrival - tplateau) in both records, there are nine time intervals comprising plateaus plus eight intervals with elastic elements.
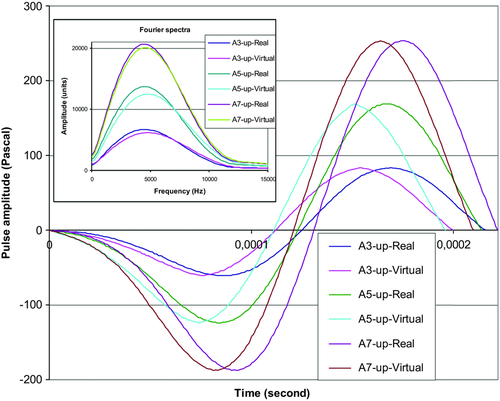
To observe the microplasticity effect, the virtual microplasticity withdrawal operation was performed in the acoustic record. All plateaus were deleted from the waveform, and then all elastic elements were connected with each other successively. The waveform records at three amplitudes (A3-up, A5-up, and A7-up) before and after the microplasticity withdrawal are shown in Fig. 9. Fourier spectra are also shown in the inset in this figure. After the plateaus deletion, the decrease in the wavelength and Fourier spectrum displacement to higher frequencies occurs.
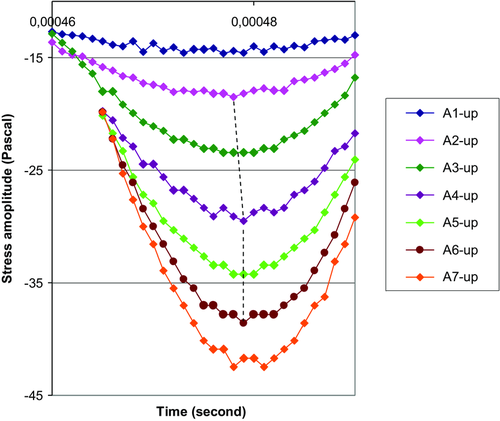
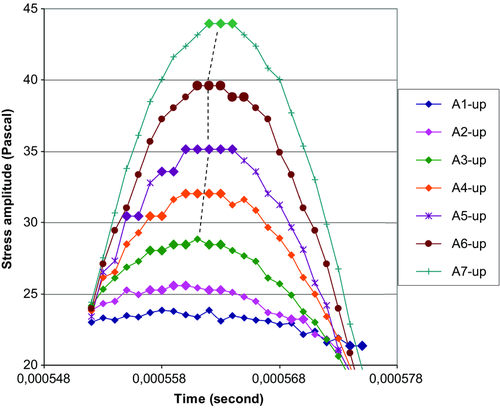
Microplasticity manifestations that are located not far from the pulse minimum and its maximum (these are marked in Fig. 4 by dotted rectangles) are shown in Figs. 10 and 11, respectively. Here, the fragments of the traces (without change of real pattern) are shifted along the y-axis nearer to each other for the detailed microplasticity consideration. The plateaus in the traces are marked out by the large-size symbols. The effect of the pulse amplitude is evident. The most of plateaus are located near the pulse maximum.
3 DISCUSSION
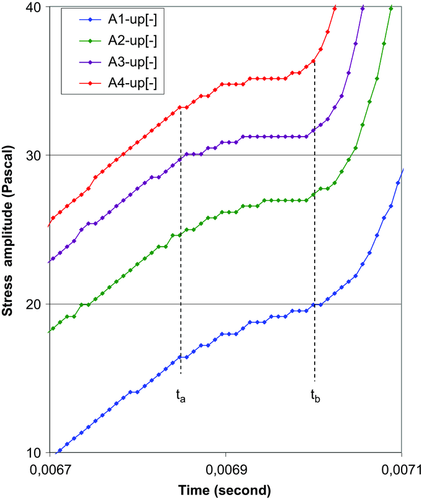
The initial steps on the way of comprehending dynamic microplasticity process in a geologic medium have been made in the field observation (Mashinskii 2010, 2012, 2014). Since the physical mechanism of this phenomenon in rocks is not completely understood; therefore, “microplasticity” can be replaced by the term “quasimicroplasticity.” Unusual inelasticity in rocks that takes place in a small-strain range is of interest both in fundamental and applied sciences. The data obtained in the laboratory experiment on sandstone specimen confirm the field test results completely. As an example, Fig. 12 taken from the work (Mashinskii 2014] shows the staircase-like behaviour of the wavefront in loam. The same behaviour takes place in tight sandstone. In loam, there are plateaus in all amplitude traces (A1-up–A4-up), and the microplasticity response also depends on the amplitude value. Here, the ladder-like manifestations are located mainly in the time interval (ta – tb), and this causes considerable decrease in the effective steepness of the wavefront.
In the Earth science, there is an obvious gap in this knowledge inasmuch as the direct proof of rock microplasticity has only been obtained in quasistatic experiments (Mashinsky 1994; Mashinskii 2005b). The dynamic experiment performed at different pulse amplitudes shows that the increase in the amplitude value changes the contribution of elasticity and microplasticity in the stress-amplitude increment. If microplasticity dominates, the wavefront becomes flatter and, on the contrary, when elasticity dominates, the wave front becomes steeper. As a matter of fact, the change in the microplasticity contribution under stress variation was experimentally established earlier in the work (Mashinskii 2005b) but is true only for quasistatic deformation.
 (1)
(1) represents ideal elastic strain, the εv-e is viscoelastic strain, and εμ is the microplastic strain that is the amplitude-dependent deformation. It can happen that the total strain increment occurs only due to elastic strain, and in this case,
 (2)
(2) (3)
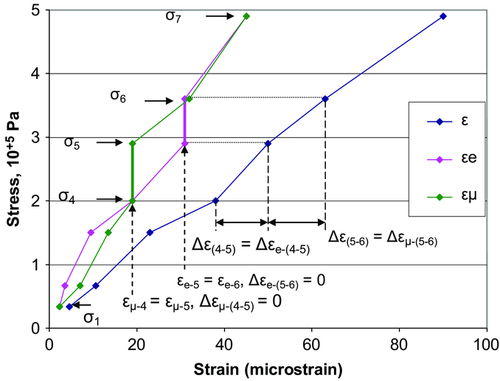
(3)Figure 13 shows the stress–strain curves of fine-grained sandstone that demonstrate such situation (diagrams are plotted based on the data from (Mashinsky 1994; Mashinskii 2005b)). In the stress intervals (σ1 - σ4) and (σ6 - σ7), the total strain consists of the elastic strain (pure elastic plus viscoelastic) and the microplastic strain, as is shown in equation 1. However, the stress interval (σ4 - σ6) in principle is different from the others. As shown in the diagram, the total strain increment Δε(4-5) in the stress interval (σ4 - σ5) occurs only due to the elastic strain Δεe-(4-5) as the microplastic strain is absent 2. In the stress interval (σ5 - σ6), on the contrary, the total strain increment Δε(5-6) occurs only due to the microplastic strain Δεμ-(5-6) as the elastic strain is absent 3. The zero elastic deformation means the stoppage in the stress transmission, i.e., in other words, this can be reason for the short-term stress stop in a wave propagation process.
As is evident from the above analysis (see Introduction), the data obtained in our work are closely related to the results for other solids and, however, have their own character. The saw-tooth stress behaviour observed in the curve σ(t) is shown in Figs. 5 (circles) and 6 (green rectangle). Such behaviour is predicted by a simplified microstructural model with microplasticity (Derlet and Maaf 2013) that considers three loading modes at different strain rates. We surmise that the wavefront steepness change in any part in the curve σ(t) within one or more than one tquan step can be considered the local variation in the modulus of elasticity. This is shown in Fig. 6 where there are local variations in the wavefront steepness that differ 14 times. Here, we suppose that the local variation of the wavefront steepness (Δσi-increment during one tquan) corresponds to the modulus change, ΔEi = Δσi / Δεi. When a stress plateau is present, the modulus of elasticity equals “zero” and in this case, the elastic process is absent and the yield process presumably takes place.
The comparison with the other well-known mechanisms (e.g., squirt flow, standard linear solid, stick-slip, etc.) shows that these mechanisms are phenomenological (elastic–viscous combination) and fail to describe the inelastic process on a micro-scale. This model lacks the microplastic element that is responsible for the discontinuous-elastic deformation process. Moreover, inelasticity behaviour usually is related to the behaviour at moderate wave amplitudes and strains (>10−6) (e.g., Johnson et al. 2008); at the same time, our result is obtained for the wave propagation under smaller strains. The physical process is usually presented by sliding of crack surfaces. The deformation effect similar to the stick–slip behaviour but generated by microplasticity (or other mechanism) can be obtained in fissures-free rock with microscale and nanoscale defects.
The deformation process comprising microplasticity plateaus detected during sandstone compaction experiments is closest to our result (Baud et al. 2006). There are also some differences. In this quasistatic measurement, the stress–strain curve was obtained under relatively high pressures and strains. Indeed, in the range of the moderate and higher stresses, the mechanism with grain boundary sliding, grain crushing, or pore collapse plays the key role. However, under low stresses, the applied force can be insufficient for activation of these processes, and other mechanism(s) comes into play under low stresses/strains. I suppose that the detailed analysis of the stress–strain diagram (Fig. 1, Baud et al. 2006) obtained at high resolution can also show stress microplateaus on the nonlinear site of this diagram.
4 CONCLUSION
This study brings the new contribution to the understanding of the dynamic deformation process in rocks during wave propagation. The implication of the new mechanism consists in ascertainment of the physical cause of the amplitude-dependent effects, which affords an opportunity to enhance efficiency of seismic methods. A seismic rheological model with the new microplastic element included will offer a more realistic description of the wave attenuation mechanism. The diverse in-manifestation amplitude dependence of wave velocity and attenuation detected in many experiments should be linked with microplasticity. Insertion of microplasticity elements in the elastic process occurs with overcoming of some energy threshold. It is possible that the threshold effect is bound with some microstructural or even nanostructural elements in rock heterogeneity.
In this work, the microplasticity effect in the laboratory experiment on sandstone specimen has been proven. In spite of difference in rock types and frequencies, the microplasticity manifestations in the laboratory experiment for the most part are identical to data obtained in the field experiment. This is the evidence of adequacy of data on rock microplasticity manifestation obtained in different ways. Naturally, microplasticity manifestation and its mechanism in geological materials are understood yet incompletely.
The physical mechanism of rock microplasticity can be the same as that in many solids or to be absolutely different in nature but with identical manifestations (quasimicroplasticity). The implication of this mechanism consists in ascertainment of the physical origin of the amplitude-dependent effects, which expands the potential of seismic methods. Microplasticity manifestations observed in situ and in a laboratory are very similar to microplasticity manifestations in usual solids. The lithologic multiplicity and structure complexity of rocks require a further study of the detected effects. We raise a point of the little-known inelastic processes of small-amplitude wave propagation in natural materials. The new knowledge about rock inelasticity can be useful not only for theoretical development but also for enhancement of the efficiency of seismic, acoustic and other methods.
ACKNOWLEDGEMENTS
The author would like to thank Dr. G.V. Egorov and Dr. N.A. Golikov for the help in experimentation and discussion of this work, and A.V. Timofeev for the technical help.


