The effects of inter-vibrator interference on vibrator performance
ABSTRACT
The output from the hydraulic vibrators typically used for land seismic surveys is controlled by monitoring the acceleration measured by accelerometers mounted on the reaction mass and baseplate. The considerable energy output by such vibrators, which are coupled with the sensitivity of the accelerometers used, results in crosstalk if more than one vibrator is being used. In this paper, we present the results of a field experiment in which we measured the crosstalk between two adjacent vibrators. We found that the level of crosstalk was approximately -20 dB when the vibrators were adjacent but decreased with increasing frequency and separation. This result has implications for measurements of vibrator performance, source-signature deconvolution, and in particular, estimates of the total energy output by a fleet of vibrators.
INTRODUCTION
Hydraulically driven seismic vibrators have become the dominant source for land seismic surveys, with other sources used only where vibrator availability is limited or there are access problems. The vibrator transmits energy into the ground by lowering a baseplate onto the ground upon which the weight of the vehicle is then placed, with the vehicle being isolated from the baseplate by a series of airbags. A large mass, called the reaction mass, situated above the baseplate, is then hydraulically driven up and down with an oscillatory motion referred to as a sweep. The sweep typically has a linear variation in frequency covering a bandwidth of around 5 Hz to 100 Hz. The performance of the vibrator is managed by an electronic controller that monitors the transmitted signal using the weighted sum of two accelerometers: one placed on the reaction mass and the other on the baseplate. This sum is often referred to as the ground force (Sallas 1984). The standard control algorithm since the mid-1980s, referred to as phase locking, has been based on locking the ground force to the pilot (Anstey 1991). This technique involves continuously calculating the weighted sum and comparing its phase with that of the pilot. The vibrator's electronic controller then continuously adjusts the phase of the vibrator to ensure that the estimated ground force is in phase with the pilot.
Clearly, the success of this approach depends on the measurements being made by accelerometers that are free from non-random phase noise. The accelerometers themselves are typically very sensitive (Rademacker et al. (2005) measured accelerometer noise to be below 180 N (40 lbf) between 10 Hz and 100 Hz), and given that the output of the vibrators is large (it can be easily felt while standing next to one), the transmitted energy from a vibrator can be received by the accelerometers on nearby vibrators. If the interference is significant, then this may affect the controller's ability to successfully control the vibrator, particularly if the vibrators are not transmitting the same sweep as they do in some simultaneous-source methods. In this paper, we attempt to determine the magnitude of any such interference and its implications for vibrator performance, vibrator output, and source signature deconvolution.
The only published study concerning vibrator interference that we are aware of is that of Martin and Bacon (1993). As part of a range of experiments, they measured the output from a vibrator using the accelerometers mounted on another vibrator placed 10 m away. They found that the peak amplitude (at 20 Hz) of the measurements made by the second, non-sweeping, vibrator, which we shall refer to as the “passive ground force,” was 51 dB lower than that of the sweeping vibrator. They considered this level to be too low to cause any direct interaction between the vibrators.
Several other studies have, however, looked at the interaction between the waves produced by multiple vibrators. In a theoretical study, Cassand and Lavergne (1971) determined that the output of n vibrators placed close together is n2 that of a single vibrator as the displacement under each vibrator is affected by the others. In another theoretical study, Tan (1985) determined that two vibrators are likely to interfere at separation distances up to the wavelength of their emitted Rayleigh waves. Brune et al. (2013) recorded data with two vibrators separated by a distance of between 5 m and 100 m at increments of 5 m perpendicular to a surface geophone line to determine if ground roll could be attenuated (Nyland 1995). They found that, although the reflection signal level was relatively constant, varying by only 4 dB, the ground-roll level varied by more than 17 dB with its minimum and maximum values being at separations of 25 m and 60 m, respectively. This variation was ascribed to the interaction of the waves produced by the vibrators rather than any interaction between the vibrator's controllers.
An area in which interference between ground-force measurements may be of particular concern are source methods that use ground-force measurements for separation and/or source signature deconvolution, e.g., the high-fidelity Vibroseis seismic (HFVS) method (Krohn and Johnson 2003). Even if the interference is not significant enough to affect the performance of the vibrator directly (via the controller), it may affect the quality of the seismic data after the application of signature deconvolution (Shaw et al. 2009; Nagarajappa and Wilkinson 2010)
METHODOLOGY
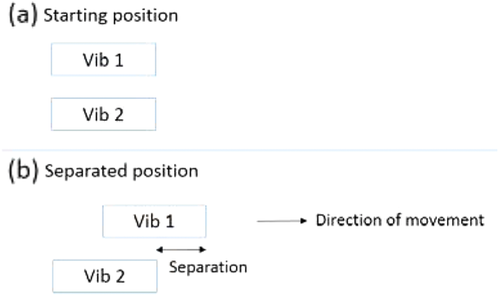
To determine the interaction between two vibrators, we used two 267,000 N (60,000 lbf) peak-force truck-mounted vibrators (Dean et al. 2013a, b) situated on a compacted gravel pad. The units were initially parked next to each other, and then measurements were made as vibrator 1 was moved away (vibrator 2 remained stationary); the separation between the two vibrators was measured between the front bumpers of the two vehicles (Fig. 1). Separations of 0 m, 3 m, 6.1 m, 12.2 m, 18.3 m, 24.4 m, 30.5 m, and 36.6 m, were recorded. Accelerometer data were recorded on vibrator 2 with a sample rate of 0.5 ms using an independently recorded accelerometer system, enabling the data to be recorded before and after the sweep of vibrator 1. Performance data on vibrator 1 was recorded using the same accelerometers used by the controller. The sweep used was a standard 8 Hz–80 Hz linear sweep over 12 s.
RESULTS
Figure 2 shows frequency–time plots of the reaction mass, baseplate, and weighted-sum ground-force traces recorded on vibrator 2 for vibrator 1 sweeping (bottom row) and vibrator 2 sweeping (top row). All the plots have been normalized to the maximum value of the acceleration measured when vibrator 2 was sweeping. Mono-frequency noise associated with electrical interference is evident but is approximately 50 dB down from the peak amplitude. The peak amplitude measured by vibrator 2 when vibrator 1 is sweeping is only 21 dB, 20 dB, and 18 dB down for the reaction mass, baseplate, and ground-force traces, far higher than the –51 dB measured by Martin and Bacon (1993) at a separation of 10 m.
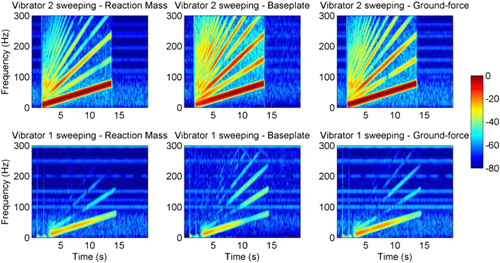
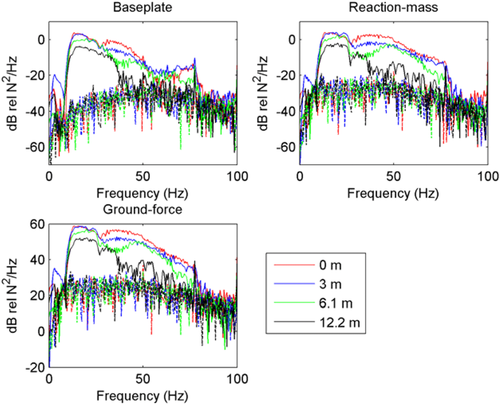
Figure 3 shows the amplitude spectrum of the data recorded by vibrator 2 when vibrator 1 was sweeping at offsets of 0 m, 3 m, 6.1 m, and 12.2 m. As expected, as the offset increases, the amplitude decreases, with the high frequencies being attenuated the quickest. The acceleration signal measured on the reaction mass has more high-frequency content than that of the baseplate.
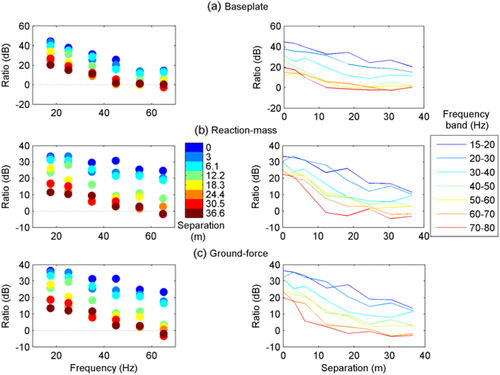
To further analyse the data, we split the amplitude spectra into different frequency bands and calculated the ratio in each band between the median of the crosstalk and the median of the ambient noise (estimated using the section of the trace after the vibrator has finished sweeping). The results (Fig. 4) agree with those shown in Fig. 3, i.e., that the ratio decreases with separation but that the rate of the decrease is inversely proportional to frequency.
 (1)
(1) (2)
(2)For the data shown in Fig. 5, the signal and noise levels are ∼76 dB and ∼23 dB, respectively, which gives us a ratio value of 13 dB (76 dB – 23 dB – 40 dB). Rearranging equation 1 and substituting in this value, we get a minimum separation of ∼40 m ([13 – 43.3 + (0.38 × 10)]/ –0.66).
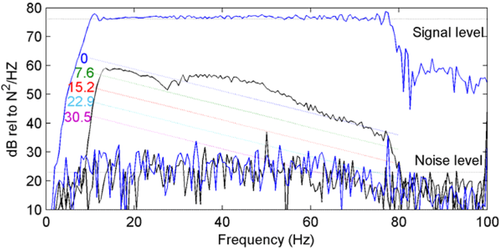
The estimated interference noise levels at different separations and the measured level at a separation of 0 m are shown in Fig. 5. This result shows that the model, although may seem simple, is a reasonable fit to the real data. It also indicates that the interference level drops relatively slowly with increased separation.
EFFECTS ON VIBRATOR PERFORMANCE
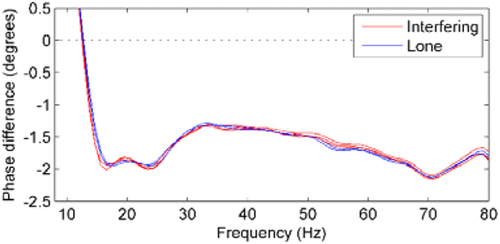
Although we have shown that vibrators sweeping even at large distances interfere with each other's ground-force measurements, the question is the extent to which this interference can affect the performance of a vibrator. To determine this, we swept the two vibrators using the same sweep but with small time delays. Frequency–time plots of the data (Fig. 6) clearly show the interfering vibrator, with the amplitude of the fundamental component being about 20 dB below that of the primary vibrator. Given that the phase of the interference from the second vibrator is different from that of the primary vibrator if the contamination was significant enough to affect the phase control functionality of the controller algorithm, then we would expect to see a degradation in the phase difference between the ground force and pilot, but there is no evidence of this (Fig. 7), even when the vibrators were started with a very small time gap.

EFFECTS OF ESTIMATES OF VIBRATOR PERFORMANCE
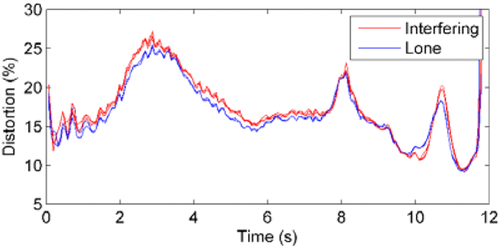
The ground-force data are often used as an indication of the quality of the transmitted sweep as well as to help identify any potential mechanical issues with the vibrator. Figure 7 shows that there is unlikely to be an effect on the phase error measurement, but the additional noise on the data from the interfering vibrator results in distortion results that are 2% higher than seen with a vibrator sweeping on its own (Fig. 8).
EFFECTS ON VIBRATOR OUTPUT
 (3)
(3) (4)
(4) (5)
(5)This equation can then be solved for the values of Fn using straightforward matrix inversion, and the total output of the vibrator group established by summing each vibrator's output.
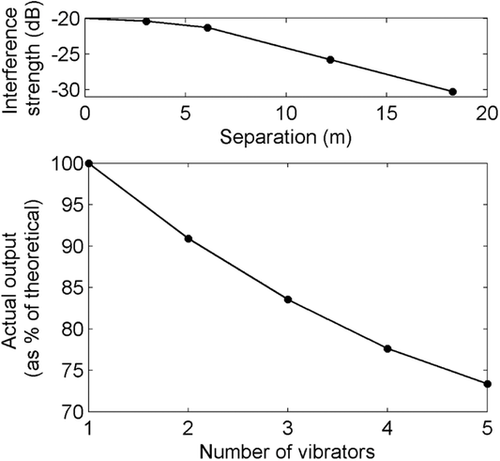
Figure 9 (top) shows the strength of the interference from an adjacent vibrator as calculated from the experiments described here. Figure 9 (bottom) shows the resulting output of a group of vibrators calculated using equation 5. Clearly, interference between closely located vibrators has the potential to reduce the total energy output of the fleet considerably.
EFFECT ON SOURCE-SIGNATURE DECONVOLUTION
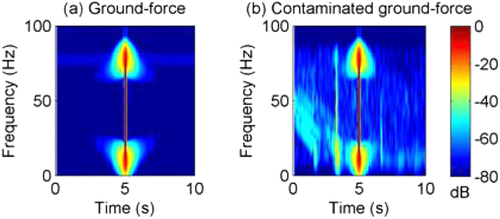
To gauge the effects of vibrator interference on source-signature deconvolution, we deconvolved an uncontaminated ground-force trace both with itself and with a contaminated trace (Fig. 6, sweep 1). The uncontaminated trace (Fig. 10a) is deconvolved successfully, whereas the contaminated ground force (Fig. 10b) shows considerable noise, both from the presence of a spurious Klauder wavelet at approximately 4 s and considerable harmonic noise contamination.
DISCUSSION AND CONCLUSIONS
The results presented here show that when two vibrators are adjacent, the level of crosstalk is approximately –20 dB, much higher than that measured by Martin and Bacon (1993) of –51 dB. This discrepancy is most likely due to a difference in the lower output of the vibrators used (hold-down of 158,000 N (35,500 lb) versus 240,000 N (54,000 lb)), the controller electronics, and, possibly, differences in ground conditions. The level of crosstalk decreases with increased frequency and vibrator separation and, in this case, could be modelled successfully with a linear fit.
Even when vibrators are placed next to each other, there is no evidence of any detrimental effect on the quality of the transmitted signal from the vibrator, but estimates of the performance of the vibrator may be affected detrimentally.
For source techniques that involve source-signature deconvolution, the implications are significant if interference is present on the recorded ground force, although this has not been confirmed using field data as none was available.
 (6)
(6)ACKNOWLEDGEMENTS
The authors would like to thank Schlumberger US-Land for the vibrators used in the test, and Claudio Bagaini, John Quigley, and Malcolm Lansley for the fruitful discussions.


