Efficient volumetric extraction of most positive/negative curvature and flexure for fracture characterization from 3D seismic data
ABSTRACT
Most positive/negative curvature and flexure are among the most useful seismic attributes for detecting faults and fractures in the subsurface based on the geometry of seismic reflections. When applied to fracture characterization and modelling of a fractured reservoir, their magnitude and azimuth help quantify both the intensity and orientation of fracturing, respectively. However, previous efforts focus on estimating only the magnitude of both attributes, whereas their associated azimuth is ignored in three-dimensional (3D) seismic interpretation. This study presents an efficient algorithm for simultaneously evaluating both the magnitude and azimuth of most positive/negative curvature and flexure from 3D seismic data. The approach implemented in this study is analytically more accurate and computationally more efficient compared with the existing approach. The added value of extracting most positive/negative curvature and flexure is demonstrated through the application to a fractured reservoir at Teapot Dome (Wyoming). First, the newly extracted attributes make computer-aided fault/fracture decomposition possible. This allows interpreters to focus on one particular component for fracture characterization at a time, so that a composite fractured reservoir could be partitioned into different components for detailed analysis. Second, curvature/flexure azimuth allows interpreters to plot fracture histogram and/or rose diagram in an automatic and quantitative manner. Compared with the conventional plotting rose diagram based on manual measurements, automatic plotting is more efficient and offers unbiased insights into fracture systems by illuminating the most likely orientations of natural fractures in fractured reservoirs.
INTRODUCTION
In fractured reservoirs formed by tectonic deformation, reliable characterization of faults and fractures plays a key role in delineating potential hydrocarbon migration pathways in a reservoir system and designing horizontal drilling for reservoir development. The conventional discontinuity attributes (e.g., Bahorich and Farmer 1995; Marfurt et al. 1998; Tingdahl and de Rooij 2005; Di and Gao 2014a; Zheng, Khavousi, and Di 2014) and curvature attributes (e.g., Lisle 1994; Roberts 2001; Sigismondi and Soldo 2003; Chopra and Marfurt 2010; Di and Gao 2014b) have been widely used to detect and visualize faults and fractures from 3D seismic data. Specifically, by measuring lateral waveform similarity and/or amplitude variation, discontinuity attributes provide a clear imagery of the major faults that are already discernable from seismic amplitude. However, such an imagery is only qualitative and has a limited resolution. Quantitative and more detailed fracture detection could be achieved with the aid of extracting geometric attributes, including reflector dip, curvature, and flexure, by evaluating lateral variation of the geometry of seismic reflections at different scales (Gao and Di 2015). In particular, dip evaluates the first-order variation of reflection geometry and could detect faults with apparent displacement. Curvature evaluates the second-order geometry variation and could resolve subtle faults and fractures. Flexure evaluates the third-order geometry variation and could have an even higher resolution than the second-order curvature.
Seismic curvature has been the focus of geophysical research since the introduction of Gaussian curvature analysis to structural interpretation by Lisle (1994). The second-order geometric attribute describes how much a curve deviates from being straight and thereby is capable of highlighting faults and fractures induced by formation bending. Roberts (2001) provided a list of nine curvatures, including maximum/minimum curvature and most positive/negative curvature, and demonstrated their value in identifying fault and other subtle features through application to a dataset from the North Sea; however, his workflow of extracting these attributes is based on a pre-prepared horizon by manual horizon picking. To avoid interpreter bias, volumetric estimates of seismic curvature were performed by Al-Dossary and Marfurt (2006), whose algorithm uses a fractional-order approach, but the application is limited to only horizontal or gently dipping formations. The limitation is resolved by applying a computer-aided workflow of fitting a quadratic nine-node grid cell to 3D seismic data (Di and Gao 2014b). Among these various seismic curvature, most positive/negative curvature finds the widest application, due to their capability of providing an edge-type display for faults and fractures (e.g., Roberts 2001; Blumentritt, Marfut, and Sullivan 2006; Chopra and Marfurt 2007a, b, 2010). When applied to fault interpretation, most positive/negative curvature highlights the anticlinal upthrown block and synclinal downthrown block of a fault, respectively, but provide no definition of the fault location. This would cause an apparent offset of the actual fault location, particularly for faults with wide damage zones. Moreover, the existing methods for computing both curvatures are limited to their magnitude. Little work has been published on computing their associated azimuth, which is fundamentally important for fracture network modelling and predicting the most likely orientation of faults and fractures in reservoirs (Gao 2013).
For better structure analysis and fracture characterization, seismic flexure was proposed to complement the existing curvature attribute (Gao 2013). Given that curvature is related to the bending of seismic reflections, the new flexure attribute describes lateral changes in the bending moment (Lim and Reddy 2003; Gao 2013) and is capable of highlighting shear faults and fractures. Physically, flexure evaluates the third-order variation of the geometry of seismic reflections; thus, it is capable of revealing more information about structural deformation that is not detectable by the second-order curvature attribute. Theoretically, an infinite number of flexures can be evaluated from 3D seismic data, due to its dependence on its measuring direction on a surface. Among all possible directions, four important ones for structure analysis are dip direction, strike direction, and two principle directions associated with maximum and minimum flexures, respectively (Di and Gao 2014c). The first flexure algorithm was developed for evaluating flexure along the direction of true dip or referred to as dip flexure (Di and Gao 2014d). Then, a discrete azimuth-scanning algorithm is presented for computing extreme (signed maximum) flexure, whose magnitude and azimuth are indicative of the maximum intensity and most likely orientation of faulting and fracturing (Di and Gao 2014c). However, scanning is a time-consuming process, and more importantly, extreme flexure may be confusing to interpreters when it is used for fracture detection. Fracture interpretation would be more effective if flexure attribute extraction can be further improved to provide an edge-type display for faults and fractures, similar to that by most positive/negative curvature.
This study extends the concept of most positive/negative curvature to seismic flexure and develops two new algorithms for simultaneously computing both the magnitude and azimuth of most positive/negative curvature and flexure. Both algorithms consist of two steps: (i) rotating the local seismic reflection to be horizontal by setting the first derivatives of seismic reflections, or apparent dips, to be zero (Young 1978), and (ii) implementing attribute analysis on the rotated reflection. For fast and efficient computation in an analytical manner, we start from our newly developed equations for computing azimuthal curvature and azimuthal flexure, then take a derivative of such equations with respect to azimuth, and finally solve the generated quadratic and cubic equations to compute most positive/negative curvature and flexure. The added value of both algorithms is demonstrated through application to a fractured reservoir at Teapot Dome (Wyoming). The edge-type display of most positive/negative curvature and flexure provides enhanced visualization with more details and less ambiguous information for interpreting subtle fractures, compared with previously used extreme curvature and flexure attributes. More importantly, the orientation of faults and fractures in the subsurface is quantified by the azimuth property of most positive/negative curvature and flexure. Using the attribute cubes generated from our new algorithms has two important implications for fracture characterization: (i) computer-aided partitioning of a fractured reservoir into different components that allows interpreters to focus on one particular component for fracture interpretation at a time; and (ii) automatic plotting of fracture histogram and/or rose diagram that allows interpreters to predict the orientations of natural faults and fractures, in the target formations without introducing interpreter bias.
METHOD
A new workflow
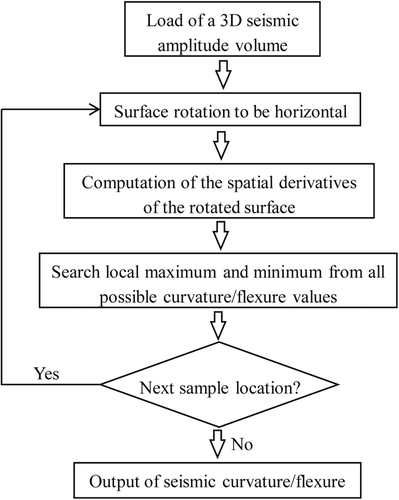
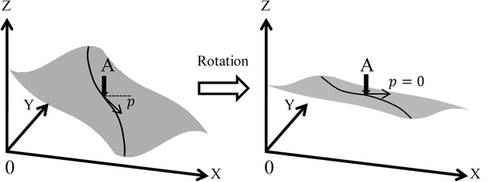
The computation of seismic curvature and flexure attributes is dependent on fitting a local surface to 3D seismic data and calculating the spatial derivatives of the surface, which becomes complicated and inaccurate in the presence of geologic complexities, such as steeply-dipping and overturned folds. This study proposes a new workflow of three steps to improve curvature and flexure analysis for complex structures (Fig. 1). After fitting a local surface to seismic data at a particular sample, the algorithm first rotates the fitted surface to be horizontal at this sample by following its structural dip (Fig. 2). Then, the derivatives of the rotated surface are calculated, which could accurately represent the variation of the surface geometry even for complexly deformed formations. Finally, the algorithm searches for the maximum and minimum from all possible curvature/flexure values. The above steps are repeatedly executed from sample to sample, and consequently, a regular amplitude volume is transformed into an attribute volume of seismic curvature/flexure. Considering the computational efficiency of the new derivatives after surface rotation, in this paper, we simplify the workflow by approximating them by the surface derivatives before rotation. Although the simplification affects the accuracy of curvature/flexure, the associated output, often known as the most positive and negative attributes, are close to the true ones in most cases and useful for fracture characterization.
Most positive/negative curvature
Most positive/negative curvature,  and
and  , is defined as maximum/minimum curvature without considering local structural dip, respectively. Compared with the existing methods (Roberts 2001; Al-Dossary and Marfurt 2006), the new method presented in this paper has the strength of providing interpreters with two fundamental properties of most positive/negative curvature,
  and
and  , with one being the magnitude and the other being the associated azimuth. The former is popular and has been widely used to predict the intensity of faults and fractures, whereas the latter is new and could be useful for indicating the most likely orientations of faults and fractures.
 on a surface (Di and Gao 2014b; Gao and Di 2015),
 (1)
(1) and
and
 denote the first derivatives of a seismic reflection along inline (x-) and crossline (y-) directions, also known as apparent dips, respectively.
  ,
,  , and
, and  denote the second derivatives. To avoid interpreter bias, all the derivatives (Young 1978) are calculated using a computer-aided workflow for fitting a quadratic surface to local seismic data, based on a rectangle grid cell with nine nodes (Di and Gao 2014d). Then, the following steps are conducted at each sample.
 (2)
(2) and
and  can be derived by searching the maximum and minimum of all possible normal curvatures on the rotated surface,
 (3)
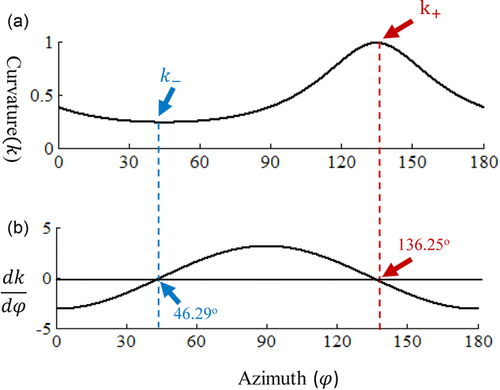
(3)
 and
and  . (a) A curve of azimuthal curvature
  showing the curvature values evaluated along all possible azimuths. (b) A quadratic curve of
  showing the derivative of azimuthal curvature with respect to azimuth. Equation
  has two real roots, with one being associated with most positive curvature
  (red) and the other with most negative curvature
  (blue). The two roots are orthogonal and separated with an interval of about 90°.
 (4)
(4) always has two real roots, as shown in the following, since its discriminant
  is always positive in all possible cases.
 (5)
(5)As shown in Fig. 3(b), one root represents the azimuth associated with most positive curvature  (red), whereas the other represents the azimuth associated with most negative curvature
  (blue). Moreover, we notice that the two roots are nearly orthogonal, separated with an interval of about 90°.
Most positive/negative flexure
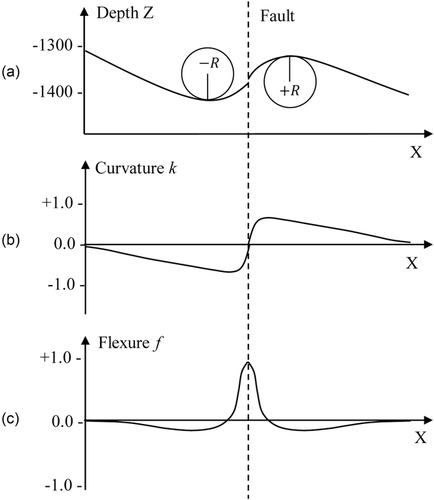
Flexure at a point on a curve is defined as the rate of change in curvature with respect to the curve length at the point (Gao, 2013) (Fig. 4). As a third-order geometric attribute, flexure is capable of revealing more subtle structural features than the second-order curvature. In order to provide an edge-type visualization for improved fracture characterization, in this study, we extend the concept of most positive/negative curvature to flexure and propose the first method for volumetrically computing most positive/negative flexure,  and
and  , respectively.
 and
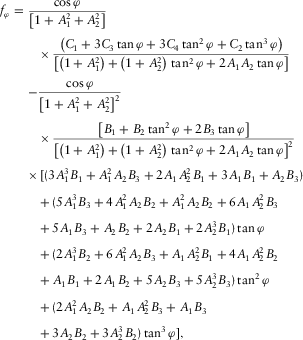
and  , starts with the equation for computing azimuthal flexure
  on a surface (Di and Gao 2014c; Gao and Di 2015), i.e.,
 (7)
(7) ,
,  ,
,  , and
, and  denote the third derivatives of the geometry of seismic reflections, and a diamond grid cell with 13 nodes is used for fitting a cubic surface to local seismic data and calculating these third derivatives (Di and Gao 2014d). Then, the following steps are conducted at each sample.
 (8)
(8) and
and  can be derived by searching the maximum and minimum of all possible normal flexures on the rotated surface,
 (9)
(9)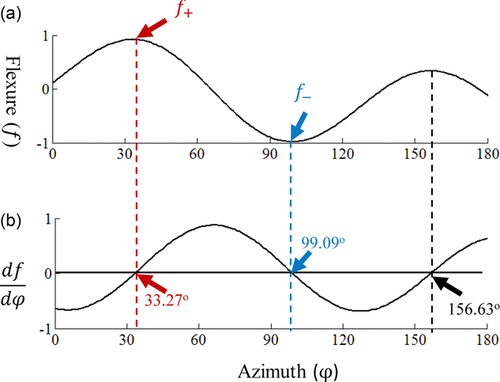
 and
and  . (a) A curve of azimuthal flexure
  showing the flexure values evaluated along all possible azimuths. (b) A cubic curve of
  showing the derivative of azimuthal flexure with respect to azimuth. Equation
  has three real roots, with one being associated with most positive flexure
  (red), and one with most negative flexure
  (blue). Three roots are separated with an interval of about 60°.
 (10)
(10) represent three potential azimuths, each of which is related to most positive flexure
  (red), most negative flexure
  (blue), and a medium peak (black), and three roots are separated with an interval of about 60° (Fig. 5b). Solving the cubic equation
  is mathematically complicated, and Appendix B provides calculation of real roots of a cubic equation in three different cases.
Step 3: Calculate flexure magnitude. Substituting equation 8 with these roots provides us with the magnitude of most positive/negative flexure.
RESULTS
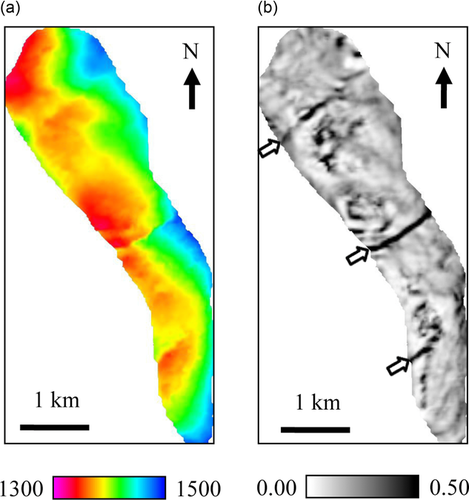
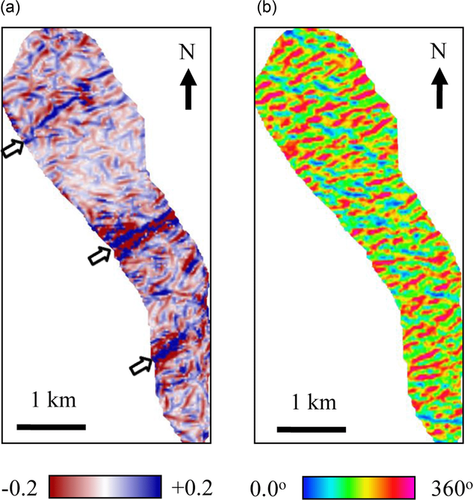
We generate most positive/negative curvature and flexure from a pre-stack depth-migration seismic volume of a fractured reservoir at Teapot Dome in Wyoming (USA), where the subsurface structure is dominated by a northwest-trending anticline, and the hinge zone is populated with bend-induced faults and fractures (Cooper et al. 2002, 2006). The volume is approximately 4 mi × 7 mi (188 inlines × 345 cross-lines) with 266 samples in each trace, and the horizon used for result demonstration in this study is created by 3D auto-tracking an easily recognizable peak within the whole volume and then manually correcting the picks. To facilitate result comparison and demonstrate the added value of the new geometric attributes, we first generate these attributes for the whole volume and then display them along a well-interpreted horizon approximately at 1400 m (Fig. 6a), in which the western edge of the anticline is bounded by a major west-convergent up-thrust fault. The discontinuity attribute (Fig. 6b) clearly highlights the major northeast-trending faults that are already visible from the structure map (denoted by arrows).
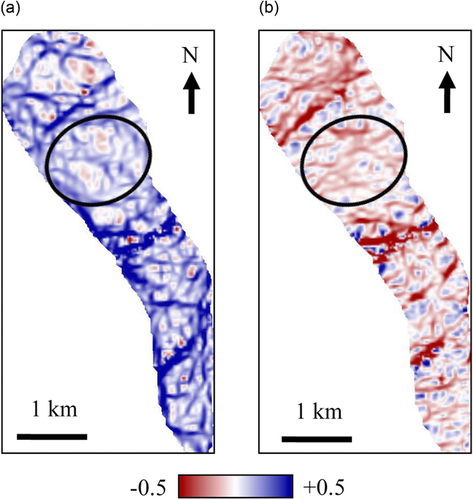
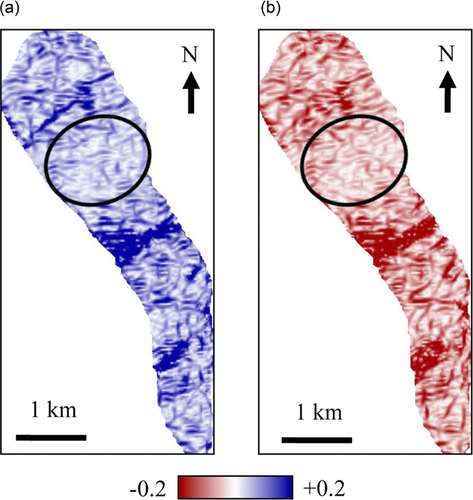
In Fig. 7, we display the magnitude of most positive/negative curvature, which highlights the upthrown and downthrown block of a fault, respectively, with the fault plane being located in between the blocks. In addition to the major northeast-trending faults, curvature helps reveal more detailed information about structural deformation over the fold hinge. Specifically, most positive curvature highlights the anticlinal block of subsurface lineaments, particularly those with a northwest-trending orientation, whereas the synclinal block of the northeast-trending lineaments is highlighted better using most negative curvature (denoted by circles). By generating most positive/negative flexure (Fig. 8), we notice enhancement in the resolution with more lineaments detected as potential faults and fractures (denoted by circles), compared with most positive/negative curvature (Fig. 7).
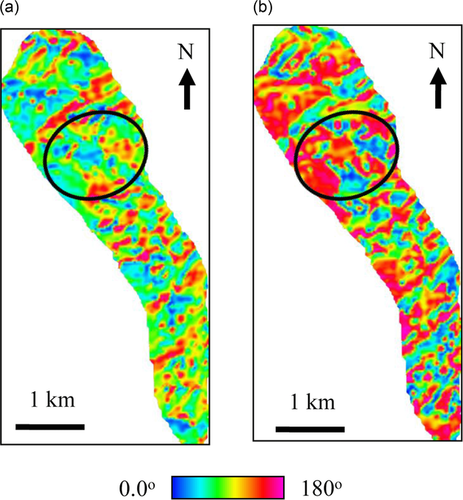
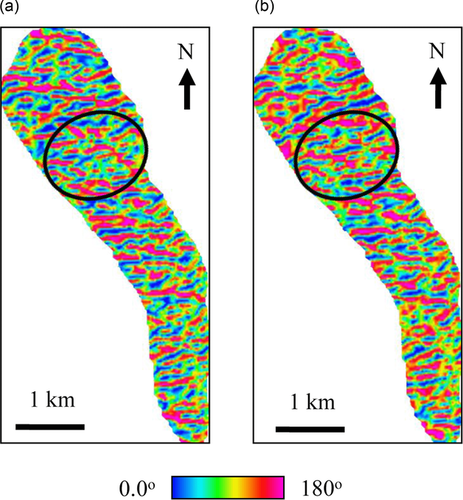
Then, we display the azimuth of most positive/negative curvature and flexure in Figs. 9 and 10, respectively. Both images reveal more structural details of the fractured reservoir than the magnitude property (Figs. 7 and 8). For example, subtle fractures with weak curvature/flexure magnitude across the reservoir crest are clearly defined as lineaments with one particular orientation in the azimuth maps (denoted by circles). Moreover, we notice that curvature azimuth shows potential fractures perpendicular to the fold hinge with a dominant orientation of N60oE, but has a limited resolution on the northwest-trending fractures that have been observed from outcrop and image logs (Cooper et al. 2006; Schwartz 2006). However, flexure azimuth (Fig. 10) not only illuminates these fractures but also defines their orientations in a quantitative manner. Such azimuth could be helpful for quantifying the most likely orientation of faulting and fracturing in the fractured reservoir.
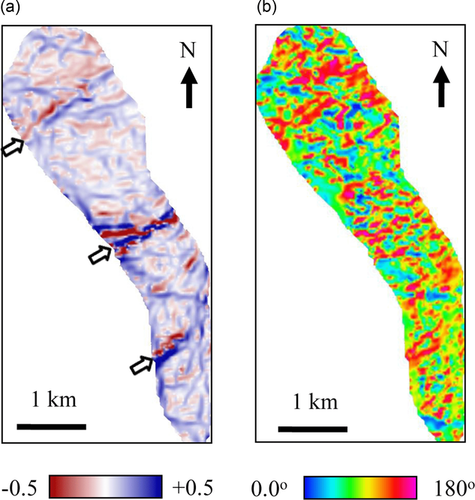
Finally, to demonstrate the advantages of the new analytical methods over previous ones, we compute extreme curvature and flexure, and the attribute images are displayed in Figs. 11 and 12, respectively. Comparisons demonstrate that most positive/negative curvature and flexure are superior to extreme curvature and flexure by providing an edge-type display of lineaments and by improving clarity for fracture interpretation. Moreover, a comparison between Figs. 11 and 12 demonstrates the improved definition of fault location by flexure attribute, instead of fault blocks by curvature attribute (denoted by arrows). In addition to the result comparisons, we also compare computational time for these attributes. The efficiency of most positive/negative curvature is comparable to that of extreme curvature since the latter can also be calculated using an analytical approach (Di and Gao 2014b; Gao and Di 2015). For flexure computation, however, we notice a significant improvement by using an analytical approach on surface rotation rather than a discrete azimuth-scanning approach (Di and Gao 2014c). Table 1 lists the time for flexure computation using two different approaches, and for the Teapot Dome dataset, the new analytical approach is about eight times faster than the scanning one.
| Approach | Extreme (Signed maximum) flexure | Most positive/negative flexure |
|---|---|---|
| Scanning | 16 min 12 sec | 12 min 8 sec |
| Analytical | Not applicable | 2 min 2 sec |
INTERPRETATIONAL APPLICATIONS
In fractured reservoir analysis, fracture intensity and orientation are two fundamentally important properties for robust reservoir characterization and reliable fluid flow prediction. In practice, however, they are very difficult and expensive to define due to the complexity of fracture systems and the lack of sufficient and reliable data in the subsurface. With the aid of the curvature and flexure attributes, their magnitude could be used for predicting the intensity of faulting and fracturing, whereas their associated azimuth could be useful for predicting fracture orientation. In particular, we could apply the newly generated curvature/flexure cubes to: (i) computer-aided decomposition of faults and fractures, which allows interpreters to focus on one particular component for fracture characterization at a time, particularly in a structurally complicating fractured reservoir; and (ii) to automatic mapping of fracture orientation, which allows interpreters to better design the direction of horizontal drilling in the development of unconventional fractured reservoirs.
Computer-aided decomposition of faults and fractures
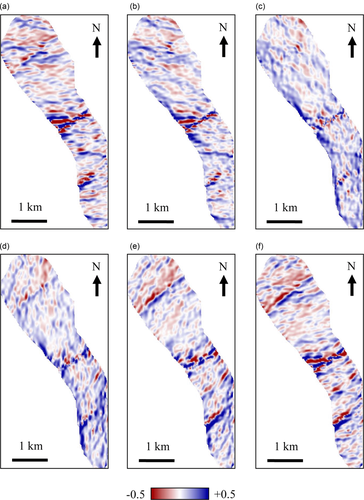
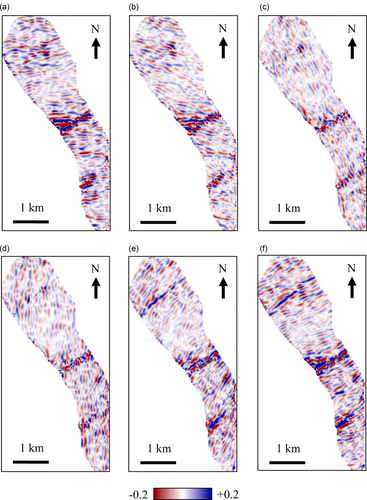
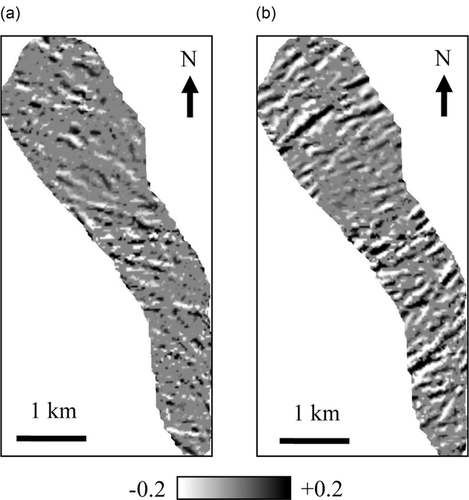
There are two ways that fracture detection along one particular direction can be achieved. One is to compute azimuthal curvature and azimuthal flexure along the desired direction using Equations 2 and 8, respectively. Figs. 13 and 14 show results generated along azimuth (a) 0° (North), (b) 30°, (c) 60°, (d) 90° (East), (e) 120°, and (f) 150°. The northwest-trending lineaments are better detected when curvature and flexure are measured along the azimuth of 30° to 60°, whereas the azimuth of 120° to 150° helps highlight the northeast-trending lineaments. The other way is to use flexure azimuth to decompose a fracture cube (e.g., coherence, ant tracking, and flexure) into different orientations representing different components. In the case of Teapot Dome, as shown in Fig. 15, we could separate the (a) northwest-trending and (b) northeast-trending fractures by partitioning the extreme flexure attribute (Fig. 12a), and the decomposition offers new insights into understanding the regional and cross-regional faulting and fracturing in the fractured reservoir at Teapot Dome.
Automatic mapping of fracture orientation
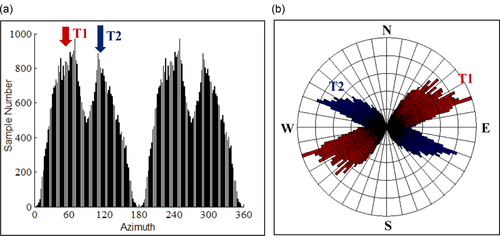
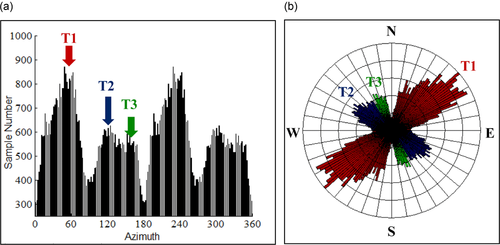
One major goal of fracture interpretation is to measure the orientations of faults and fractures, which directly affect the anisotropy in mechanical properties of fractured reservoirs and the prevailing direction for fluid flow. Therefore, automatic mapping of fracture orientation from 3D seismic data can avoid wasteful drilling in the wrong direction. A popular and useful tool is to plot a fracture histogram and/or a rose diagram that indicates the preferred trends of natural fractures in the intervals of interest. Using the curvature azimuth and flexure azimuth, the histogram/rose diagram can be produced in an automatic manner, avoiding the traditional manual measurements of fracture orientation by seismic interpreters (Blumentritt et al. 2006). Figures 16 and 17, respectively, show the (a) histogram and (b) rose diagram for the picked horizon at Teapot Dome using curvature and flexure azimuth attributes. In particular, as illuminated by flexure azimuth, three sets of faults and fractures are depicted: (i) a hinge-perpendicular set with a strike of about N60°E (T1), (ii) a hinge-oblique set with a strike of about N65°W (T2), and (iii) a hinge-parallel set with a strike of about N25°W (T3). These results are consistent with previous observations reported from outcrops, image logs, and oil production data (Hennings, Olsen, and Thompson 2000; Nelson 2001; Cooper et al. 2002, 2006; Gilbertson 2006; Schwartz 2006; Smith 2008).
DISCUSSIONS
Seismic curvature and flexure represent the second-order and third-order measures of reflection geometry, respectively. The analysis presented here shows that flexure is able to highlight subtle faults and fractures that might not be easily discernible from the popular discontinuity and curvature attributes, and such attribute could be used for improving fracture characterization and network modelling. In particular, curvature and flexure magnitude provides qualitative if not quantitative estimates of deformational intensity of reservoir formations and thus could be used as strain analysis in fractured reservoirs. Curvature and flexure azimuth provides estimates of fracture trends, e.g., the T3 trend (Fig. 17) confirmed by outcrop and well log analysis (Cooper et al. 2006). In addition to the most important magnitude and azimuth properties, flexure sign could also be helpful for differentiating sense of shearing of faults and fractures (Gao, 2013), which is of importance for interpreting kinematics of faults and fractures in complicated structural settings.
Analysis of seismic curvature and flexure should follow seismic reflections for accurate calculation of the first, second, and third derivatives of the reflection geometry. However, most positive/negative curvature and flexure simplify the computation by assuming the first derivatives to be zero without adjusting the second and/or third derivatives in correspondence with the surface rotation; therefore, the result from simplified analysis is only close to accurate curvature/flexure for horizontal or gently dipping horizons. In the presence of structural dip, these measures would undesirably overestimate the magnitude of curvature and flexure attributes and inaccurately define the associated azimuth. In such cases, therefore, seismic curvature and flexure should be evaluated using the proposed workflow with the spatial derivatives of the rotated surface, instead of those of the surface before rotation.
In practice, seismic geometric attributes (dip, curvature, and flexure) could be extracted in either depth or time domain. In theory, however, the best detection could be achieved from depth data, in which lateral variation in reflection geometry truely represents structural deformation of reservoir formations. In the time domain, instead, interpretation should take into account velocity abnormalities, such as low-velocity zones associated with hydrocarbon migration, such as gas chimney. Therefore, reliable time–depth conversion is strongly recommended before generating curvature and flexure attributes, particularly in the areas with complicated velocity distribution.
CONCLUSIONS
Most positive/negative curvature is among the most useful seismic attributes for fault interpretation from 3D seismic data, and the concept could be extended to the third-order flexure attribute for improved fracture characterization and modelling. We have presented new analytical methods for evaluating these attributes, which simultaneously extract both the magnitude and azimuth of most positive/negative curvature and flexure. Compared with extreme curvature and flexure, most positive/negative curvature and flexure provide a edge-type display of faults and fractures to facilitate fault interpretation. Application to 3D seismic data demonstrates not only an enhanced clarity and resolution of lineaments but also a significant improvement of the accuracy and computational efficiency by implementing the analytical approach.
Our new method of computing most positive/negative curvature and flexure, coupled with their associated azimuth, provides a powerful tool for better fracture characterization. These attribute could be used for: (i) computer-aided decomposition of faults and fractures, which allows interpreters to focus on one particular component for fracture characterization; and (ii) automatic plotting of fracture histogram and rose diagram, which allows interpreters to automatically map the orientation of natural fractures in the subsurface.
ACKNOWLEDGEMENTS
The authors would like to thank K. Marfurt for his offer of newly processed pre-stack depth-migrated seismic data over Teapot Dome in Wyoming, and T. J. Moser and two anonymous reviewers for their help in improving the quality of this paper. The work of D. Gao was supported by URS under the URS 2013 Outstanding NETL-RUA Research Award (project activity ID number: 400U.OUTSTANDIRD). This paper is a contribution to the West Virginia University Advanced Energy Initiative (AEI) program.
APPENDIX A: DERIVATION OF EQUATIONS FOR MOST POSITIVE/NEGATIVE CURVATURE
 leads to two real roots φ1, 2 (equation 5). From this solution, we can further calculate the following:
 (A-1a)
 (A-1b)
 and
and  .
.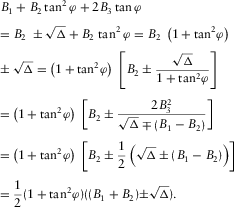 (A-2)
(A-2) (A-3)
(A-3) (A-4)
(A-4) (A-5a)
 (A-5b)
APPENDIX B: CALCULATION OF REAL ROOTS OF A CUBIC EQUATION
 (B-1)
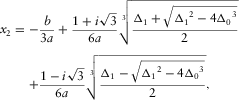
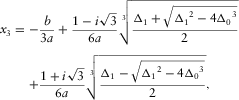
(B-1) . It has three roots, and the general expressions are
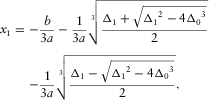 (B-2a)
 (B-2b)
 (B-2c)
 ,
,  ,
,  , and
, and  is the discriminant that distinguishes the three cases of the roots. In each case, equation (B-2) can be simplified for an effective solution of equation (B-1).
 , then there are three distinct real roots. In this case,
  , and
, and when
when  In the complex domain, we have
 (B-3a)
 (B-3b)
 (B-4a)
 (B-4b)
 (B-4c)
 , then the cubic equation has three real roots. By substituting
  into equation (B-2), the roots are
 (B-5a)
 (B-5b)
 , then there is one real root and two non-real complex conjugate roots. In this case,
  is real. Let
  be real, then
 (B-6a)
 (B-6b)
 (B-6c)


 and
and  (Appendix A) (Roberts,

