Physical constraints on c13 and δ for transversely isotropic hydrocarbon source rocks
ABSTRACT
Based on the theory of anisotropic elasticity and observation of static mechanic measurement of transversely isotropic hydrocarbon source rocks or rock-like materials, we reasoned that one of the three principal Poisson's ratios of transversely isotropic hydrocarbon source rocks should always be greater than the other two and they should be generally positive. From these relations, we derived tight physical constraints on c13, Thomsen parameter δ, and anellipticity parameter η. Some of the published data from laboratory velocity anisotropy measurement are lying outside of the constraints. We analysed that they are primarily caused by substantial uncertainty associated with the oblique velocity measurement. These physical constraints will be useful for our understanding of Thomsen parameter δ, data quality checking, and predicting δ from measurements perpendicular and parallel to the symmetrical axis of transversely isotropic medium. The physical constraints should also have potential application in anisotropic seismic data processing.
INTRODUCTION
Thomsen (1986) defined a set of parameters ( , and δ) and brought up weak anisotropy approximations for the phase velocities in a transversely isotropic (TI) medium. These parameters and the linearized approximation are widely accepted and used in the industry. With increasing importance of organic shale as a reservoir rock, laboratory velocity anisotropy measurements on shales are done routinely. The results are usually reported in terms of Thomsen parameters (Vernik and Nur 1992; Johnston and Christensen 1995; Vernik and Liu 1997; Jakobsen and Johansen 2000; Sondergeld et al. 2000; Wang 2002a, 2002b; Sondergeld and Rai 2011; Sone 2012). Of the three parameters, δ is one of the most important parameters for exploration geophysicists since it describes the relation between the normal moveout velocity and the vertical velocity (Thomsen 1986; Tsvankin 2012). Thomsen (1986) pointed out that δ is an “awkward” combination of elastic parameters and its physical meaning is not straightforward. In spite of a large amount of laboratory measurement, our understanding of parameter δ is still not quite clear (Banik 1987; Sayers 2004). The laboratory measurement found that δ has very poor correlation with other Thomsen parameters, and even the rational data range of δ is not certain.
Of the five independent elastic constants ( , and c13) of a TI medium, although theoretically they are free independent variables, good to excellent mutual correlations are found existing between c11 and c66 and between c33 and c44 from laboratory velocity anisotropy measurements on hydrocarbon source rocks samples. Nevertheless, the behaviour of c13 is erratic. The correlations between c13 and the other elastic constants are usually very poor. This might be because estimation of c13 from oblique velocity measurement introduces extra uncertainties compared with traditional ultrasonic measurement. We believe that, for TI hydrocarbon source rocks, there should exist some forms of constraints on c13 if the elastic properties in directions perpendicular and parallel to the symmetry axis are known. If we know the behaviour of c13, then we can constrain Thomsen parameter δ.
THEORY
 (1)
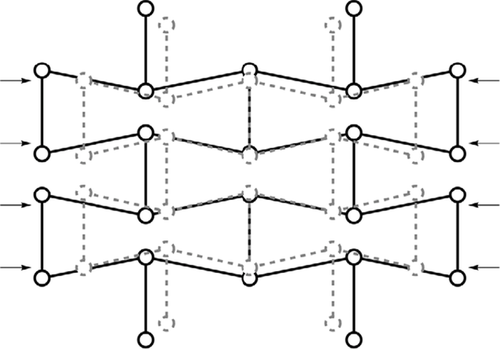
(1)
 (2)
(2) (3)
(3) (4)
(4) (5)
(5) (6)
(6)The coordinate system used for the notation is shown in Fig. 2.
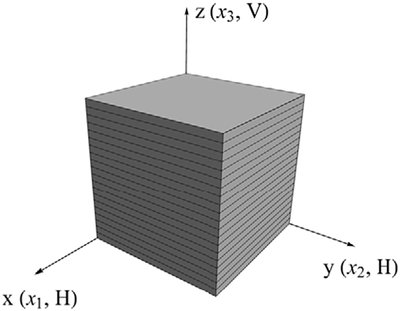
 and
and  :
:
 (7)
(7)For hydrocarbon source rock with TI anisotropy, the Young's modulus in the horizontal direction (parallel to the bedding direction) should always be greater than that along the TI symmetry axis ( ) so that
  .
.
PHYSICAL CONSTRAINTS ON c13 AND δ
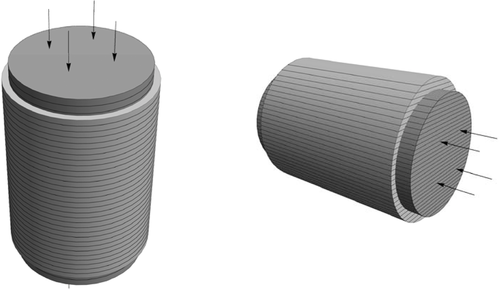
 ). It is physically intuitional that the plug will not shrink transversely under axial compression, and
  is positive. From equation 4 and
  for a TI medium (Dellinger 1991), we get
 (8)
(8)
 and
and  . Since hydrocarbon source rocks are usually stiffer in the horizontal direction (along the bedding) than in the vertical direction (perpendicular to the bedding) (
 ), when under axial compression, the rock is more resistant to deformation (expansion) in the horizontal direction than in the vertical direction. Thus we have
  . If there are fractures perpendicular to the bedding, then it may lead to
  . In this case, the effective medium does not really belong to TI medium. The TI media we considered here are referred to the clastic sediments with TI anisotropy primarily caused by layering effect and preferred orientation of minerals and cracks. If a horizontal plug of this type of media is under uniform axial compression, the passive expansion in the transverse direction is a matter of more (perpendicular to the bedding) or less (along the bedding). There is no compression force in transverse directions according to the definition of Poisson's ratio. The rock does not have the special network structure leading to negative Poisson's ratio. Therefore, there should be no shrinkage in transverse directions. From the above analysis, for hydrocarbon source rocks with TI anisotropy, we have:
 (9)
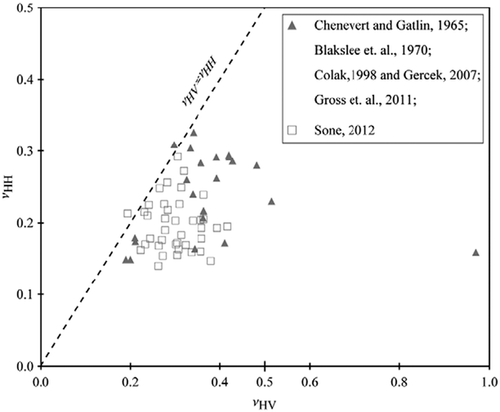
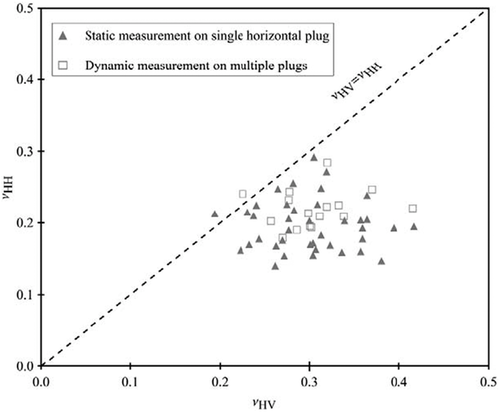
(9)This inequality is the fundamental relation to be used for the derivation of the physical constraints on c13. It is validated by laboratory static mechanic measurement, as shown in Fig. 4. There is an obvious pattern of  . Most of the samples are from organic shales. Here the Sone's data (Sone 2012) are all from static measurement on organic shales. Each pair of
  and
and  is measured on a single horizontal plug. Several samples of synthetic rock-like material with TI anisotropy are included to demonstrate that
  can be higher than the high limit of Poisson's ratio (0.5) for the isotropic medium. If a TI medium is infinitely stronger in the horizontal direction compared with the vertical direction, then
  . The two data points showing
  slightly higher than
  might be caused by measurement uncertainty, and it is also possible that the material should not be classified as a TI medium. We have discussed with Hiroki Sone about the measurement uncertainty associated with the data point having higher
  than
than  in his dataset. This data point is from Barnett-2 (Sone 2012, 2013). It has a dry bulk density of 2.65 g/cc and has weak anisotropy. It is the stiffest rock in his data set, which means that there might be a bigger error in estimation of the strains and the Poisson's ratios. The difference between
 and
and  for this data point is not significant and can be treated as a measurement error.
 , if c13 is a real number and it exists, we must have
  , and we also have
 (11)
(11) (13)
(13) and
and  ), the low bound is equal to
  (for the isotropic medium:
  ), and the upper inequality reduces to
 (14)
(14) (15)
(15) , which means that the P-wave velocity is greater than the S-wave velocity in the symmetry direction. It can be seen that δ monotonically increases with c13 when
  ; thus, substituting the inequality (13) into equation 15 and using Thomsen's (1986) notation, we can get the constraints for δ
 (16)
(16)

 , β0 and α0 are the shear velocity and P-wave velocity along the TI symmetry axis, respectively. ε and γ are defined by (Thomsen 1986)
 (17)
(17)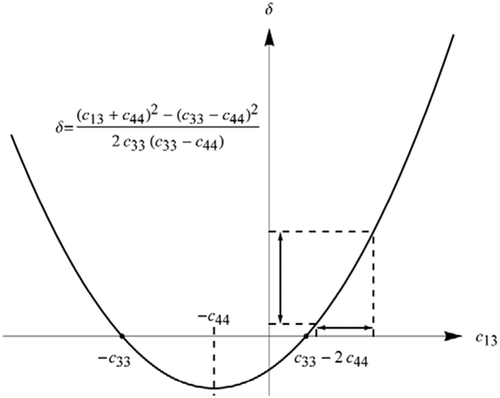
One sees that δ is constrained by other Thomsen parameters, which are all properties in directions perpendicular and parallel to the TI symmetry axis.
 (18)
(18) (19)
(19) (20)
(20)

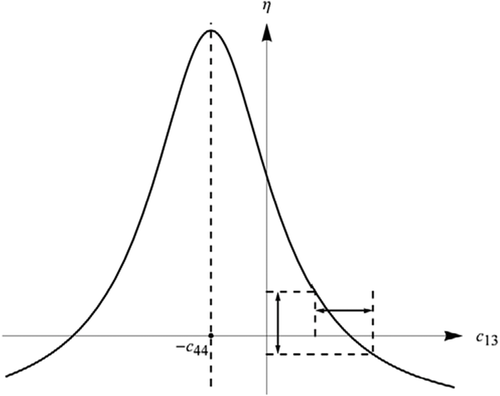
It can also be derived by substituting the constraints on δ(equation 16) directly into equation 18. Obviously, the high bound of δ corresponds to the low bound of η.
LABORATORY DATA AND THE CONSTRAINTS
Figure 7 shows the crossplot between δ and  ratio from ultrasonic velocity anisotropy measurement. The data sources are from Thomsen (1986), Johnston and Christensen (1995), Vernik and Liu (1997), Jakobsen and Johansen (2000), Wang (2002b, shale and coal samples only), and Sone (2012, 2013). The data collected by Thomsen (1986) are from various sources; only data points with anisotropy obviously stronger than the measurement uncertainty (
 and
and  ) are included. Wang's data are corrected for mistaking group velocity for phase velocity in the oblique direction. If there is pressure-dependent measurement, no more than three data points are selected to prevent overweighting effect of this sample. The crossplot is divided into three areas. In the left, several data points have negative
  values. The corresponding c13 values are above the high bound, and they tend to have higher values of δ . In the right area, there are quite a few points with
  . The corresponding c13 values are lower than the low bound, and they tend to have lower values of δ. About two-thirds of the data points lie in the centre area, where we believe that all the hydrocarbon source rocks with TI anisotropy should lie within. The gray point in the center area has negative value of
  , which might be nonphysical as we will discuss later. Since there are much more data points lying below the low bound than above the high bound, there might be a general tendency of underestimating δ. For clarity, we emphasise that the constraints for c13 or δ might be different for each data point. Since these constraints are derived from the relation between the Poisson's ratios, the ratio of Poisson's ratios can be directly used to check whether a data point lies within or outside of the bounds of c13 or δ. Next, we will analyse that most of data points lying outside of bounds might be due to uncertainty in laboratory velocity anisotropy measurement.
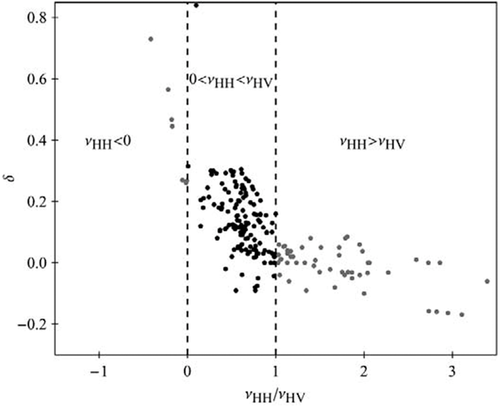
 ratio from dynamic velocity anisotropy measurement. Black points (137) are within the physical bounds, and grey points (66) are outside of the bounds (data sources: Thomsen (1986), Johnston and Christensen (1995), Vernik and Liu (1997), Jakobsen and Johansen (2000), Wang (2002b), and Sone (2012)).
UNCERTAINTY IN LABORATORY VELOCITY ANISOTROPY MEASUREMENT
 (21)
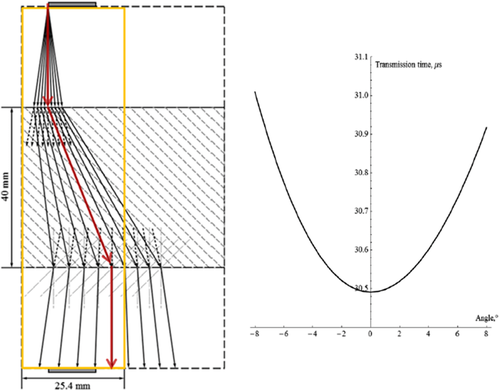
(21) is the phase velocity. As Yan, Han, and Yao (2012) pointed out, this small angle error can have significant effect on estimation of c13 and δ. In Fig. 7, we take only data points satisfying
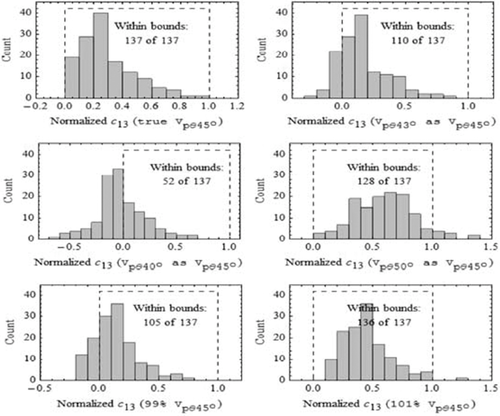
  and assume that the true TI elastic properties are measured. Then taking the phase velocity at phase angles 43°, 40°, and 50°, respectively, as phase velocity at phase angle 45°, we recalculate c13 and check how much difference is made. For display convenience, c13 is normalized by
 (22)
(22)

If  does not lie between 0 and 1, it is outside of the bounds. As we can see in Fig. 8, negative 2° angle error can make about 20% of the data points lie below the low bound; negative 5° angle error can make about 62% of the data points lie below the low bound; and positive 5° angle error can make about less than 8% of the data points lie above the high bound. In the bottom two panels of Fig. 8, we show the sensitivity of velocity measurement error on
  . If the phase velocity in 45° is underestimated by 1%, 22% of the data points move below the low bound. If the phase velocity in 45° is overestimated by 1%, only one data point moves above the high bound. The above sensitivity analyses partially demonstrate why there are more data points lying below the low bound than above the high bound, as shown in Fig. 7.
 (23)
(23)where  is the 45° phase velocity. In practice,
  is usually greater than the P-wave velocity and the S-wave velocity along the TI symmetry axis; hence, the second term under the square root signal should always be positive, which requires that the first term must be positive as well (If not, c13 will be a complex number). Therefore, underestimation of the phase velocity
  will cause underestimation of c13, and sometimes, it even leads to negative or even complex value of c13. As shown in Fig. 5, δ is positively correlated with c13, so it will be underestimated as well. Most of the velocity anisotropy data cited in this study are based on the measurement of cylindrical plugs of 1-inch diameter. The lengths of the plugs are often around 4 cm, which can be longer if the plugs are also needed for static measurement. Therefore, there might be a bias toward underestimation of c13 in the published velocity anisotropy measurement data.
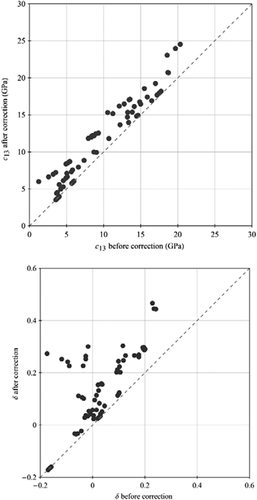
To improve measurement efficiency, Wang (2002a) used a setup based on a single horizontal plug. An oblique velocity must be measured, which is actually group velocity. To calculate c13 and δ, we need to convert the group velocity to phase velocity and find the corresponding phase angle, and then use equation 21 to calculate c13 . Figure 10 shows group to phase correction effect on c13 and δ. It can be seen that, if group velocity is mistook for phase velocity, c13 and δ will be systematically underestimated.
The above analyses explain that why there are more data points lying below the physical constraints of c13 and δ than above the constraints. The data points out of the bounds might be also due to some other factors. For example, the sample has fractures crossing the bedding, which might lead to  . Some samples might have significant heterogeneity on the core plug scale. We sometimes find that the “horizontal” plug is not really “horizontal”: the angle between the bedding and the cylindrical plug axial direction might be more than 5°. In addition, identification of the bedding direction is not always straightforward by naked eyes, and multiple oblique velocity measurements might be needed to identify the bedding direction (Yan, Han, and Yao 2014). In these cases, either the samples do not really belong to the TI medium or the measured elastic properties are apparent properties.
APPLICATIONS
The physical constraints can help us understand the effect of the other Thomsen parameters on δ. In Fig. 11, the δ constraints are plotted as function of  . The range of
  is selected based on laboratory anisotropy measurement on hydrocarbon source rocks. As shown in Fig. 12(a), the
  ratios for shales are distributed around a narrow range of 0.5–0.7. The curves in different colours represent the δ bounds for different combinations of ε and γ. When ε is constant, δ will increase with decreasing γ; when γ is constant, δ will increase with ε. Small δ occurs when γ is much greater than ε. High δ occurs when ε is much greater than γ. It should be remembered that, although ε and γ are theoretically independent variables, there is often fairly good correlation between them from laboratory observation (Sayers 2004). The constraints are less sensitive to the ratio of
  than the other Thomsen parameters. For display convenience, we assume a constant
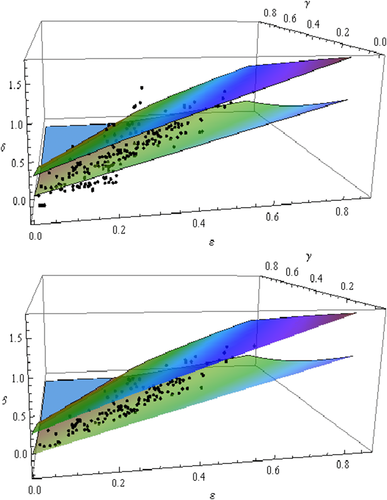
  ratio of 0.55 and then plot the measured data with bounds of δ. As shown in Fig. 13, the trends of the approximated bounds comply well with the laboratory measured data if data points lying outside of the δ bounds are not displayed. The geometry of the bounding surfaces also clearly shows the influence of ε and γ on δ. When
  , the upper bound surface crosses the lower bound surface and disappears. Figure 12(b) shows the histogram of
  from laboratory velocity anisotropy measurement. Of total of 203 data points, there are only 2 data points with
  , which are from Thomsen (1986). We trace the data points to the original report (Lin 1985), and it turns out that one data point is due to data entry error and the other data point is due to signals of substandard quality. Since
  is simultaneously derived with the upper constraints of c13 (equation 11), the laboratory data validate that our assumption of
  is rational.
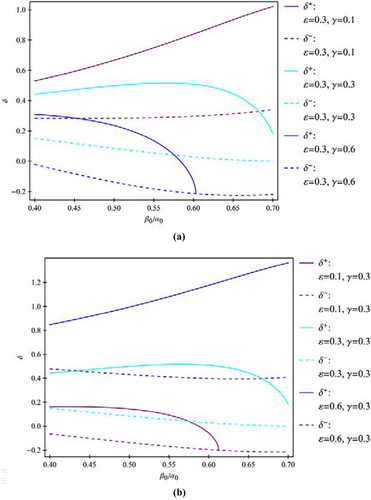
 . Two of the upper bounds are terminating when crossing with the low bounds due to
  , which might be non-physical.
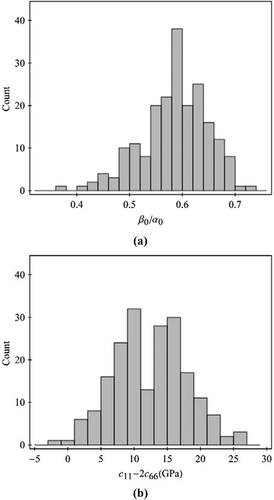
 ratio and (b)
  from laboratory anisotropy measurement. Data sources same as Fig. 6.
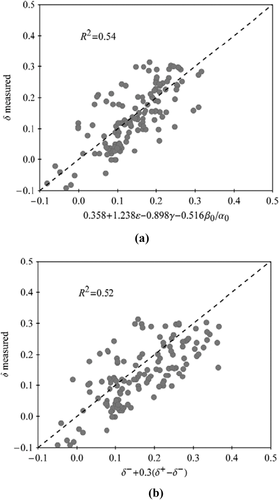
Since δ is constrained by the non-oblique properties, it might be possible that we can approximately predict δ without oblique velocity measurement. In the upper panel of Fig. 14, using data points within the bounds, we directly correlate δ with the other Thomsen parameters. Comparing the coefficients before ε, γ, and  ratio, it is found that δ is more sensitive to ε and γ than the ratio of
  ; δ is positively correlated to ε and negatively correlated to γ . In the lower panel, we use the bounds of δ (equation 16) to predict δ . Considering there are a lot of data points lying out of the bounds, it is reasonable to believe that the data points within the bounds should also have significant uncertainty; thus, the prediction results are encouraging. Also it should be noted that the samples come from all over the world and are in different saturation and pressure conditions.
In practical application of anisotropic seismic data processing, the bounds on δ or η might be very useful in constraining estimation of TI parameters from seismic data. For a certain area under study, if correlation between ε and γ is established, by assuming a certain  ratio, then δ can be estimated as the average of the upper bound and low bound.
DISCUSSION
The physical bounds are brought up with organic shales in mind. They should be applicable to TI sedimentary rocks caused by preferred orientation of minerals and cracks and layering effect. The intrinsic factor causing this type of TI anisotropy is the universal law of gravity. Although this type of rocks represent only a specified type of TI media, they are most common and important for oil and gas exploration. If systematic tectonic fractures cutting through the sedimentary rocks layers or beddings significantly affect the elastic properties, then they should not be approximated as TI media and the bounds we brought up in this study should not apply. The physical constraints are not applicable to TI medium with higher Young's modulus along the TI symmetry axis than that in the direction perpendicular to the symmetry axis. This type of TI medium, although rare, does exist in nature. Basalt rock with column joints (formed by thermal contraction) may be a good example of this type of TI medium. We do not suggest applying the physical constraints on individual mineral crystal, as special crystal lattice structure may lead to negative Poisson's ratio in a certain direction.
Since this study is focused on hydrocarbon source rocks with TI anisotropy, the assumptions about smaller Young's modulus along the TI symmetry axis than that in the direction perpendicular to the TI symmetrical axis and  can be treated as well-known knowledge. The basic assumption for derivation of the physical bounds is
  , which is validated by reasoning and static laboratory measurements.
Rocks are usually not ideally elastic. The magnitudes of bulk modulus, shear modulus, and Young's modulus can vary depending on the magnitude and frequency of the stress applied. Poisson's ratio might also vary under dynamic and static measurements. Nevertheless, the fundamental relations between these parameters, once established, should be same for both static and dynamic measurements. For example, static measurement shows  . For dynamic measurement, c11 and c66 may both be different, but the relation
  should still hold. Figure 15 shows the crossplots between
  and
and  for both static measurement and ultrasonic dynamic measurement using Sone's data (2012, 2013). The organic shale samples come from Barnett, Haynesville, and Eagle Ford shales. The data points from static measurement and dynamic measurement are different. The static measurement is based on strain measurements on a single horizontal plug, whereas the dynamic measurement is based on velocity measurements on five cylindrical plugs with angles 0°, 30°, 45°, 60°, and 90° angles to the TI symmetry axis, respectively. From Fig. 15, no matter static measurement or dynamic measurement, the overall pattern of
  is same.
It should be noted these constraints are for a general TI medium, which does not specify  ,
,  , and it does not require Young's modulus is lower along the TI symmetry axis than that in the direction perpendicular to the TI symmetry axis. The physical constraints on c13 we brought up are for a specified type of TI medium, which is stiffer along the bedding/layering than the TI symmetry axis and does not have a special network structure leading to negative Poisson's ratio; thus, they are much tighter than the constraints by equations 24 and 25.
CONCLUSIONS
For hydrocarbon source rocks with TI anisotropy, the elastic constant c13 are constrained by c11, c33, and c66. Therefore, the Thomsen parameter δ and anellipticity parameter η are constrained by the other anisotropy parameters that can be measured either along or perpendicular to the TI symmetry axis. Using these constraints, we find out that there exist significant uncertainties in laboratory velocity anisotropy measurement. Various factors causing these uncertainties are analyzed. The physical constraints on the Thomsen parameter δ can help us understand the relation between δ and the other Thomsen parameters. Generally, δ increases with ε and decreases with increasing γ. Variation of  of the hydrocarbon source rocks in a certain area is usually small so that δ is less sensitive to
  . We also show that δ can be approximately predicted by the other Thomsen parameters. The physical constraints on δ and η should also have potential application on anisotropic seismic data processing.
ACKNOWLEDGEMENTS
The authors would like to thank the Fluid/DHI consortium sponsors for supporting the consortium and this study. They also thank Hiroki Sone for sharing his dissertation data and answering their queries regarding the data. They thank the reviewers for careful reviewing of the manuscript. Especially, they would like to thank Frans Kets for very careful proofreading, many in-depth comments and good suggestions, and thank Mark Chapman for very pithy comments for improving the manuscript.


 , we have

 we have

 of 0.55. (Above, all the data points in Fig.
  and
and  from static and dynamic measurements on organic shales (data from Sone (


