Float-transient electromagnetic method: in-loop transient electromagnetic measurements on Lake Holzmaar, Germany
ABSTRACT
Lake sediments may serve as archives on paleoclimatic fluctuations, geomagnetic field variations and volcanic activities. Lake Holzmaar in Eifel/Germany is a maar lake and its lacustrine sediments provide paleoclimatic proxy data. Therefore, knowledge about the geometry and, especially, about the thickness of the sediments is very important for determining an optimum drilling location for paleoclimatic studies.
We have developed a floating in-loop transient electromagnetic method field set up (Float-transient electromagnetic method) with a transmitter and receiver size of 18 × 18 m2 and 6 × 6 m2 respectively. This special set up enables in-loop transient electromagnetic method measurements on the surface of freshwater lakes that define the geometry and the thickness of sediments beneath such lakes thus helping to determine optimum drilling locations. Due to the modular design of the new Float-transient electromagnetic method field set up, this system can be handled by two operators and can easily be transported.
Sixteen in-loop soundings were carried out on the surface of Lake Holzmaar. The transient electromagnetic method data could not be interpreted by conventional 1D inversions because of the 3D distribution of subsurface conductivity caused by the lake's geometry. Three-dimensional finite element modelling was applied to explain the observed transients and the 3D conductivity distribution beneath the lake was recovered by taking its geometry into account. The 3D interpretation revealed approximately 55 m thick sediments beneath 20 m deep water in the central part of the lake.
INTRODUCTION
Lacustrine sediments provide excellent paleoclimatic proxy data. Depending on the sediment rates, which vary between 0.1–6 mm a−1, information about the last 200 000 years can be obtained with a yearly resolution. Lake sediments can be used as archives on paleoclimatic fluctuations, geomagnetic field variations and volcanic activities. Even human impact on soil erosion or heavy metal accumulation is preserved (Zolitschka 1998).
Maar lakes act as superior sediment archives as they possess deep and undisturbed bodies of water with reducing conditions at great depth. Steep slopes and plane lake bottoms help to build up laminated sediments by steady deposition in a non-turbulent environment. Drilling cores of several European dry maars (silted up former lakes) and maar lakes have been recovered up to a depth of 200 m. They can be correlated and absolutely dated by varve counting and radiocarbon dating. To find the most promising sites and drilling locations, precoring geophysical and geological surveys have to be carried out (Negendank and Zolitschka 1993).
We applied the transient electromagnetic technique (e.g., Kaufman and Keller 1983; Nabighian and Macnae 1988) to determine the thickness of the sediments beneath Lake Holzmaar, Eifel. Several successful measurements of the transient electromagnetic method on the surface of freshwater lakes and rivers have been reported. Goldman, Gvirtzman and Hurwitz (2004) and Goldman et al. (1996) detected salt water beneath the Sea of Galilee. Barreth et al. (2005) also mapped salt water intrusions beneath a river using a water-borne transient electromagnetic system.
In order to carry out in-loop transient electromagnetic method measurements on the surface of Lake Holzmaar we designed a new floating transient electromagnetic method array, which is used with the existing instruments of Zonge Engineering and Research Organisation Inc. An extensive survey at Lake Holzmaar was carried out. Data were obtained along two profiles at 16 sites across the water surface area.
In general, transient electromagnetic method data are interpreted by 1D inversions. However, a multi-dimensional interpretation is necessary when the data are influenced by lateral conductivity inhomogenities. The data are interpreted by forward modelling using either the finite-difference (Druskin and Knizhnerman 1988; Hördt 1992) or the finite-element technique (e.g., Goldman et al. 1986; Unsworth, Travis and Chave 1993).
3D TEM-inversion algorithms are presently also available (Commer 2003; Haber, Oldenburg and Shekhtman 2007; Martin 2009). However, the application of such algorithms on real data sets is very time consuming and not a straightforward application. The observed transient electromagnetic method data on the Holzmaar are interpreted by forward modelling using a trial and error procedure. A finite-element technique integrated in Comsol Multiphysics (2005) software was used for this purpose.
GEOLOGICAL BACKGROUND OF LAKE HOLZMAAR
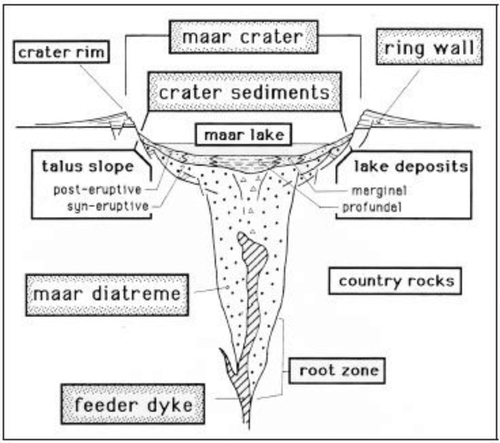
Maars are volcanic craters with a diameter of up to 2 km. According to Noll (1967), maars are formed by strong hydrothermal eruptions. The uprising melt reacts with confined groundwater and fractures the host rock. As the overburden collapses and pressure is released, the superheated water evaporates and blows out the fractured material. The eruption process, which lasts several hours or days, results in a bowl-like depression cut into the surrounding host rock. Most of the maar tephra is transported up to several hundreds of kilometres. Only a small part builds up a confining ring wall as shown in Fig. 1. During the post-eruptive processes a maar lake will form because the groundwater level is undercut by the crater. Mass movements start to fill up the crater and decrease the inclination of its walls (Büchel 1993). At its last stage a maar will only show the resistant diatreme filling as a carved out mountain if erosion and denudation are effective enough.
Lake Holzmaar is the smallest water filled maar of the Quaternary West Eifel Volcanic Field, which is situated 100 km south of Cologne in Germany. The age of the lake is estimated between 40 000–70 000 years. The water body is approximately 290 × 210 m2 wide with a depth of up to 20 m, steep slopes and a plane bottom. A weir built in the late Middle Ages caused the natural water level to rise about 3 m, thus causing the south-western bank to become a shallow bay. The resistivity of the water derived from in situ measurements is pw = 30 Ωm. From the late 1980s to the mid-1990s a total of 18 cores have been recovered from Lake Holzmaar reaching to a sediment depth of 32 m below the lake bottom. They can be dated back 13 000 years establishing a varve year calendar of central Europe (Negendank and Zolitschka 1993).
A NEW FLOATING TRANSIENT ELECTROMAGNETIC METHOD ARRAY
The central loop transient electromagnetic method is well-known and widely used in geophysical prospecting. Common transmitter loop sizes vary from 10 × 10 m2 in Nano transient electromagnetic method systems up to 400 × 400 m2 for greater exploration depths. Water-borne transient electromagnetic method applications have been presented (Goldman et al. 2004; Barrett et al. 2005) in the recent past.
Our aim was to develop a floating transient electromagnetic method array working with the existing devices of Zonge Engineering and Research Inc. For a given resistivity distribution and noise level the depth of investigation of a central-loop transient electromagnetic method sounding depends on the transmitter moment. As the transmitted current of the Zonge equipment used is limited to 20 A, the transmitter loop size has to be maximized. This can easily be done for land measurements but a floating device on the surface of a lake has to be mechanically rigid to avoid errors caused by changing transmitter-receiver geometry.
The design presented consists in about 100 standard PVC tubes, which can be combined in a modular way. Since the PVC tubes are only 2 m long, they can be put together and detached easily. The entire set up is reusable and can be transported in a van.
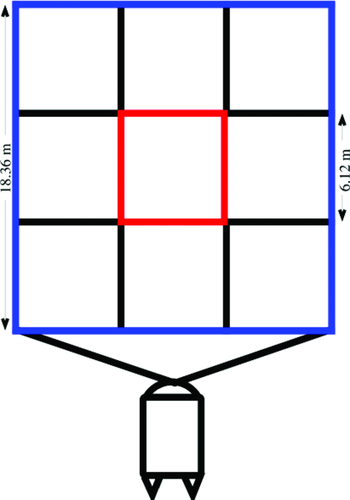
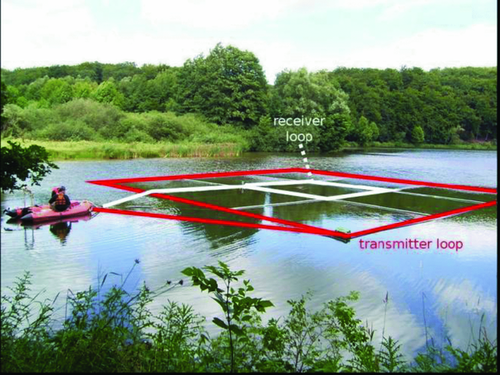
The array consists in 9 squares (6 × 6 m2 each), which add up to a chessboard-like framework of 18 × 18 m2 as shown in Fig. 2. The transmitter loop is made up of a single turn of insulated wire inside the outer edges of the framework. The receiver antenna is placed inside the edges of the innermost 6 × 6 m2 square. With 4 turns a total receiver moment of 144 m2 is achieved. Transmitter and receiver devices, batteries and equipment like GPS receivers are stored in the towing boat. The entire deployment can be set up within a few hours and is operated by two people. Figure 3 shows the measurements with the Float-transient electromagnetic method field set up on Lake Holzmaar.
SURVEY AT LAKE HOLZMAAR
As Lake Holzmaar is a nature reserve, any kind of combustion engine is strictly forbidden. We used an electric outboard motor to manoeuvre on Lake Holzmaar, as shown in Fig. 3. From prior measurements it was discovered that the electromagnetic noise produced by the motor would impair the data quality significantly. Due to strong winds ropes had to be drawn across the lake to avoid drifting while collecting data. Two profiles with 16 sites in total were investigated (Fig. 4a,b). In addition, data at a reference site 250 m outside Lake Holzmaar were collected using a transmitter loop of 50 × 50 m2. As shown in Fig. 5, the data recorded at the reference site can be accurately interpreted by a 1D Marquardt-Levenberg inversion resulting in a model with four layers. The resistivity distribution agrees with the geology assumed. Pyroclastic eruptive rocks form highly resistive overlaying strata. The second layer might be a freshwater saturated aquifer since the upper boundary at a depth of 12 m corresponds to the maar lake's water level. Deeper layers consist of greywacke and shales (Meyer 1988). The resistivity distribution of the subsurface derived from the reference station is used as a background conductivity structure in multi-dimensional modelling.
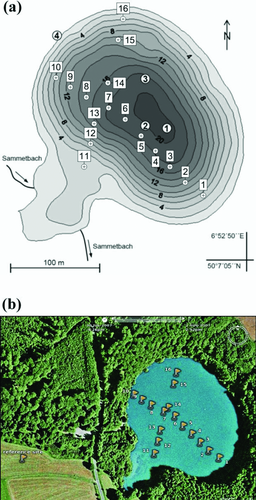

Figure 6 shows Float-transient electromagnetic method data from profile 1, which extends from the south-eastern to the north-western bank (Fig. 4b). The observed transients on Lake Holzmaar could not be interpreted by conventional 1D inversions, which resulted in very high RMS errors (more than 20%) Obviously, the data are severely influenced by three- dimensional effects. All transients recorded on the surface of the lake show a huge dynamic. Taking into account their respective locations on the lake's surface some kind of rotational symmetry of the resistivity distribution is revealed.
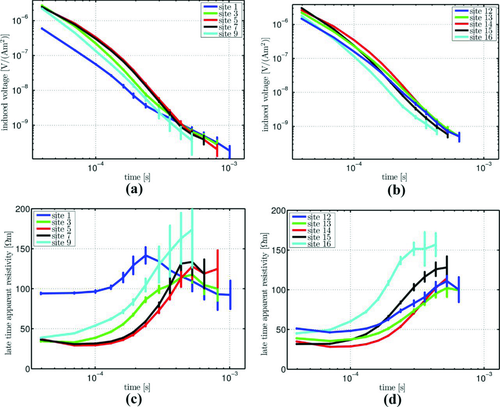
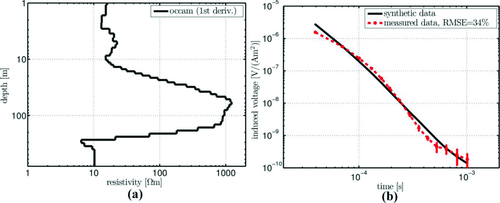
Especially the strong decrease of the induced voltage at t = 2.10−4s indicates a multi-dimensional effect. As an example, the 1D-Occam inversion of data using the first-order smoothness derivative (Constable, Parker and Constable 1987) from station 6 is displayed in Fig. 7. Station 6 on profile 1 (Fig. 4a,b) is located in the middle of the lake and should be least effected by the borders of the lake. 1D Occam's inversion was used to invert the data. A 35% RMS error was obtained and the distinguishing marks of the transient cannot be reproduced by 1D inversion. Therefore, multi-dimensional modelling is necessary to interpret the data. As site 6 is situated approximately in the middle of the almost circular lake, an axially symmetric model is used to interpret the data as a first approximation.
AN AXIALLY SYMMETRIC MODEL OF LAKE HOLZMAAR
An axially symmetric model of a maar lake was set up with COMSOL Multiphysics (COMSOL 2005) as shown in Fig. 8.

The maar consists of a vent, sediments and water. It is integrated into the layered model obtained at the reference site.
- The maximum water depth of the lake is 20 m, its resistivity is 33 Ωm,
- The sediment thickness was considered to be more than 32 m,
- The radius of the maar lake is taken as r = 120 m considering a water surface of 290 × 210 m2,
- The maar has a bowl form. The background conductivity of the reference site model is integrated into the model.
 (1)
(1) (2)
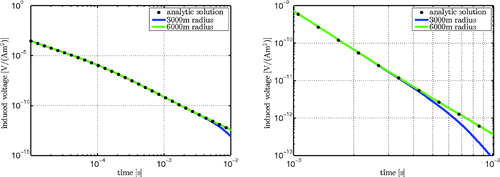
(2)Hence, the induced voltage, being the derivative of the Z-component of the magnetic field, will be inaccurate at a given time if the modelling space is too small compared to the diffusion depth. By comparing calculations of a layered half-space with analytic solutions it was discovered that a modelling space (e.g., the radial distance of the outer border of the model from the rotational axis) of at least 2.5 times as large as the diffusion depth collected at the latest data point yields sufficient results for this case study. A comparison of an analytic solution and the results obtained with COMSOL using different modelling spaces are shown in Fig. 9. A deviation of the transient from the analytic solution for later times can clearly be distinguished for the 3000 m modelling space. Layered approximations of all models shown in this case study were verified using an analytic solution (Mollidor 2008).
Model studies were realized by varying the thickness and resistivity of the sediments beneath the lake using the pseudo 3D model displayed in Fig. 8. The resistivity of the sediments is very important for the model fitting. On the other hand, the resistivities and thicknesses of the vent beneath the sediments have no influence on the model fitting (Mollidor 2008).
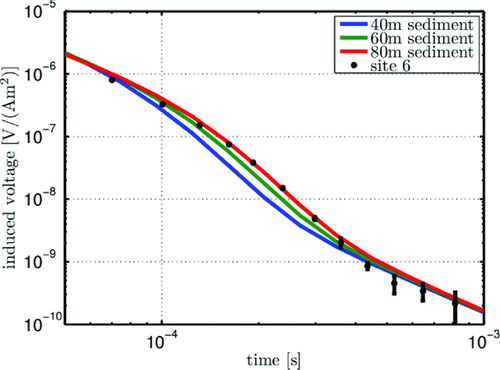
As shown in Fig. 10, the data of site 6 can be reproduced well by sediments with a resistivity of 25 Ωm and a thickness of 80 m. However, these values should be considered as a guess since a lot of simplifications were made.
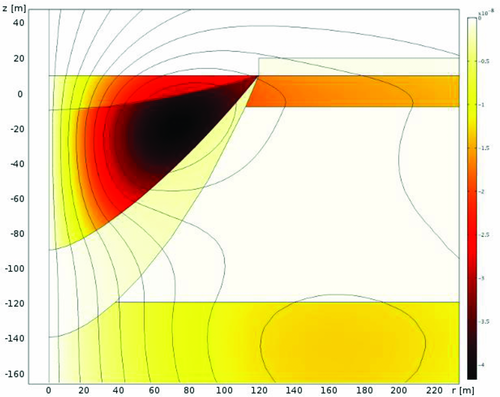
The intense decay of the induced voltage between t = 2.10−4 s and t = 6.10−4 s after transmitter switch-off can be explained by the induced current system being ‘trapped’ in highly conductive sediments. Instead of moving down and outwards, the electric field is deformed due to the shape of the maar as shown in Fig. 11. The maximum of Eϕ is caught at shallow depth until leaping into the surrounding geology causing a huge decrease of induced voltages as seen in Fig. 7.
3D MODELLING
Taking advantage of the rotational symmetry, a relatively short computation time can be achieved. Nevertheless, 3D modelling is indispensable in order to explain the data from both profiles and to illustrate the effect of the shores as shown in Fig. 4(a).
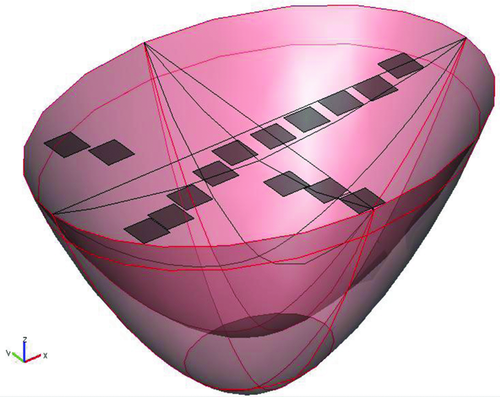
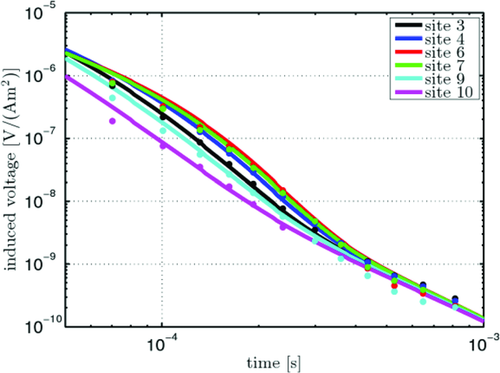
An elliptical model of 290 m × 210 m, which is also integrated into the layered model obtained at the reference site, allows to calculate synthetic data at the exact locations of the receivers on Lake Holzmaar (Fig. 12). As mentioned above, the maar consists in 3 bodies: water, sediment and vent as shown in Fig. 8. The red lines in Fig. 12 represent the outer borders of the maar indicating the interfaces between the maar and the surrounding geology. The black lines indicate the inner borders of the maar and the interface between the water body and the sediments, as well as the interface between the sediments and the vent respectively. The circles on the outer hull of the maar indicate the interfaces of the surrounding geology. The upper one represents the interface between the first and second layer, whereas the lower circle just above the bottom of the vent indicates the interface between layers 2 and 3. The conductivity structure of the surrounding geology is the same as shown in Fig. 8. The new 3D model revealed that the systematic change in the induced voltages measured along the profiles is consistent with the simulation shown in Fig. 13. The best fit for all sites was achieved with a model showing 55 m of sediments in the centre of the lake with a resistivity of 20 Ωm. These results are in good agreement with the geological information obtained at other maar lakes. Synthetic and measured data for several sites of profile 1 are shown in Fig. 13 as an example of relatively good model fitting.
CONCLUSIONS
A transient electromagnetic survey was carried out on the surface of Lake Holzmaar using a water-borne field set-up to derive the thickness of the sediments beneath the lake. The newly developed floating transient electromagnetic method system works well and the data collected are reliable. Due to the small diameter of the lake the data were strongly influenced by non 1D effects caused by the borders of the lake and could only be interpreted using 3-dimensional modelling, representing the first multi-dimensional interpretation of transient electromagnetic method data collected on a lake. The bottom of the sediments seems to be below 70 m. But as the lake's radius is just about 130 m the value is uncertain. Effects caused by the banks and the surrounding geology conceal the sediment thickness.


