Emission Inventory for PFOS in China: Review of Past Methodologies and Suggestions
Abstract
Perfluorooctane sulfonate (PFOS) is a persistent, bioaccumulative, and toxic chemical that has the potential for long-range transport in the environment. Its use in a wide variety of consumer products and industrial processes makes a detailed characterization of its emissions sources very challenging. These varied emissions sources all contribute to PFOS′ existence within nearly all environmental media. Currently, China is the only country documented to still be producing PFOS, though there is no China PFOS emission inventory available. This study reviews the inventory methodologies for PFOS in other countries to suggest a China-specific methodology framework for a PFOS emission inventory. The suggested framework combines unknowns for PFOS-containing product penetration into the Chinese market with product lifecycle assumptions, centralizing these diverse sources into municipal sewage treatment plants. Releases from industrial sources can be quantified separately using another set of emission factors. Industrial sources likely to be relevant to the Chinese environment are identified.
1. INTRODUCTION
Perfluorooctane sulfonate (PFOS) is a synthesized surfactant that has been detected in environmental media all over the world [1–4]. In May 2009, it was listed by the Stockholm Convention on Persistent Organic Pollutants (POPs) as one of the 9 “new” POPs, for its persistent, bioaccumulative, toxic (PBT), and long-range transport properties. PFOS belongs to a larger class of chemicals called perfluoroalkyl acids (PFAs), which are used for their simultaneous hydrophobic and oleophobic properties as surfactants and coatings, as they can repel both water and oils, reduce surface tensions, and act as catalysts for polymerization under high temperatures with stability [5]. PFOS in particular is extremely stable in the environment. It has been found in all environmental media; thus, it has become a priority to understand the ecological risk resulting from PFOS’ production and use.
Until the company’s phase out of all PFOS-related products in 2002, 3M was the world’s largest producer of perfluorooctanesulfonyl fluoride (POSF), the raw material used to manufacture PFOS-based products [6], with a total POSF’s historical production of about 37,809 metric tons [7] from its main production facilities in Decatur, Alabama and Antwerp, Belgium, and Cottage Grove, Minnesota. Currently, China is the only country reported to have continuing production of POSF [8, 9], and the country’s annual production of POSF increased dramatically after the 3M (then, the largest producer) product phase-out in 2002. Increasing production and use of perfluorinated compounds in China have resulted in higher PFOS and PFOA concentrations in human serum, while serum concentrations in the United States have shown a decreasing trend [10]. From the 1980s to the 2000s, concentrations of PFOS in human blood were found to have increased, and, in the Pearl River Delta, PFOS in surface water increased about sixfold in just one year [10, 11].
There still lacks a systemized inventory that is able to accurately account for sources of PFOS to the Chinese environment. A reliable, repeatable, and technically appropriate methodology for estimating PFOS emissions inventory in the Chinese environment has not yet been attempted in the literature, though incomplete emission data has been reported [11–15].
The extremely diverse set of sources of PFOS to the environment and the wide range of consumer and industrial products likely to be sources make the quantification of emission factors very challenging for this particular contaminant. Major sources of PFOS to the environment can include both direct emissions of PFOS salt and indirect sources, which include the atmospheric and biological degradation of precursor compounds into the end product PFOS moiety [16, 17]. Because only a small amount of parent compound POSF actually is made into PFOS, difficult to quantify, and diverse indirect sources are likely to be and have a large contribution to overall emissions, but these are also amongst the most difficult to quantify. Though some national and global emission inventories have been made in the past [16–19], the usage profile composition for China’s national situation is expected to be vastly different from other countries, and thus, such direct reapplication of past studies is not appropriate for China, and a China-specific PFOS inventory framework is necessary. This paper identifies important holes in data for building a PFOS inventory for China and, given conditions of limited survey/questionnaire capabilities, suggests technically appropriate strategies for extrapolating necessary data.
2. PFOS POLLUTION IN CHINA
Firstly, it is helpful to have a rough picture of the national PFOS contamination status. Therefore, data was gathered from past environmental concentration determination from the literature. Data for PFOS concentrations in surface water exists for the following cities: Dalian, Shanghai, Yichang, Nanjing, Wuhan, Chongqing, Shenyang, Guangzhou, Harbin, Tianjin, Beijing, Taihu Lake, Dandong, Tangshan, Huludao, Panjin, Qinhuangdao, Yingkou, and so on [20–37]. Studies on wastewater concentrations of perfluorinated compounds have also been conducted in China [38–40]. There are also several studies showing human blood and milk serum PFOS concentrations [41–47], as well as various animal sera and tissue samples for different regions of the country [48–53].
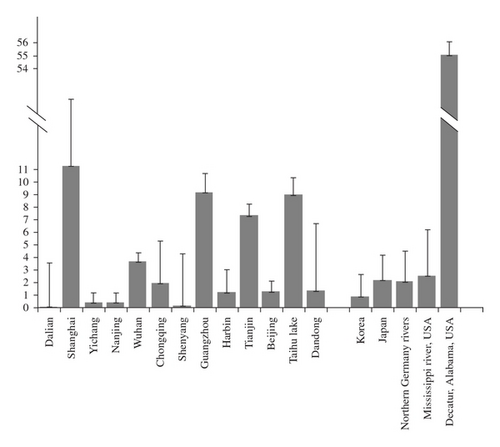
Figure 1 shows that the geometric means of reported environmental concentrations in surface water of most Chinese cities are comparable or lower than locations in other Asian countries and European/North American countries that do not have reported fluorochemical industrial influences [2, 3, 54–56]. However, in cities such as Shanghai, Guangzhou, Tianjin, and the Taihu Lake, concentrations are much higher. Although these cities’ concentrations are still far lower than those measured in Decatur, Alabama, a major historical fluorochemical production facility location, they are higher than environmental concentrations in Japan and the USA, countries in which PFOS has been used commercially and industrially for a much longer time period than that in China.
3. SOURCE DETERMINATION AND CHARACTERIZATION
According to the Stockholm Convention on Persistent Organic Pollutants, although the ultimate goal is elimination of PFOS-based substances, production of these chemicals may continue for limited purposes including coatings for semiconductors, fire-fighting foam, photoimaging, aviation hydraulic fluids, metal plating, and certain medical devices [57, 58]. These areas should be considered as ongoing usages of PFOS.
In 2000, 3M, historically the largest producer of PFOS products, reported global amounts per usage area (surface treatment, paper protection, and performance chemicals), shown in Table 1. It can be seen that the largest POSF (PFOS-based compound parent substance) use area was for surface treatments (2,160 tons), although significant amounts were used in paper treatment (1,490 tons) and performance chemicals (731 tons). Table 1 also shows that sources of PFOS to the environment span industrial PFOS manufacturing, industrial, commercial, and domestic settings.
| Main category | Setting | Applications | Global usage amount (2000)a |
|---|---|---|---|
| Surface treatments | Industrial | Textile mills, leather tanneries, finishers, fiber producers, carpet manufacturers | 2,160 metric tons |
| General public or professional applicators after market treatment | Apparel and leather, upholstery, carpet, automobile interiors | ||
| Paper protection | Paper mills | Food contact applications (plates, food containers, bags, and wraps), nonfood contact applications (folding cartons, containers, carbonless forms, masking papers) | 1,490 metric tons |
| Performance chemicals | Industrial, commercial, and consumer applications | Fire-fighting foams | 151 metric tons |
| Mining and oil well surfactants, acid mist suppressants for metal plating, electronic etching baths, photolithography, electronic chemicals, hydraulic fluid additives, alkaline cleaners, floor polishes, photographic film, denture cleaners, shampoos, chemical intermediates, coating additives, carpet spot cleaners, insecticide in bait stations | 680 metric tons | ||
- aGlobal usage amounts from 3M company estimate [5].
In the production process, electrochemical fluorination (ECF) produces parent compound POSF and residual PFOS. POSF is then used to manufacture PFOS salts (essentially PFOS) and perfluorooctanesulfonamidoethanols (FOSE) and perfluorooctane sulphonamide- (FOSA-) type substances with simple derivatives. FOSE can also be further processed to form higher molecular weight polymers, which are typically used in surface treatments and may contain residual PFOS that may then enter the environment over the product use period. Such precursor compounds themselves have also been shown to degrade to PFOS in activated sludge treatment, biotransformation, atmospheric oxidation, and metabolic processes in rats [59–65]. Finished PFOS-based products contain not only residual PFOS, but also its precursor compounds, which together make up the “indirect sources” of PFOS to the environment explained in more detail later.
The production of this wide array of PFOS-related substances and the use of these products result in emissions occurring as direct PFOS or PFOS salt releases, product residual releases, and breakdown of precursor compounds as shown in Table 2. The diversity of both settings and release pathways results in a very complex overall emission scenario.
| Category | Subcategory | Applications | Environmental source |
|---|---|---|---|
| PFOS salts | K+, Li+, DEA, | Surfactant in fire-fighting foam, surfactant for alkaline cleaners, emulsifier in floor polish mist, suppressant for metal plating baths, surfactant for etching acids for circuit boards, and pesticide active ingredient for ant bait traps. | Direct |
| Amines | Mist suppressant for metal plating baths | ||
| Ammonium Salts | Mist suppressant for metal plating baths | ||
| Amphoterics | Water/solvent repellence for leather/paper. | ||
| PFOS substances (FOSA) | Carboxylates | Antistatic agent in photographic paper. | Degradation |
| Amides | Pesticide active ingredient. | ||
| Oxazolidinones | Waterproofing casts | ||
| PFOS polymers (FOSE) and higher molecular weight substances | Alcohols, silanes, alkoxylates, fatty acid esters, adipates, urethanes, polyesters, acrylates | Soil/water repellence for carpet, fabric/upholstery, apparel, leather, metal/glass | Degradation and residual |
| Copolymers, phosphate esters | Soil/water repellence for carpet, fabric/upholstery, apparel, leather, metal/glass. Oil/water repellence for plates, food containers, bags, wraps, folding cartons, containers, carbonless forms, masking papers | ||
Previous risk assessment and emission inventory studies have shown that the principal emissions medium for PFOS in the industrial waste stream and during the product lifetime has been to the aquatic environment and the atmosphere [5, 19]. Although long-range transport of more volatile precursor compounds has been shown to be a significant source of PFOS in remote areas, in this study, instant degradation to the PFOS moiety was assumed. Because PFOS itself is not considered volatile, it is likely that atmospheric emissions have the fate of the aquatic environment and the pathways focused on releases to the aquatic environment are focused on.
When losses from specific production processes and usage patterns are taken into account for each industry, the industries that historically generate the most PFOS release into the freshwater compartment of the environment are fabrics-service life, paper treatment, chromium plating, fire-fighting foams, and semiconductors [16, 19]. Assuming instant degradation of PFOS substances into PFOS, the above industries contribute over 99% of the total release of PFOS into the UK environment [16, 19]. This percentage represents releases over the complete life cycle to the environment.
4. CHINA PFOS INVENTORY
4.1. Experiences of Other POPs Inventory Research in China
To date, China has completed POP inventories for the oorganochlorine pesticides (OCPs) first listed in the Stockholm convention, PCBs, and dioxins. The largest source of OCPs is its application directly to fields, and, thus, entrance to the soil, air, and aquatic environment. Emissions have been directly estimated based on crop types and land usage areas, application frequency, residual measurements, and climatic factors [66–75], which are generally available through regulatory agencies’ records.
The Chinese PCB inventory was made according to the suggestions of the UNEP Chemicals’ “Guidelines for the Identification of PCBs and Materials Containing PCBs.” In cases where data was incomplete, emission factors based on more readily available indices were utilized [76–79]. A large portion of the PCB inventory also included case-by-case storage area investigation, which required either site visits to inspect the conditions of known storage sites or questionnaires completed by officials [80].
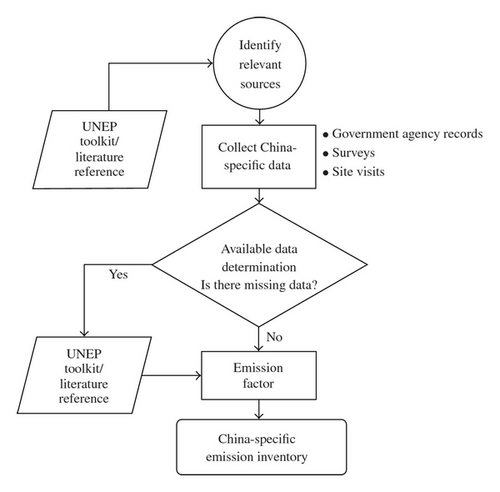
Similarly, a national inventory for dioxins was completed in China with guidance from the UNEP Chemicals’ “Standardized Toolkit for Identification and Quantification of Dioxin and Furan Releases” [81]. Of the 10 identified categories and 62 subcategories of sources of unintentionally produced dioxins (UP-dioxins), it was first determined that most were relevant in China [82]. Next, extensive surveying of relevant industries and sources of UP-dioxins was carried out. When the data collected was not sufficient to calculate an emission factor, default or similar situation emission factors from the UNEP toolkit or from published literature were utilized to make the China-specific inventory (Figure 2).
PFOS has a more diversified set of environmental sources than previous contaminants for which China has accumulated experience. The range of possible PFOS sources covers both industry and consumer use of PFOS-containing products which could release PFOS into the environment over their service lifetimes. Emissions of PFOS-based higher molecular weight precursors must also be understood and quantified as indirect sources of PFOS to the environment. These factors make the emission sources of PFOS very diverse, noncentralized, and difficult to determine.
4.2. Framework for PFOS Inventory Methodology
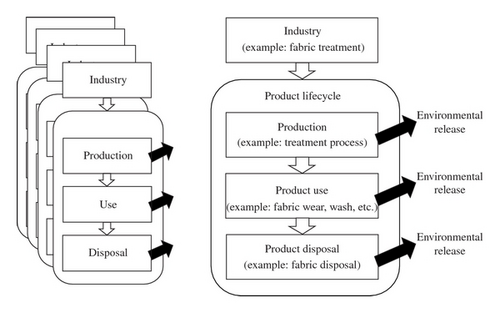
A “lifecycle” PFOS emission inventory, which includes intensive industry consultation for per-industry usage patterns and emission factors from production to use, and disposal, as has been performed in the past for other areas [16, 19], would currently be difficult for China (Figure 3). “Lifecycle” inventory would require industry-specific PFOS data from many dispersed sources, which, to date, are not yet available for China. Industries’ nationwide professional associations (e.g., for the semiconductor manufacture or metal plating industries) are at a low level of organization which may impede the gathering of such an amount of data. In addition the lifecycle inventory would require information about usage lifetime releases of PFOS-containing products, which would necessitate identification of such products and experimentally derived emissions factors. Currently, the penetration of PFOS-containing products in China is unknown, and the behavior of PFOS release from such products has not been determined.
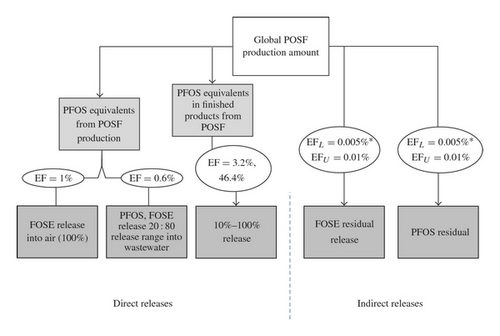
Alternatively, a methodology which bases inventory on direct and indirect release pathways of PFOS that have been performed in the past (conceptualization in Figure 4) cannot be scaled to China because the proportions of direct and indirect release on which the inventory is based are derived from historical usage patterns up until the 2000 3M company phaseout of PFOS products [16, 17]. China’s usage patterns are expected to be vastly different from other countries’ usage patterns; thus, this methodology cannot be directly applied to the Chinese situation.
Given currently available data and the potential of new data gathering, a new methodology is outlined (Figure 5). The suggested methodology separates industrial use/production sources from domestic releases whose preenvironmental release fate is the municipal wastewater treatment system. This methodology is suitable for China’s situation because the penetration of PFOS-containing products into the Chinese market is unknown, and testing of emissions factors for each diverse source would be very time consuming.
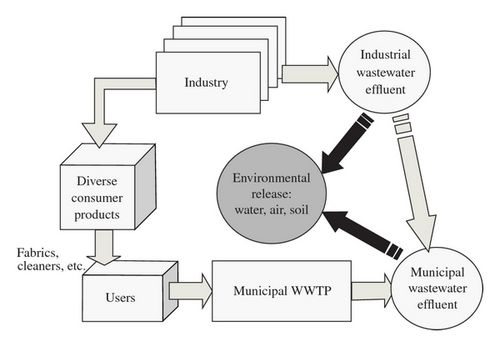
Releases from diverse consumer products are centralized in municipal wastewater. Both residual PFOS and PFOS-precursor compound releases in the indoor environment to air, dust, and water are assumed to enter the wastewater stream, through cleaning, wiping and washing of products and the general indoor environment. Once in the wastewater stream, precursor compounds are expected to break down into PFOS during the treatment process as has been shown in previous research [61, 83]. PFOS concentration data in municipal wastewater effluent with no industrial effluent concentration would be expected to show correlation with geographic specific data, such as population density and local GDP [4, 61]. After the correlation is made, consumer use emissions in all regions can be extrapolated from GDP or population density data.
The second portion of the methodology requires industrial data. Eventually, estimates of PFOS use per industry should be made available in China. Because full industry consultations may be resource and time consuming and not necessary for a preliminary emissions inventory, industrial areas believed to have major contributions to PFOS emission inventory have been selected: POSF manufacture, textile finishing, metal plating, semiconductor manufacture, and fire-fighting foams. The use settings and potential environmental release media points are presented in Table 3.
| Setting | Activity | Primary release media |
|---|---|---|
| Industrial | POSF production | Industrial wastewater |
| Metal plating | Industrial wastewater | |
| AFFF formulation | Industrial wastewater | |
| AFFF use | Industrial wastewater | |
| Semiconductor manufacture | Industrial wastewater | |
| Textile treatment reformulation | Industrial wastewater | |
| Textile fabric treatment | Industrial wastewater | |
| Outdoor | AFFF use | Water, soil |
| Domestic | Fabric/textile use, other products | Domestic wastewater |
4.2.1. POSF Parent Compound Manufacturing Releases: Existing Data
In 2001, China’s annual production of POSF was reported to be just 30 tons [8, 84]. In 2003, POSF began to be produced in China to be used in commercial products, but the annual production was still less than 100 tons [9]. After 2003, annual production grew steadily, with one source reporting production amounts for 2004, 2005, and 2006 as being: 91, 165, 247 tons; respectively, though it is unclear whether the tonnage is recorded for POSF or PFOS [85]. According to the China Ministry of Environmental Protection (MEP) official figures, in 2006, over 200 tons of POSF were produced by 15 Chinese enterprises [9]. Another source reports a 2007 annual production amount of 195 tons of POSF and a 2008 annual production of 250 tons POSF [8]. The discrepancies in POSF production data estimates are presented graphically in Figure 6.
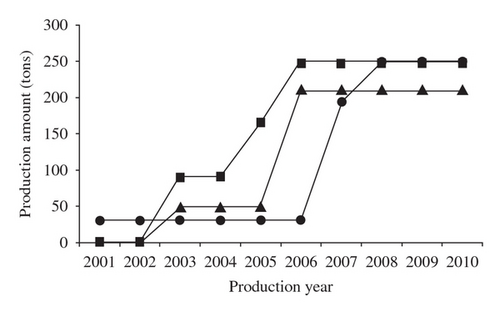
Based on the ambiguity of the POSF manufacturing data, it may be very difficult to get a more precise estimate of domestic POSF production in China. Thus, the above three sources should be pooled together into one data set, with missing years between apparent commercial start date 2003 and the present estimated in a logical way. An uncertainty analysis can then be carried out on the pooled data set for use in estimating PFOS emissions from POSF parent compound production.
4.2.2. PFOS-Related Product Industry Releases: Existing Data
POSF industrial usage information has also been reported in the literature. The China MEP reported that of the over 200 tons of POSF produced in China about half was used domestically [9]. In 2008 it was reported that textile treatment, metal plating, semiconductor production, and fire-fighting foams are the main industries in China that utilize PFOS-based compounds, with POSF consumption amounts of 100 t, 25 t, 0.5 t, and 80 t, respectively, [12].
China MEP has confirmed uses of PFOS-based compounds in the following industries in 2008: textiles (10,000 tons textile finishing agents imported into China/year), sulfuramid-based pesticides (3 tons PFOS/year), aqueous fire-fighting foams (AFFFs) (consume over 100 tons PFOS/year, imported and domestically produced), semiconductors (import about 30–40 kilograms/year), metal plating (25 tons fog inhibitor/year), petroleum, cleaning products, and rubber and plastics. There are suspected usages in the following fields that require additional investigation: leather, paints, papermaking, photography, aviation, hydraulic fluids, photoelectron, nanomaterials, medical equipment, and printing ink. [9].
In 2009, the China Dyeing and Printing Association reported that of approximately 10,200–10,600 tons of fluorinated finishing agent that are used each year in China, 9,800–10,200 come from an imported source and 300 tons are domestically made. All imported finishing agents are diluted [86]. Due to the EU’s ban of imported textiles containing PFOS, the Chinese textile industry has suffered great losses, but is reported to have completely complied with standards. The amount of PFOS in fluorinated finishing agents imported into China is likely under the specified amount required for export to the EU.
A report by the China Metal Plating Association in 2009 reported figures of 30–40 tons of mist suppressant usage on the national level. Figures were available for the regions of Zhejiang Province, Guangdong Province, Chongqing Municipality, and Wuhan Municipality [87].
National data from the fire-fighting industry for China is also available [8]. It can be calculated that AFFFs in China contain about 0.4–0.6% PFOS by weight and that about 28% of AFFF produced is consumed annually [8]. AFFFs are usually utilized in Class B Fires in the United States and Europe (fires resulting from flammable liquids, for example, petroleum fires). We can expect the same to be true for AFFFs in China, as a similar classification of fires exists, and AFFFs are likely to be more expensive than other fire-fighting chemicals. It has been reported that AFFF usages are in large institutions, such as military bases, airports, and petroleum sites [88, 89]. The above are the only data that are available for Chinese PFOS-based product industries.
Because the stage of information gathering can be long and costly, a prioritization of information needed for both preliminary and detailed emissions inventories is provided here. Based on available information and main global source contributions, six Chinese industries have been identified as “priority,” meaning that they will account for the overwhelming majority of the source load. Prioritized industries are: POSF production, textiles, metal plating, semiconductors, AFFFs, and paper treatment (Table 4).
| Industry | Data needed | ||
|---|---|---|---|
| Preliminary | Advanced | ||
| Priority | POSF production | Production amounts | Factory locations |
| China facility waste to air and water values | |||
| Textiles | Amount of treatment formulation imported to China | Industy spatial distribution | |
| Meters of treated fabric | Specific treatment names and amounts | ||
| Dilution factor | Historical situation of treated fabrics export, domestic consumption | ||
| Process % release to wastewater | |||
| Process % release to air | |||
| Metal plating | Tons of PFOS-based mist suppressant consumed | Industry spatial distribution | |
| Process % release to wastewater | National industry’s total square meters of plating | ||
| Process % release to air | Estimate amount mist suppressant used be square meter plating | ||
| Number of platers | Percentage of market using PFOS-based mist suppressant | ||
| Semi Conductors | Production amounts, industry capacity | Industry spatial distribution | |
| Estimate of tons of PFOS consumption | Specific chemical names and PFOS-type substance | ||
| Process % release to wastewater | |||
| Process % release to air | |||
| AFFF | National PFOS consumption amount | AFFF consumption amounts per province | |
| National usage/storage information | Clean-up scenarios | ||
| Expiration scenario | Main institutions: petroleum, airports, military, and so forth. | ||
| Paper treatment | Registration status/current processes | Square meters of treated paper | |
| Total amount PFOS used | |||
| Process release to wastewater | |||
| Process release to air | |||
| Later investigation | Pesticide | Emission scenario study | |
| Cleaning products | Registration status | ||
| Photography | Registration status/current processes | ||
| Aviation | Registration status/current processes | ||
There is no documentation on the use of PFOS in the field of paper treatment; however, previous reports indicate that this industry has been a significant contributor of PFOS to the environment through the breakdown of sulfonamide-based phosphate ester surfactants which degrade into PFOS [19]. Therefore, it is suggested that further investigation be done to determine these surfactants’ use in this area in China. The above priority areas are expected to comprise at least over 95% of PFOS’s total industrial emissions to the environment. Areas identified as “Later Investigation” targets may contribute a small portion of the overall emission amount.
4.2.3. Consumer Use and Disposal Releases
Products, such as higher-molecular-weight PFOS-based compound-treated fabrics have continued-release into the environment during their relatively long service lifetimes and eventual degradation into PFOS. In the past, most PFOS-based compound-treated fabrics may have been exported to Europe, the United States, or Japan because of the higher quality of these goods, but now they may have increased usage within China. Chinese are increasingly able to afford higher-quality goods, so it would be imprudent to rule out the possibility that consumer goods do not contain any PFOS-based chemicals. 3M has previously estimated that as much as 85% of indirect emissions of PFOS come from residual amounts of either PFOS or its precursors in finished products [90]. However, there is currently no methodology that is able to estimate the extent of penetration of PFOS-containing or PFOS-based chemical-containing consumer goods in the Chinese market. As PFOS-based chemical precursors would degrade to PFOS during the treatment process, the suggested methodology in this study centralizes potential PFOS release amounts in municipal WWTPs not receiving industrial influent contribution. These would be expected to show linear correlation with catchment GDP and population density.
It is recommended that data be collected from at least 20 representative areas (cities) of China, from WWTPs that do not receive industrial influent contribution. Thus, releases from service-lifetime usage of PFOS-containing products can be effectively estimated without extensive knowledge about individual products or national consumption habits. After a correlation is found, PFOS load patterns can be extrapolated to other areas of China to estimate the total release from consumer products and wastewater treatment capacities. Several complex estimation stages are pooled together and supported by a quantifiable uncertainty (the standard deviation of the correlation). As opposed to the lifecycle method [16, 19, 90], where estimations must be made based on preidentified industries and individual usage patterns, the centralizing effect of this methodology is appropriate for situations in which not all possible sources have been identified, but it is probable that source contributions would pass through the WWTP system.
4.2.4. Uncertainty Analysis
There are two types of uncertainty that will exist in the suggested methodology: uncertainty in the data and uncertainty in the methodology. Uncertainties in data can partially be dealt with by providing a statistical distribution of a data range for calculation.
The suggested methodology allows for at least a portion of the emission inventory to have a quantifiable uncertainty. Since the correlation between a readily available index (such as GDP or population density) and PFOS load in WWTP effluent will be based on a linear equation, both confidence and standard deviation can be calculated. For industrial data, a range of production values should be accounted for if there are discrepancies in the data. Variations in application techniques would be best represented by a percentage expression of uncertainty, also resulting in a distribution of data.
One way of validating the proposed methodology for a China-specific PFOS inventory is to check it against published environmental concentrations within China. Usually, emission inventory is necessary in order to estimate concentrations in various environmental media using a multispecies fugacity or mass balance model [91–94]. The model output concentrations are essentially a picture of how a certain amount of contaminant would partition in a given environment made up of media compartments of different volumes. Model outputs can be compared with tested environmental concentrations to verify calculations [19, 95–98]. Since there is also an increasing amount of published PFOS environmental monitoring data in the Chinese environment, a backwards fugacity model can be utilized to make an estimation of the original source amount [86]. The source amount output from the model can then be used as a rough estimate of a specific area’s PFOS source load. Although PFOS itself does not readily partition into the atmospheric compartment, a multispecies approach taking into account precursors’ volatility as a pathway to PFOS concentrations in soil can be considered [94].
5. CONCLUSIONS
Environmental monitoring data shows that concentrations in China are rising, while those of other countries which previously had higher concentrations have been shown to be decreasing. However, no emission inventory methodology exists that can appropriately estimate relevant sources of PFOS, given data limitations. Based on a review of currently existing data weighed against challenges of obtaining additional industrial and PFOS product penetration data, a two-part emission inventory methodology for PFOS in China, including wastewater treatment plant effluent PFOS concentration extrapolation, prioritized industry investigation.
Data limitations for use in previous inventory methodologies were identified as a potentially very different PFOS usage profile from past compositions and limited understanding of PFOS-based products’ penetration in the Chinese market.
In order to determine the contribution of service life and consumer use of PFOS-based products on the overall emissions inventory scenario, correlation with local GDP or population density and WWTP effluent PFOS concentrations is suggested. This step allows decentralized sources of PFOS to the environment to be centralized through the municipal wastewater treatment system and for a potential correlation to be made, which can then be extrapolated to estimate emissions for other areas.
A prioritized list of industrial data necessary, based on information on probable main sources of PFOS to the environment in China, is provided. Priority sources requiring more data include POSF production, textiles, semi-conductors, AFFFs, paper treatment, and metal plating. These priority sources are estimated to contribute over 95% of total industrial PFOS emissions to the environment.
ACKNOWLEDGMENTS
This work was supported by the National Special Science and Technology Program for Non-profit Industry, Ministry of Environmental Protection of China (no. 201009026), and the High-tech Research and Development Program of China (no. 2010AA065105).


