Body Composition of Infants With Biliary Atresia
Anthropometric Measurements and Computed Tomography-based Body Metrics
University Medical Center Groningen Trial Registry number: 2018/077.
The authors report no conflicts of interest.
Ethical standards: The study was approved by the local medical ethical committee (reference number 2018/077).
Supplemental digital content is available for this article. Direct URL citations appear in the printed text, and links to the digital files are provided in the HTML text of this article on the journal's Web site (www.jpgn.org).
ABSTRACT
Objectives:
Biliary atresia (BA) causes neonatal cholestasis that requires hepatoportoenterostomy or liver transplantation (LT) for long-term survival. Nutritional optimization is necessary as sarcopenia and sarcopenic obesity have been associated with adverse clinical outcome. Currently, mid upper arm circumference (MUAC) is considered the most accurate indicator. The aim of the study was to determine computed tomography (CT)-based body metrics in infants with BA and to evaluate its correlation with MUAC.
Methods:
We retrospectively analyzed all BA infants below 2 years of age who underwent CT as part of LT screening at our hospital between 2006 and 2019. Measured variables were indexed with length and included: MUAC, total psoas muscle surface area (tPMSA), cross-sectional skeletal muscle area (CSMA), and total abdominal fat area. Intraclass correlation coefficients and Pearson coefficients were calculated. CSMA-to-abdominal fat area ratio was divided in quartiles, the lowest quartile group was considered sarcopenic obese.
Results:
Eighty infants with a median age of 4.6 months at LT screening were included. Intraclass correlation coefficients were: tPMSA = 0.94, CSMA = 0.92, and total abdominal fat area = 0.99. Correlation between MUAC z-score and indices of tPMSA, CSMA, and total abdominal fat area were r = 0.02, r = 0.06, and r = 0.43, respectively. The cut-off for sarcopenic obesity was CSMA-to-abdominal fat area ratio below 0.93.
Conclusions:
In BA infants, it is possible to determine CT-based body metrics during LT screening with very strong interobserver agreement. Poor correlation between CT-based body metrics and MUAC suggests that CT-based body metrics provide additional information on body composition in BA infants, such as relative muscle mass.
What Is Known
- In adults, sarcopenia and sarcopenic obesity at time of screening for liver transplantation have been associated with adverse clinical outcomes, both during the waiting period and after liver transplantation.
- Mid upper arm circumference is currently considered as reference standard for determining paediatric nutritional status.
What Is New
- Body composition of young infants with biliary atresia can be reliably determined on abdominal computed tomography scans performed as part of liver transplantation screening.
- Computed tomography-based body metrics are poorly correlated with mid upper arm circumference, and thus, may provide relevant additional information regarding body composition.
Biliary atresia (BA) is a rare disease of infancy in which obliteration and fibrosis of the intrahepatic and extrahepatic bile ducts leads to cholestasis and liver fibrosis (1.). Treatment of BA primarily consists of Kasai hepatoportoenterostomy (KPE), which results in a successful clearance of jaundice in approximately 50% of cases (2., 3.). Irrespective of the result of the KPE, however, 70% to 80% of children with BA in Western countries will sooner or later develop end-stage liver disease, ultimately necessitating liver transplantation (LT) before adulthood (4., 5.).
Infants with chronic cholestatic liver disease are prone to malnutrition because of several factors: intestinal malabsorption of fat and fat-soluble vitamins, abnormalities in the metabolism of liver macronutrients’ metabolic pathways, depression of hepatic plasma insulin-like growth factors, impeded nutritional intake because of discomfort because of ascites, cholestasis and/or organomegaly, and increased metabolic demands (6.-9.). This multifactorial process can lead to neurodevelopmental delay, decreased bone mineralization, loss of muscle mass, and even to paradoxal increase of fat storage, making these infants prone to sarcopenia and sarcopenic obesity (10.-15.).
In infants with BA, a detailed analysis of the nutritional status has not been easy. A variety of measurements have been developed, such as anthropometric parameters including weight and mid upper arm circumference (MUAC), assessment of daily intake requirements, and laboratory tests, such as serum albumin concentration but their precise interpretation and the correlation between these parameters are rather unclear (16.). Weight alone is unreliable partly because of possible overestimation caused by hepatosplenomegaly and/or ascites (17., 18.). MUAC measurement is a noninvasive, inexpensive, and readily available technique, and has been described previously to assess growth in infants with BA (17.-20.). Therefore, MUAC has frequently been considered the gold standard of nutritional status. MUAC as determinant of nutritional status is, however, imprecise in quantitative analysis of muscle and fat stores, as well as in determining their relative distribution within the body (21.). Sarcopenia at the time of LT screening, however, is associated with waiting list mortality and early posttransplant graft failure and mortality in adults, underlining the importance to obtain reliable information that is not provided by current measures, such as MUAC (18., 22.-24.). Even more at risk for adverse clinical outcome after LT are sarcopenic patients with obesity (25., 26.). Sarcopenia and sarcopenic obesity can be reliably assessed by determining abdominal muscle area at computed tomography (CT) scans in adults (27., 28.). Total psoas muscle surface area (tPMSA) or cross-sectional skeletal muscle area (CSMA) are preferably used (29., 30.). tPMSA has been shown to change in chronically ill adults and children with end-stage liver disease (13., 31.).
The aim of this study was to assess whether CT-based body metrics can be reproducibly determined in infants with BA. In addition, the correlation between CT-based body metrics and MUAC was evaluated.
MATERIALS AND METHODS
Study Population
All consecutive infants with proven BA younger than 2 years of age who underwent abdominal CT as part of a uniform screening protocol for LT at our hospital between May 2006 and February 2019 were retrospectively included in the study. In these infants with end-stage liver disease, CT scans are performed to assess the possibilities of an LT. Our hospital is the single national referral centre for KPE and paediatric LT. Infants who fulfilled the following criteria were included in the study: CT scan and anthropometric measurements obtained no more than 1 week apart from each other, full patient circumference displayed on the CT scan at the third lumbar vertebra (L3) level, and full-dose contrast-enhanced abdominal CT scan in the portal venous phase with a reconstructed slice thickness between 1 and 3 mm. Infants in whom not the complete body circumference at the level of L3 vertebra was displayed at the CT scan, were excluded from the study. The study was approved by the local medical ethical committee (reference number 2018/077).
Patient Characteristics
Data were extracted from the electronic patient charts and the prospectively maintained Netherlands Study group on Biliary Atresia Registry database. CT images were obtained from our Picture Archiving and Communication System. Collected demographic data included gender and gestational age. We divided prematurity at birth into gestational age categories <37, <35, and <32 weeks. Data needed for LT screening, and thus, available for the study included anatomical subtype of BA, age at KPE, clearance of jaundice, and age at LT screening. Anthropometric data included patient length, weight, and MUAC, obtained within 1 week before or after CT scan, which was performed as part of LT screening. Patient length was defined as the distance between head and feet and was rounded to the nearest cm. According to our institutional standard of care protocol, to adequately obtain patient length, the infant lies down with its head and feet placed flat against a board. The infant's legs are straightened and the observer uses nonstretchable measuring tape to measure patient length. Anthropometric measurements were converted to age-adjusted z-scores (32.-34.). Infants were classified as having a normal nutritional status (z-score between −2.00 SD and +2.00 SD) or an abnormal nutritional status (z-score ⩽−2.00 SD).
Radiological Measurements
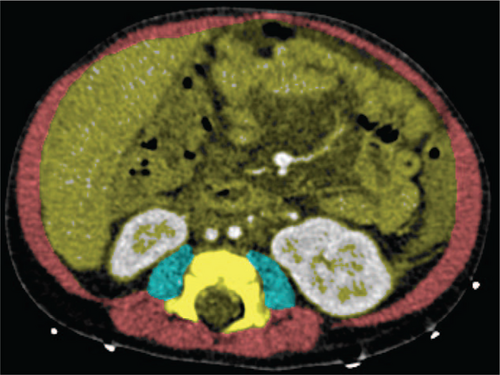
All infants underwent CT imaging of the abdomen as part of LT screening, mainly to determine vascular anatomy and to exclude liver lesions. The quantities of intra-abdominal fat and skeletal muscle area were determined using standard abdominal contrast-enhanced CT scans. Scans were obtained using our standard paediatric liver protocol, with a 512×512 matrix; slice thickness varied from 1 to 3 mm. Cross-sectional areas (in square millimeters) of different tissue compartments were measured on an axial CT slice at the level of L3 vertebra. Muscle boundaries were manually drawn independently by an abdominal radiologist (J.P.P.) and a research fellow (A.L.G.) who was supervised by another abdominal radiologist (R.J.d.H.). Within these borders, muscle and fat were defined based on their specific differences in attenuation. The thresholds used were −29 to 150 Hounsfield Units (HU) for skeletal muscle density, and −190 to −30 HU for adipose tissue (35., 36.). tPMSA, CSMA, and total abdominal fat area within these contours were automatically segmented by in-house developed software (SarcoMeas) (28.). tPMSA was defined as the sum of the left and right PMSA. CSMA concerned the sum of the psoas, abdominal wall, and paraspinal muscle measurements. Total abdominal fat area was defined as the sum of abdominal and subcutaneous adipose tissue areas. Figure 1 shows an example of the determination of CT-based body metrics on an axial CT slice. tPMSA index (psoas muscle index; PMI [mm2/meters2]), CSMA (skeletal muscle index; SMI [mm2/meters2]), and total abdominal fat area index (abdominal fat index; AFI [mm2/meters2]) were calculated by correcting measurements for length in square meters.

Example of determination of computed tomography-based body metrics on an axial computed tomography slice. Transversal determination of computed tomography-based body metrics at the level of the third lumbar vertebra. The blue areas represent tPMSA (−29 to 150 HU), and CSMA is represented by the sum of the red and blue areas (−29 to 150 HU). Total abdominal fat area is not shown in the image but was determined using attenuation values of −190 to −30 HU in the yellow area and in the area between the abdominal wall muscles and skin.
Statistical Analysis
Quantile-quantile plots were used to determine data distribution. Normally distributed data are presented as mean and standard deviation (±SD). Nonnormally distributed data are presented as median and interquartile range [Q1--Q3, IQR]. Categorical data are presented as number and percentage. Interobserver agreement was determined by calculating the intraclass correlation coefficient (ICC) with a 2-way random effects model. Pearson correlation was calculated for normally distributed variables to assess bivariate correlation between PMI, SMI, and AFI with MUAC z-score. Coefficients were interpreted as poor (less than 0.3), fair (0.3--0.5), moderate strong (0.6--0.8), or very strong (at least 0.8) (37.). In the absence of a widely accepted quantitative definition of sarcopenic obesity, we calculated CSMA-to-total abdominal fat area ratio. After dividing infants into quartiles according to this ratio, we defined the lowest quartile group as sarcopenic obese in concordance to the literature (25., 38.). SPSS version 23.0 (SPSS Inc., Chicago, IL) was used for all statistical analyses.
RESULTS
Patient Characteristics
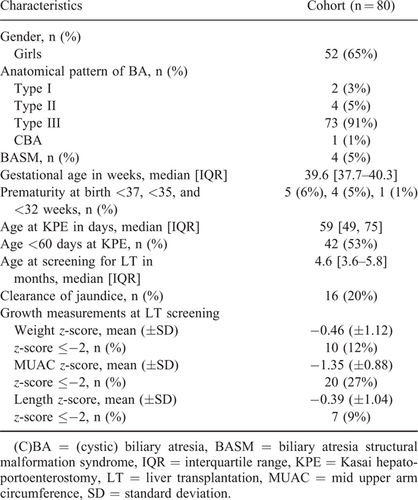
A total of 82 BA infants under the age of 2 years, underwent an abdominal CT scan as part of the LT screening process. Data of 2 infants (2%) were not usable, because of incomplete display of the abdominal muscle area at the level of L3 vertebra. Data from the remaining 80 infants (52 girls, 65%) were analyzed in the study. The median age at the time of KPE was 59 [IQR: 49--75] days. The median age at the time of screening for LT was 4.6 [IQR: 3.6--5.8] months. At LT screening, mean weight z-score was −0.46 (±1.12), mean MUAC z-score was −1.35 (±0.88), and mean length z-score was -0.39 (±1.04), respectively. Other baseline characteristics can be found in Table 1.
Computed Tomography-based Body Metrics
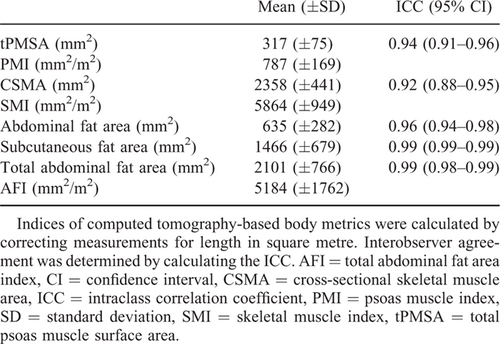
The ICC for determining CT-based body metrics varied between 0.92 and 0.99 (Table 2). The mean values of CT-based body metrics and indices of BA infants at the time of LT screening can be found in Table 2. Intrasubject correlation coefficient of CSMA with tPMSA was moderately strong (r = 0.71, Figure, Supplemental Digital Content 1, http://links.lww.com/MPG/B892). In the total study population, CT-based body metrics were converted to indices and correlated with MUAC z-score. The correlation coefficient of PMI with MUAC z-score was poor (r = 0.02, Fig. 2A). Also, the correlation coefficient of SMI with MUAC z-score was poor (r = 0.06, Fig. 2B). The correlation coefficient of AFI with MUAC z-score was fair (r = 0.43, Fig. 2C). The lowest 25th percentile for the CSMA-to-total abdominal fat area ratio was 0.93, the correlation coefficient of CSMA with total abdominal fat area was fair (r = 0.36). All infants in the lowest quartile group had a normal nutritional status according to MUAC z-score.

Correlation between psoas muscle index (A), skeletal muscle index (B), and abdominal fat area index (C) with mid upper arm circumference z-score. AFI = total abdominal fat area index, LT = liver transplantation, MUAC = mid upper arm circumference, PMI = psoas muscle index, SMI = skeletal muscle index.
DISCUSSION
The present study showed that CT-based body metrics can be reproducibly determined in infants younger than 2 years of age with end-stage liver disease because of BA. tPMSA, CSMA, and total abdominal fat area can be quantified with very strong interobserver agreement with an ICC varying between 0.92 and 0.99. Furthermore, our study demonstrates that CT-based body metrics correlated only poor to fair with MUAC.
The absence of a close relationship between MUAC and inner body composition may be explained by the fact that infants with chronic liver disease are susceptible to changes in body composition (6., 7.). Previous studies in children reported that the accuracy of MUAC in determining fat and muscle mass in the body was limited compared with CT or MRI (39., 40.). Validation of MUAC with Dual-energy X-ray Absorptiometry, however, showed that MUAC is a good predictor of total body fat, but not of total body muscle mass in healthy and chronically ill children (21.). In our cohort, MUAC z-score correlated better with AFI compared with SMI. As SMI is most important in determining nutritional status, CT-based body metrics provide relevant additional data on inner muscle mass.
For years, MUAC has been considered the gold standard for measuring clinical nutritional status in infants with BA (17.-20.). The value of nutritional assessment through MUAC is, however, limited as MUAC is imprecise in quantitative analysis of muscle and fat stores (21.). Hurtado-López et al debate the potential value of arm anthropometrics in evaluating nutritional status of infants and toddlers with chronic liver disease by comparing total, muscle, and arm fat areas calculated with MUAC and total subcutaneous fat based formulas (7.). The arm indicators that separate muscle from fat identified a lower proportion of cases with abnormal nutritional status compared with MUAC (7.). Therefore, MUAC z-scores should be interpreted with caution.
Currently, it is still not known which method (ie, assessment of tPMSA or CSMA) should be used to determine sarcopenia (41.). Measurement of tPMSA has been reported as simple and convenient, and has been stated to be predictive of morbidities in certain conditions (41.). Others have, however, argued that psoas muscle measurements are not representative of CSMA, and thus overall sarcopenia (42., 43.). In the present study, tPMSA and CSMA were only moderately correlated in infants with BA. Therefore, we have decided to include CSMA rather than tPMSA in the definition of sarcopenic obesity. Whether CSMA should be preferred over tPMSA to determine sarcopenia and sarcopenic obesity in infants, however, should be assessed in further studies.
The cut-off for sarcopenic obesity was a CSMA-to-abdominal fat area ratio below 0.93. We are the first to report CSMA-to-total abdominal fat area ratios in infants. Mangus et al observed an overall decreased muscle and increased fat mass on CT in children (mean age of 7.6 years) with chronic liver disease compared with controls (14.). In the literature on adult patients, a low CSMA-to-total abdominal fat area ratio before LT, has been found to be prognostically unfavourable (25.). A remarkable finding is that all infants in the lowest quartile group had a normal nutritional status according to MUAC z-score, suggesting that these sarcopenic obese infants nevertheless maintain normal MUAC values. This can be explained by the fact that our hospital has an intensive feeding protocol and dietary follow-up program for these fragile patients. Infants with BA awaiting LT are hypermetabolic in general and catabolic during fasting (44.). Therefore, adequate nutrition is essential to prevent that caloric intake is stored as fat rather than utilized for reversing the effects of catabolism. CSMA-to-total abdominal fat area ratio in infants with BA seems to provide essential additional information on inner body composition that is not recognized when using MUAC. A decreased CSMA-to-total abdominal fat area ratio may even prompt further investigation into: the progression of the liver disease of the infant and a potential acceleration of candidacy for transplantation.
The strong interobserver agreements are in line with the scarce literature on this topic. Lurz et al (31.) reported an ICC of 0.99 for the determination of tPMSA in children aged 0 to 18 years listed for LT. Our findings regarding the poor to fair correlation between CT-based body metrics and other traditional parameters of nutritional status are in agreement with previous literature that used parameters as weight and albumin level in infants (14., 31.). Therefore, it can be hypothesized that CT-based body metrics provide novel objective nutritional biomarkers for the comprehensive nutritional assessment of children with end-stage liver disease. Determining accurate markers of inner body composition is important as at the time of LT screening, sarcopenia, and even more important sarcopenic obesity, are associated with waiting list mortality and early posttransplant graft failure and mortality in adults (18., 22.-26.). In future studies, the potential correlation between CT-based body metrics and peri- and posttransplant outcomes in children should be investigated.
Our study has several limitations. First, because of its retrospective nature, 2 infants had to be excluded because of inadequate display of the complete abdominal muscle area at CT. Second, radiation protection has to be kept in mind, and thus, CT-based body metrics seem only applicable to infants who have a primary diagnostic reason to perform a CT scan, such as determining the vascular anatomy in preparation for an LT. Thus, it is not recommended to perform CT scans solely to assess CT-based body metrics. Third, reference values for tPMSA of healthy children only exist for ages between 1 and 16 years (45.). As our population consisted of infants with a median age of 4.6 months, we could not compare tPMSA values with existing validated reference values. Fourth, in our cohort, 12% of infants was born prematurely. As it is still unknown whether prematurity leads to changed body composition, especially increased fat mass, the relatively large percentage of prematurity could have influenced our results (46.-48.). Finally, we do not have reliable data on the day-to-day muscle activity of these infants. We speculate that, in the light of the feeding attention that these infants receive, the optimization of the child's condition could be found in “training” of muscle tissue as the only viable option for intervention.
In conclusion, in infants with BA under the age of 2 years, it is possible to determine CT-based body metrics during LT screening with very strong interobserver agreement. The present study shows that CT-based body metrics provide additional, relevant information on inner body composition in infants with biliary atresia that is not available when using MUAC alone. These findings could be the basis for future studies investigating nutritional status by using CT-based body metrics, as well as evaluating their potential impact on transplant outcomes.
Acknowledgments
We would like to thank T. Dijkstra, RD for dietary advice and M. El Moumni, MD, PhD epidemiologist for assistance in performing the statistical analyses.


