Lactulose
Mannitol Diagnostic Test by HPLC and LC-MSMS Platforms
Supplemental digital content is available for this article. Direct URL citations appear in the printed text, and links to the digital files are provided in the HTML text of this article on the journal's Web site (www.jpgn.org).
The Etiology, Risk Factors and Interactions of Enteric Infections and Malnutrition and the Consequences for Child Health and Development (MAL-ED) Project is carried out as a collaborative project supported by the Bill & Melinda Gates Foundation. This work was further supported by a global health grant entitled “Improved Biomarkers for the Assessment of Environmental Enteropathy” by the Bill & Melinda Gates Foundation (OPP1066146) to M.K. G.O.L. was supported by a National Institutes of Health International Maternal and Child Health Training Grant [T32HD046405] (PI Dr Joanne Katz) and a Proctor & Gamble Doctoral Dissertation Fellowship, awarded by the Johns Hopkins Bloomberg School of Public Health.
The author reports no conflicts of interest.
ABSTRACT
Objectives:
The lactulose:mannitol (L:M) diagnostic test is frequently used in field studies of environmental enteropathy (EE); however, heterogeneity in test administration and disaccharide measurement has limited the comparison of results between studies and populations. We aim to assess the agreement between L:M measurement between high-performance liquid chromatography with pulsed amperometric detection (HPLC-PAD) and liquid chromatography-tandem mass spectrometry (LC-MSMS) platforms.
Methods:
The L:M test was administered in a cohort of Peruvian infants considered at risk for EE. A total of 100 samples were tested for lactulose and mannitol at 3 independent laboratories: 1 running an HPLC-PAD platform and 2 running LC-MSMS platforms. Agreement between the platforms was estimated.
Results:
The Spearman correlation between the 2 LC-MSMS platforms was high (ρ ≥ 0.89) for mannitol, lactulose, and the L:M ratio. The correlation between the HPLC-PAD platform and LC-MSMS platform was ρ = 0.95 for mannitol, ρ = 0.70 for lactulose, and ρ = 0.43 for the L:M ratio. In addition, the HPLC-PAD platform overestimated the lowest disaccharide concentrations to the greatest degree.
Conclusions:
Given the large analyte concentration range, the improved accuracy of LC-MSMS has important consequences for the assessment of lactulose and mannitol following oral administration in populations at risk for EE. We recommend that researchers wishing to implement a dual-sugar test as part of a study of EE use an LC-MSMS platform to optimize the accuracy of results and increase comparability between studies.
Environmental enteropathy (EE) is a syndrome of altered small intestine structure and function described among developing world populations with high exposure to enteric pathogens. Characterized by partial villus atrophy and crypt hyperplasia 1, EE has been associated with reduced absorptive capacity, increased permeability 2, and chronic intestinal inflammation 3. EE is hypothesized to underlie the negative synergistic relation between undernutrition and enteric infections observed among children living in poverty 4, as well as to explain oral vaccine failure and the relatively disappointing results of both nutritional interventions and diarrheal disease control measures in improving child growth.
The lactulose:mannitol (L:M) test has been the most popular dual-sugar test used to assess intestinal barrier function for more than 3 decades 5-11. The absorption of the monosaccharide mannitol and the disaccharide lactulose are often said to reflect transcellular and paracellular permeability, respectively, such that mucosal cell damage and damaged tight junctions are associated with decreased mannitol absorption and increased lactulose absorption 12. Although this model remains controversial 11, the L:M test is of evident usefulness in identifying malabsorption and altered permeability among patients experiencing disorders such as celiac disease and inflammatory bowel disease 13, and is the principal diagnostic test of altered gut integrity in the context of studies aiming to quantify the causes and consequences of EE. For instance, it has been used in studies relating the effect of nutrition or sanitation-based interventions to the gastrointestinal health of the child living in poverty 14-20, and several reports have found the L:M ratio (or the excretion ratios of mannitol or lactulose individually) to be associated with growth faltering among at-risk infants 2, 21, 22.
Despite the test's promise, the utility of the L:M ratio to EE research remains constrained. Heterogeneity in the testing protocol, instrumental performance, and reporting does not allow for the comparisons of reported values across studies. Differences in the testing protocol, related to the dosage of sugars given, the solution osmolarity, and the urine collection time, are known to affect urine sugar concentrations and therefore the final L:M ratio 23. Adding to these methodological issues, differences between high-performance liquid chromatography (HPLC) platforms and protocols are recognized to lead to differences in test performance 24, which are different than earlier and classic studies using enzyme-based assays 9, 10, 25. Reported L:M ratios may refer to excretion ratios (the ratio of administered lactulose excreted to administered mannitol excreted), or to concentration ratios (the ratio of the absolute urinary concentration of lactulose to mannitol, wherein concentrations are in milligrams or millimoles per liter).
There are no international reference or measurement standards that facilitate the standardization of the lactulose and mannitol assay. Because L:M values cannot be compared with confidence between laboratories, the point above which a test result is interpreted as “abnormal” is generally defined on a study-by-study or laboratory-by-laboratory basis. Although reference values for small numbers of healthy children have been published 26, to date it has not been possible to reliably relate these values to populations wherein EE is believed to be prevalent. Greater comparability would make it possible to accurately diagnose a child as having an “abnormal” L:M ratio according to a universal, rather than a relative and study-specific standard. This would facilitate epidemiological research by allowing inferences about the comparative prevalence and intensity of EE between populations.
To estimate platform performance over a range of concentrations, we compared absolute urinary concentrations of lactulose, mannitol, and the L:M ratio between 3 independent laboratories: 1 running an high-performance liquid chromatography with pulsed amperometric detection (HPLC-PAD) system and 2 running liquid chromatography tandem mass spectrometry (LC-MSMS) systems, in 100 samples from a cohort of Peruvian infants considered at risk for EE.
METHODS
The Etiology, Risk Factors and Interactions of Enteric Infection and Malnutrition and the Consequences for Child Health (MAL-ED) birth cohort is an ongoing longitudinal multicountry investigation of enteric infection, morbidity, and dietary intake as they affect child development 27. The Peruvian community of Santa Clara de Nanay is 1 of 8 sites participating in this study, which was designed to follow approximately 200 mother–child dyads per site through 24 months of age. Recruitment was ongoing between January 2010 and February 2012. All healthy singleton newborns born to mothers living in the study catchment area, who were at least 16 years old, without another child participating in the study, and who were not planning to travel in the near future were invited to enroll.
Per the MAL-ED protocol, the L:M test was administered to each infant at 3, 6, 9, and 15 months of age. Participants were fasted for a minimum of 2 hours before and 30 minutes following the administration of the disaccharide solution, with the exception of breast milk, which was permitted ad libitum. The solution included 250 mg/mL of lactulose and 50 mg/mL of mannitol (1002 mOsm/L), at a dose of 2 mL/kg up to a maximum of 20 mL. Children were encouraged to void before solution administration, and a urine collection bag (Thermo Fisher Scientific, cat. #22275347, Rockford, IL) was placed and changed as needed for the following 5-hour period. Urine volume was measured following voiding and 1 two 2 drops of chlorhexidine (2.35%; Sigma-Aldrich, St Louis, MO) were added, and samples were aliquoted and stored on ice to limit bacterial growth. Urine aliquots were stored at −70°C before testing. Three additional 5-hour urine collections from children from the same cohort, who were between 3 and 15 months old and who had not been given the disaccharide solution on the same day, were also performed.
Between May 2011 and November 2012, a substudy was completed to determine the validity of L:M results between HPLC and LC-MSMS platforms. From among all of the L:M tests administered by May 2011, 100 samples, whose urinary lactulose and mannitol concentrations had previously been determined by the HPLC-PAD system described below, were selected for additional testing for lactulose and mannitol on 2 LC-MSMS systems. Testing in all 3 laboratories was blinded. Because it was hypothesized that accuracy may be associated with concentration, the sample selection included a subset of samples stratified by the concentration of analytes based on data from the HPLC laboratory. Because it was further hypothesized that interfering substances may be present that affect assay performance, and that the composition of urine may be age dependent, samples were also stratified by age. This included 5 relatively low and 5 relatively high-concentration urines from 3-, 6-, and 9-month-olds; and 9 relatively low- and high-concentration samples from 15-month-olds (39 total samples). In addition, 18 three-month urines, 19 six-month urines, 19 nine-month urines, and 5 fifteen-month urines were selected at random from a list of available specimens without regard for analyte concentration (61 randomly selected samples from a pool of ∼143–15 samples available per age point) (Fig. 1).
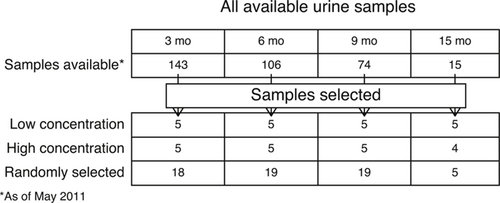
Flow diagram of selection of samples for study inclusion.
Lactulose and Mannitol Determination
HPLC-PAD (University of Ceara, Fortaleza, Brazil)
For HPLC testing, 50 μL of each urine sample is diluted with 50 μL of melibiose solution (3.6 mmol/L) and completed with distilled and deionized water up to 2.9 mL. All samples are filtered (0.22 μL) and 50 μL from each sample is automatically injected into the HPLC column system.
The ICS3000 carbohydrate analyzer HPLC system (Dionex Co, Sunnyvale, CA) is composed of the following modules: AS3000 Automated Sampler for injections, SP3000 Gradient Pump, DC Detector/Chromatography module with column, and ED40 Electrochemical Detector. A CarboPac MA-1 anion-exchange column (250 × 4.0 mm i.d., pellicular resin) with an associated guard column is also from Dionex. Elution of the sugar alcohols, monosaccharides, and disaccharides is achieved with an isocratic eluent of 480 mmol/L NaOH at a flow rate of 0.4 mL/min using the SP3000 and MA1 CarboPac column. Column temperature is set at 30°C. Detection uses the ED3000 detector with a waveform consisting of the following potential–duration profile: sampling 0.1 V, 200 ms; oxidation 0.10 V, 400 ms; reduction −2 V, 410 ms and −2 V, 420 ms; oxidation 0.6 V, 430 ms; reduction −0.1 V, 440 ms and −0.1 V, 500 ms. Output range of the detector is set at 1.0 mA with integration response time of 3 seconds as previously reported. A 50-μL volume of each sample is injected automatically using the AS3000 Automated Sampler. Sugars were identified and measured using Chromeleon 6.8 software package (Dionex).
LC-MSMS 1 (Mayo Clinic, Rochester, MN)
Reagents and Calibrators
Calibrator solutions were prepared from serial dilutions of 10 mg/mL mannitol and 40 mg/mL lactulose (Sigma-Aldrich, St Louis, MO) diluted in HPLC-grade water. Internal standards contained 750 μg/mL mannitol 13C6 and lactulose 13C12 (Sigma-Aldrich).
The previously collected pooled blank urine samples (collected in the absence of administration of lactulose and mannitol) was spiked with independently prepared solutions containing serial dilutions of 10 mg/mL for assay validation and for quality control on all runs. Linear responses in the calibration equation were observed with an r > 0.999 in the range of mannitol 0.5 to 2000 μg/mL, −0.125 to 500 μg/mL for lactulose with precisions of 5% to 10% CV.
Sample Preparation
Each urine sample was thawed and vortexed for 10 seconds. A volume of 50 μl of sample was diluted in a mix of 100% acetonitrile containing an internal standard and incubated for 5 minutes, then vortexed for 1 minute and filtered using a 96-well filter plate.
HPLC-MSMS
The HPLC-MSMS system was composed of API5500 with MPX HPLC system with turbo-ion probe (ESI) operated at 550°C in the negative mode. The analytical column used was Phenomenox Luna NH2 5 μm 250 × 4.6 mm 100A (Phenomenox, Torrance, CA) with a flow rate of 1.2 mL/min at room temperature. Mobile phase B was HPLC-grade water with 1 mmol/L ammonium formate, and phase A was acetonitrile with 1 mmol/L ammonium formate. Elution was programmed to start at 80% phase A for 0.5 minute, then fall to 30% B at 2.5 minutes, return to 80% A at 5.5 minute, and equilibrate for 1 minute before the next sample injection. The MRM transitions monitored are listed with the retention times in Appendix Table 1A (http://links.lww.com/MPG/A342).
LC-MSMS 2 (Oregon Analytics, Eugene, OR)
Reagents and Calibrators
Calibrator solutions prepared via serial dilutions of 10 mg/mL mannitol and lactulose (Sigma-Aldrich) diluted in HPLC-grade water. Internal standards contained 0.01 mg/mL mannitol 13C6 and lactulose 13C12 (Sigma-Aldrich). Pooled blank urine (urine collected before the administration of lactulose and mannitol) was spiked with independently prepared solutions containing serial dilutions of 10 mg/mL for assay validation and for quality control on all runs. Linear responses in the calibration equation were observed with an r > 0.999 in the range of 10 to 4000 μg/mL for both lactulose and mannitol with 95% confidence intervals of 2%. A second transition was monitored for each analyte to confirm identity and required to be within 20% of the relative peak area of the first transition used for quantification.
Sample Preparation
Each urine sample was thawed and vortexed for 10 seconds. A volume of 20 μl of sample was diluted in a mix of 70% acetonitrile containing internal standard, 0.1% sodium acetate and diluted 1:4 in MS-grade water, transferred to the autosampler vial, and vortexed for 10 seconds.
HPLC-MSMS
The HPLC-MSMS system was composed of an LC-Shimadzu prominence LC20AD (Shimadzu Scientific Instruments, Columbia, MD) with an ultramino 3 μm 150 × 2.1 mm 100A aminopropylsilane Restek column (Restek, Bellefonte, PA) with a flow rate of 0.30 mL/min with degasser and autosampler SIL-20AC HT (Shimadzu Scientific Instruments) and column oven CTO-20A (Shimadzu Scientific Instruments) run at 40°C. Mobile phase A was HPLC-grade water with 0.1% formic acid, and phase B was acetonitrile with 0.1% formic acid. Elution was programmed to start at 70% phase B for 0.5 minute, then fall to 5% B at 2 minutes, return to 70%B at 2.5 minutes, and equilibrate for 2 minutes before the next sample injection.
MS/MS-API 5500 (AB Sciex, Framingham, MA) with turbo-ion probe (ESI) operated at 600°C. The transitions monitored are listed with the retention times in Appendix Table 2A (http://links.lww.com/MPG/A342).
Statistical Analysis
Concentrations of lactulose and mannitol are reported in units of millimoles per liter throughout this report (geometric means and 95% confidence intervals [95% CIs]), and L:M ratios are reported as the ratio of the concentration of lactulose to mannitol.
The reported values for the analytes from the first LC-MSMS laboratory were referent and the HPLC-MSMS and second LC-MSMS results were compared against it. Analysis of variance and paired t tests were used to compare the mean logged concentration of each analyte between platforms. Statistical significance was expressed as P < 0.05.
Spearman correlations between the test results and the L:M concentration ratio (ratio of concentrations), and correlations between the natural log of the concentration and the logged LM ratio were calculated for results between laboratories. Bland-Altman plots for logged concentrations and for the logged L:M ratio (not shown), as well as plots of the observed/expected (O/E) ratio versus concentration, were created for visual inspection of the data.
Among the subset of randomly selected samples, the percent difference in the geometric means analyte concentrations via the HPLC-PAD and second LC-MSMS system versus the referent LC-MSMS platform were calculated.
RESULTS
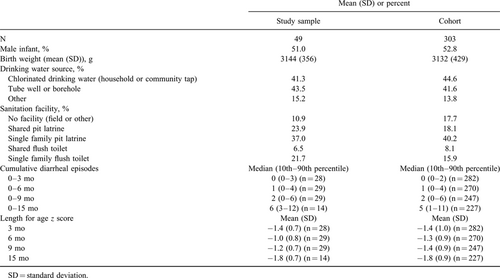
Recruitment into the cohort was ongoing between January 2010 and February 2012. Of the 303 infants initially enrolled, 49 contributed samples to the results reported here: 23 contributed one sample, 12 contributed 2 samples, 3 contributed 3 samples, and 11 contributed 4 samples. Descriptors of the overall cohort and the subset of infants whose samples were included in this comparison are shown in Table 1. All urine samples that had been collected and had HPLC results available by May 2011 were available for selection into the substudy (Fig. 1). Within the 100 samples selected, there were no indeterminate or missing results by any platform.
Urinary Lactulose and Mannitol Concentrations
The log-transformed mean concentrations (millimoles per liter) of both mannitol and lactulose were statistically significantly different between LC-MSMS 1 and LC-MSMS 2, and between LC-MSMS 1 and HPLC (paired t tests). Overall for the 100 samples, the geometric mean mannitol concentrations were 1.56 mmol/L (95% CI 1.26–1.95) by LC-MSMS 1, 1.95 mmol/L (95% CI 1.54–2.48) by LC-MSMS 2, and 2.02 mmol/L (95% CI 1.60–2.56) by the HPLC-PAD platforms. Geometric mean lactulose concentrations were 0.58 mmol/L (95% CI 0.49–0.69), 0.64 mmol/L (95% CI 0.54–0.76), and 0.95 mmol/L (95% CI 0.80–1.12), respectively, and the geometric mean L:M ratios were 0.37 (95% CI 0.32–0.43), 0.33 (95% CI 0.28–0.39), and 0.46 (95% CI 0.49–0.56), respectively.
The HPLC-PAD system consistently overestimated mannitol concentration by approximately 34% (95% CI 26–41) at all ages. In contrast, lactulose concentration appeared overestimated to the greatest extent (by 207%, 95% CI 174–245) in the youngest infants. As a result, the L:M ratio was also overestimated to the greatest extent in the youngest children (Table 2).
The concentrations of the analytes in the 3 “matrix” urines (5-hour urine collections from children who were not given the sugar solution) ranged from 0.06 to 0.26 mmol/L mannitol and 0.11 to 0.46 mmol/L lactulose by LC-MSMS 1. Three of 61 of the randomly selected samples from dosed children had mannitol concentrations, as measured by LC-MSMS 1, in the range of the matrix urines, whereas 19/61 samples had lactulose concentrations in the range of the matrix urines.
Correlation Between Platforms
Spearman correlations were statistically significant between all 3 platforms for both analytes and the overall L:M ratio, both overall and for randomly selected samples (P < 0.05), in all instances. Between the HPLC-PAD and LC-MSMS 1 platforms for mannitol concentration, lactulose concentration, and the L:M ratio, these were 0.95, 0.74, and 0.75, respectively. Among randomly selected samples only (N = 61) this dropped to 0.95, 0.70, and 0.43, respectively (Fig. 2).
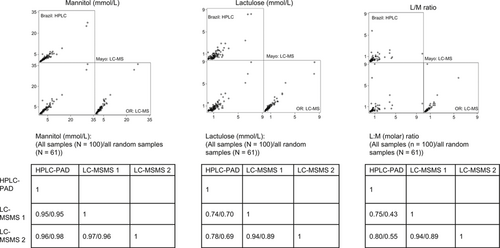
Spearman correlations between laboratories: A scatterplot display of the measured concentration of mannitol with each laboratory value plotted against one other (HPLC-PAD versus LC-MSMS 1, HPLC-PAD versus LC-MSMS 2, and LC-MSMS 1 versus LC-MSMS 2). The Spearman correlations between all samples, and all randomly selected samples, are shown below. Lactulose and the L:M ratio are demonstrated similarly. HPLC-PAD = high-performance liquid chromatography with pulsed amperometric detection; LC-MSMS = liquid chromatography-tandem mass spectrometry; L:M = lactulose:mannitol.
The Spearman correlations between the 2 LC-MSMS platforms were 0.97, 0.94, and 0.94 for mannitol concentration, lactulose concentration, and the L:M ratio, respectively; these dropped to 0.96, 0.89, and 0.89, when only randomly seeded samples were considered (Fig. 2).
Parametric correlations between the natural log of the mannitol concentration, lactulose concentration, and L:M ratio were also all statistically significant at the P < 0.05 level. For randomly selected samples, the correlations between the HPLC-PAD and LC-MSMS 1 platform results were 0.97, 0.63, and 0.33 for natural log of the mannitol concentration, lactulose concentration, and the L:M ratio, respectively, and 0.90, 0.96, and 0.81 between the 2 LC-MSMS platforms.
Overestimation at Low Lactulose Concentrations
When O/E ratios (HPLC-PAD result-LC-MSMS 1 result)/LC-MSMS 1 result were examined, samples with the greatest O/E ratios appeared to be clustered among samples with the lowest absolute lactulose concentrations as per LC-MSMS 1. The HPLC-PAD platform systematically overestimated concentrations at the low end of the spectrum, and this effect was present to a larger degree for lactulose (which was present at lower concentrations), than for mannitol. As a result, the L:M ratio was systematically inflated to the greatest extent among samples of the lowest true urinary lactulose concentrations (Fig. 3).
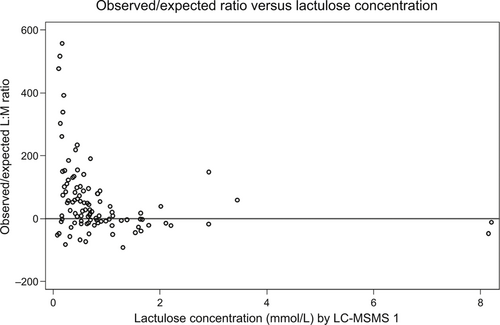
The difference between the L:M result as measured by HPLC-PAD (observed), and the L:M result as measured by LC-MSMS 1 (expected), as a function of the lactulose concentration as measured by LC-MSMS 1. HPLC-PAD = high-performance liquid chromatography with pulsed amperometric detection; LC-MSMS = liquid chromatography-tandem mass spectrometry; L:M = lactulose:mannitol.
DISCUSSION
Within a sample of urine samples selected from 3- to 15-month-old infants in a cohort at risk of EE, overall agreement between the HPLC-PAD and LC-MSMS platforms for mannitol concentration was high (ρ ≥ 0.95), whereas agreement between the HPLC-PAD and LC-MSMS platforms for lactulose concentration and for the absolute L:M ratio was lower (ρ = 0.43–0.75).
Without communication between the laboratories and with different protocols, a commercial laboratory (LC-MSMS 2) was able to produce results that were highly correlated (ρ = 0.89) with the referent laboratory. Although the results could surely be brought closer with the central preparation and shipping of standards used for the assay and a standard protocol, it is notable that without these steps the precision of the platform was high.
Overall, the HPLC-PAD platform overestimated L:M ratios compared with the LC-MSMS 1 platform by 27%, whereas the commercial LC-MSMS platform underestimated them by 11%. In particular, in this instance, the HPLC-PAD platform tended to overestimate low concentration values compared with LC-MSMS, and this effect was more dramatic in lactulose than in mannitol. As a result of this effect, L:M ratios as measured by this platform tended to be higher among children who had had higher total urine volumes (who were also younger infants). When measured by LC-MSMS, there was no association between L:M and urine volume. This issue is relevant wherein the population of interest includes young infants with a developing capacity to concentrate urine, an age range of key interest in the field of EE.
Mannitol is known to be naturally present in urine in low concentrations, several times lower than the levels excreted in dosed children. In this instance, roughly 5% of randomly selected results had mannitol concentrations in the range of what was found in urine from undosed children. Lactulose is not found in natural foods; however, it is present in ultra-high-temperature milk in concentrations of 0.72 to 1.60 mmol/L 28. Children in the community from which these samples were drawn receive lactulose frequently in the form of yogurt and cereal preparations. Thirty-one percent of urinary lactulose concentrations were in the range of what was also found among undosed children (by LC-MSMS 1). Camilleri et al 23 have reported that excretion of lactulose continued between 8 and 24 hours after dosing in healthy adults; it is plausible that dietary lactulose was not fully cleared by the pre-urine collection fast. It also raises the possibility of interfering substances, most likely to be other dietary disaccharides or breakdown products of milk oligosaccharides most likely to be preferentially present in younger children who received breast milk during the challenge test.
Although the L:M test is the most commonly used assay for intestinal permeability and has been used for >2 decades, few standards have been adopted in implementation, the assessment of analyte concentrations, or the interpretation of results. Methodologically, dosages and urine collection times vary significantly between studies. For example, according to the protocols of 2 well-cited studies, the dosage of lactulose for a 10-kg infant would vary from 8 to 4 g and dosages of mannitol would be 2 and 1 g, respectively 2, 29, whereas in the present study, a child of the same size would receive 5 g lactulose and 2 g mannitol. Ideally, these probes would have no activity on the host in general and on the gastrointestinal system in particular; however, the doses of lactulose in these studies are in the pharmacologic range for its use as a hyperosmolar laxative and published protocols exceed the dose used for constipation and are in the range of that used for portal systemic encephalopathy 30. As a consequence, transit time is accelerated and this likely decreases the absorption of mannitol in the assay, whereas lactulose absorption is increased in the presence of hyperosmolar solutions 5, 31.
Because short (ie, 2-hour) urine collections are likely to reflect more small bowel absorption 23, this may be a more accurate test and more convenient for patient and provider. Logistically, however, 2-hour urine collections may be challenging, especially among children in the absence of catheter placement, because they may not void in this interval. The standardization and dissemination of protocols for dosage, including preferred saccharides, osmolarities, and the urine collection period best suited to EE research, are key next activities to advance the science in this field.
In summary, given the large analyte concentration range, the improved accuracy of LC-MSMS has important consequences for the assessment of lactulose and mannitol following oral administration in populations at risk for environmental or tropical enteropathy. Despite the increased cost of the instrument, the per-specimen cost is low and the platform is amenable to automation. We recommend that researchers wishing to implement a dual-sugar test as part of a study of EE use an LC-MSMS platform to optimize the accuracy of results and increase comparability between studies.
Acknowledgments
The authors thank Matilda Bustos Aricara, Victora Lopez Manuyama, Marla Judith Aricari Huanari, and Lleny Amasifuen Llerena, for their hard work and thoughtful contributions to the field.


