The Nuclear Proteins TP73 and CUL4A Confer Resistance to Cytarabine by Induction of Translesion DNA Synthesis via Mono-ubiquitination of PCNA
MR and JAS contributed equally to this work.
Supplemental digital content is available for this article.
Abstract
Resistance to cytarabine is a key problem in the treatment of acute myeloid leukemia (AML). To understand the molecular biology of resistance to cytarabine, a viability-based chemosensitizer screen was utilized. We screened synthetic lethal targets using 437 different small interfering RNAs (siRNAs) directed against factors involved in DNA repair mechanisms and cytarabine as the chemical compound. Three hits were identified: CUL4A, TP73, and RFC2. We show here that the ubiquitin ligase CULLIN 4A (CUL4A) and the tumor-suppressive transcription factor p73 contribute to drug resistance by modulating DNA damage response. P73 confers resistance to cytarabine therapy by transactivation of REV3L, encoding the catalytic subunit of translesion DNA polymerase ζ, and CUL4A probably by influencing proliferating cell nuclear antigen (PCNA) and the polymerase switch towards error-prone translesion DNA polymerases. Abrogation of the polymerase ζ by siRNA causes identical effects as siRNAs against CUL4A or TP73 and resensitizes cells towards cytarabine therapy in vitro. As CUL4A needs to be activated by neddylation to facilitate the degradation of several proteins including PCNA, we propose a novel explanation for the synergism between cytarabine and the neddylation inhibitor pevonedistat by inhibition of translesion synthesis. In keeping with this, in AML patients treated with cytarabine, we found high expression of CUL4A and TP73 to be associated with poor prognosis.
INTRODUCTION
Acute myeloid leukemia (AML) is the most frequent acute leukemia in adults with a poor prognosis in most cases.1 Resistance to cytotoxic drugs remains the main cause for treatment failure and death. In some subentities such as acute promyelocytic leukemia (APL), great progress has been made by the introduction of noncytotoxic treatment strategies utilizing all-trans retinoic acid and arsenic trioxide.2 Targeted treatment options for other molecularly defined subgroups (IDH1/2- or FLT3-mutated AML) and the BCL-2 inhibitor Venetoclax in the palliative setting brought some advancements in the treatment of AML patients.3 However, curative intended therapy of most AML patients has not changed significantly in the last decades and consists of 1 or 2 induction cycles with anthracyclines such as daunorubicin or idarubicin, combined with 7 days continuous infusion of cytarabine (Ara-C).4 Post-induction treatment is stratified according to the individual risk and may consist of high-dose cytarabine as standard post-induction therapy,5 of more aggressive consolidation treatment strategies,6 or allogeneic stem cell transplantation.7 With these treatment strategies, the prognosis of AML varies considerably between 5% and above 80% surviving 5 years. Although allogeneic stem cell transplantation has the lowest relapse rate of all post-induction treatment strategies, overall survival is not always increased because of treatment-related mortality. In addition, many patients cannot undergo allogeneic stem cell transplantation because of age or comorbidity. Therefore, alternative treatment strategies are urgently needed in AML.
The main drug used in the induction and post-induction therapy of AML patients eligible for intensive treatment is cytarabine that is used in lower dosages during induction and higher dosages during consolidation.8 Intracellularly, cytarabine is triphosphorylated and incorporated into DNA, thereby inhibiting DNA replication and DNA repair.9 Resistance to Ara-C is caused by different molecular mechanisms including MDR1 upregulation or overexpression of DNA polymerase α.10 As most AML patients die from Ara-C resistance, we sought to identify novel Ara-C resistance-causing genes using screening of Ara-C synthetic lethal targets.11-13 We used an small interfering RNA (siRNA) library covering major proteins involved in DNA replication and repair and identified 3 genes, CUL4A, TP73, and RFC2, whose knockdown causes chemosensitivity together with Ara-C in cancer cells.
MATERIALS AND METHODS
Cell culture and RNA interference
U-2 OS, HL-60, THP-1, KG1a, and OCI-AML3 cells were obtained from American Type Culture Collection or German Collection of Microorganisms and Cell Cultures and cultured in Gibco Dulbecco's Modified Eagle's Medium (DMEM) or RPMI 1640 medium, supplemented with 10% fetal calf serum (FCS) (Sera Plus; PAN-Biotech) and 1% penicillin/streptomycin (Life Technologies) using standard conditions (37°C, 5% CO2). Resistant HL-60 (R52, R56) were established by treating parental HL-60 cells with increasing cytarabine concentrations (up to 1 µM) over time. For RNA interference, cells were transfected with siRNAs (Dharmacon, now Thermo Fisher) using DharmaFECT I (Thermo Fisher) or RNAiMAX (Thermo Fisher) according to the manufacturer´s protocol and with a final siRNA concentration of 20 nM.
Cell viability assay
Cells were treated with cytarabine, pevonedistat or both and cell viability was measured with the CellTiter-Glo Luminescent Cell Viability Assay (Promega) according to manufacturer′s protocol and by using the microplate reader luminometer Orion II (Titertek-Berthold). Relative cell viability was calculated as the ratio of average luminescence intensity of treated samples compared with controls.
Growth assay
For growth assays, 200,000 U-2 OS cells were reverse transfected with 20 nM siRNA and incubated for 48 hours. After medium was changed, cells were treated [with cytarabine] at the inhibitory concentration causing 20% inhibition (IC20, 13 μM) for 48 hours. Cells were washed twice with phosphate-buffered saline (PBS) and colonies were grown for 10 days in normal growth medium. Outgrown colonies were fixed in ice-cold 70% ethanol and stained with Giemsa (Roth).
RNA isolation, quantitative reverse transcription polymerase chain reaction, and expression profiling
Total RNA isolation and complementary DNA (cDNA) synthesis were performed using the RNeasy Mini Kit (Qiagen) and SuperScript VILO cDNA Synthesis Kit (Thermo Fisher) following manufacturer′s instructions. Gene expression was quantified by quantitative reverse transcription polymerase chain reaction using SYBR Green Jumpstart Taq ReadyMix (Sigma-Aldrich) on a LightCycler 480 (Roche). Expression data were normalized to the housekeeping gene GAPDH using the ΔΔCt method.14
Western blot
For protein analysis, cells were lysed in radioimmunoprecipitation assay Lysis buffer supplemented with protease inhibitor cocktail P8340 (Sigma-Aldrich) and phosphatase inhibitor cocktail 2 + 3 (Sigma-Aldrich). Protein yield was determined using Bradford assay (Carl Roth). Total protein (30–50 μg) was separated on NuPAGE SDS Gels (Thermo Fisher) and tank-blotted to nitrocellulose membranes (GE Healthcare). Following blocking in Tris-buffered saline with Tween 20 (5 mM Tris, 15 mM NaCl, 0.1% Tween 20, pH 7.5) with 10% nonfat dry milk or 5% bovine serum albumin for 1 hour, membranes were incubated with primary antibodies diluted in blocking buffer and incubated overnight at 4°C. Proteins were detected with secondary antibodies (listed in Suppl. Data) and enhanced chemiluminescence kit (SuperSignal West Dura Chemiluminescent Substrate; Thermo Fisher).
Immunofluorescence
Immunofluorescence staining was performed in 96-well μClear imaging plates (Greiner Bio-One). Cells were fixed in 3.7% paraformaldehyde (PFA) in PBS or in ice-cold methanol/acetone (1:1) for 15 minutes. PFA-fixed samples were washed 2 times with 0.1 M glycine in PBS and permeabilized in PBS with 0.1% NP-40 (each 5 minutes, room temperature). Blocking was performed in permeabilization buffer supplemented with 5% fetal bovine serum for 1 hour at room temperature. Cells were incubated with primary antibodies diluted in blocking buffer for 1 hour at 37°C. After washing in blocking buffer, samples were incubated with fluorescent secondary antibodies in blocking buffer supplemented with 4′,6-diamidino-2-phenylindole (200 nM) for nuclear counterstain and incubated for 1 hour at room temperature. After washing in permeabilization buffer, cells were kept in PBS, imaged, and quantified on a single-cell level with the automated fluorescence microscope BD Pathway 855 using the software Attovision (BD Biosciences).
Chemosensitizer siRNA screening and statistical analysis
For siRNA screening, 20 nM of pooled siRNAs (4 different siRNA sequences per gene and per well, Thermo Fisher) were mixed with Gibco OptiMEM (Thermo Fisher) and transfection reagent Dharmafect 1 (Thermo Fisher). After incubation of 20 minutes at room temperature, siRNA-transfection-mix was transferred to 384-well plates. U-2 OS cells were separated using StemPro Accutase (Sigma-Aldrich), which was inactivated with antibiotic-free DMEM supplemented with 10% FCS and 1500 cells/well were added to the 384-well plates. Plates were incubated 1 hour at room temperature for cell-settling followed by 23 hours at 37°C with 5% CO2. After 24 hours, medium was changed and supplemented with cytarabine or 0.9% NaCl (solvent) in absence of antibiotics and cells were incubated for 48 hours. Cell viability was measured by quantification of ATP in cell lysates using CellTiter-Glo Luminescent Cell Viability Assay (Promega) as described in manufacturer′s manual. The luminescent signal was measured with a microplate reader. The Z′ factor was obtained as a marker of the discriminatory power of the screen using viable cells as the negative control (nontargeting siRNA [nsi]) and killed cells as the positive control (siRNA targeting the polo-like kinase 1 [PLK1-si]). For hit identification, raw luminescence readings for each gene were log2-transformed and normalized to solvent-treated cells. The chemosensitivity of each siRNA was expressed as the z score (z score Ara-C sensitivity).15-17
Luciferase reporter assay
U-2 OS cells were plated in 48-well plates and grown overnight under standard conditions. Cells were then transiently co-transfected with Renilla luciferase reporter plasmid (pLightSwitch; Switch Gear Genomics) and TP73-expressing plasmids using FuGENE HD Transfection reagent (Promega) following manufacturer′s instructions. For normalization, an empty vector pLightSwitch (Switch Gear Genomics) was used. Twenty-four hours after transfection, cells were lysed in Passive Lysis Buffer (Promega). Luciferase activities were measured in cell lysates using Renilla Juice Luciferase Assay Kits and coelenterazine as substrate (PJK). Luminescent signal was measured on a microplate reader luminometer Orion II (Titertek-Berthold).
Survival analyses
Microarray-based whole-genome gene expression analyses (Affymetrix HG-U133 Plus 2.0) were performed on an unselected set of samples of AML patients at the Munich Leukemia Laboratory (MLL). Data preprocessing was performed at the MLL as previously described.18 Baseline characteristics (French American British classification subtype, karyotype, RUNX1, CEBPA, FLT3-ITD, FLT3-TKD, MLL-PTD, and NPM1 status) and survival data were available for all patients.
Statistical analyses
All data are presented as mean ± SD and experiments were performed 3 independent times unless indicated otherwise. Statistical analyses were performed as indicated using R (The R Foundation) and GraphPad Prism 7.0 (GraphPad Software, La Jolla, CA).
Inhibitory concentrations were estimated by using a nonlinear fit modeling (4 parameters variable slope, least square fit).
Drug combination experiments were analyzed using the zero interaction potency model and the SynergyFinder R Package.19
RESULTS
The ubiquitin ligase CUL4A, the replication factor 2 (RFC2) and the tumor suppressor p73 mediate resistance [to cytarabine] in U-2 OS cells
To perform a chemosensitizer screen with cytarabine, we took advantage of U-2 OS osteosarcoma cells because U-2 OS cells are highly resistant to cytarabine (see Figure 1A, left and Suppl. Figure S1) and could easily be transfected with high efficiency compared with AML cells.20 Although U-2 OS cells are highly cytarabine resistant, induction of CHK1- and p53-dependent DNA repair pathways was still observed (Figure 1A, right). We used a self-compiled siRNA library consisting of 437 siRNA pools targeting major genes implicated in DNA repair mechanisms. An ATP-based proliferation assay was applied for the read-out of cell viability (Figure 1B). In order to determine the suitability and reproducibility of the screening approach, the Z′-factor (the screening window coefficient) of 0.46 was determined and revealed a good separation band of positive (PLK1-si) and negative control (nsi) (Figure 1C, left). Two independent screens revealed identical results in that depletion of CUL4A, TP73, and RFC2 significantly increased chemosensitivity to cytarabine in U-2 OS cells (Figure 1C, right). The robust hits were validated in additional assays, using 2 different siRNA sequences for each gene in U-2 OS cells. First, the chemosensitivity was validated in cells depleted for CUL4A, TP73, or RFC2 and treated with cytarabine using growth assays (Figure 1D, E). Next, luminescent-based cell survival analysis confirmed that knockdown of the genes CUL4A, TP73, or RFC2 induced an increased chemosensitivity towards cytarabine: cell viability decreased gradually with increased cytarabine concentrations (Figure 1F). Together, these data indicated that depletion of CUL4A, TP73, as well as RFC2, overcomes intrinsic cytarabine resistance in U-2 OS cells. Knockdown of RFC2, which codes for 1 out of 5 distinct subunits of the replication factor C (RFC), induced complete growth arrest after about 72 hours even in the absence of cytarabine (data not shown), so in our further work, we focused on CUL4A and TP73.
Depletion of CUL4A and TP73 causes altered DNA repair after DNA damage
Within cells, cytarabine is phosphorylated to cytarabine triphosphate and incorporated into DNA in place of deoxycytidine triphosphate, thereby inhibiting DNA replication.8 We next wanted to study whether depleting CUL4A and TP73 in U-2 OS cells would influence DNA damage and DNA repair mechanisms. The experimental design is depicted in Figure 2A. Two cell populations were compared: (1.) “DNA damage cells” were fixed immediately after 8 hours of Ara-C exposure. These cells did not have the opportunity to repair the damaged DNA and (2.)“DNA repair cells.” These cells were exposed for 8 hours as well, then Ara-C was washed-out, and cells were supplemented with fresh medium and grown for an additional 40 hours to give the cells the opportunity to repair the induced DNA damage. We took advantage of immunofluorescence analysis of histone H2AX phosphorylated at Serin 139 (γH2A.X) and serine 33 phosphorylated replication protein A 32 (pS33-RPA32) that both accumulate during DNA replication as a consequence of DNA strand breaks during DNA damage.21, 22 “DNA damage cells,” control cells (nsi, mock) as well as CUL4A- or TP73-depleted cells showed strong accumulation of phosphorylated RPA32 and γH2A.X, thus both indicating initiated DNA damage response, compared with cells incubated with solvent only (Figure 2B, C). In contrast, in “DNA repair cells,” the pRPA32 and γH2A.X signals were lower in the control cells (nsi, mock), as they were apparently able to recover from DNA damage by DNA repair or translesion DNA synthesis (TLS). However, in TP73- or CUL4A-depleted cells, the pS33-RPA32 and γH2A.X signals appeared accumulated, indicating continuous DNA damage or impaired DNA repair and TLS (Figure 2B, C). Thus, the cells were not able to recruit additional targets to stalled replication forks, rendering these cells sensitive to Ara-C.
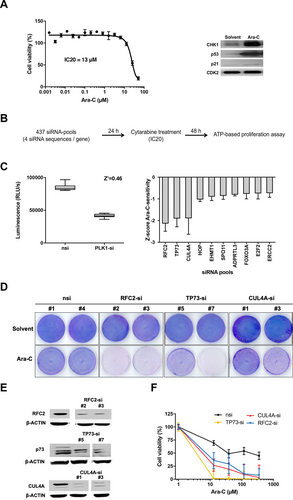
Cytarabine-based chemosensitizer siRNA screen in cytarabine resistant U-2 OS cells. (A), Left: U-2 OS cells are highly resistant towards the antimetabolite cytarabine. For this viability assay, U-2 OS cells were treated with cytarabine (Ara-C) for 48 h with the indicated concentrations and cell viability was measured using an ATP-based proliferation assay. Bars show mean % cell viability ± SD normalized to untreated cells (n = 3). Curve: nonlinear regression model. IC20 = 13 μM, IC50 = 21 μΜ. Right: U-2 OS cells were harvested after 48 h of 13 µM Ara-C or solvent (0.9% NaCl) treatment and Western blot was performed with antibodies as indicated. CDK2: loading control. (B), Experimental approach of siRNA screen. (C), Left: Determination of suitability of the screen: Z′-factor (marker of the discriminatory power of the screen). siRNA-transfected U-2 OS cells were Ara-C treated and cell viability was measured under siRNA screening conditions (see materials and methods). Positive control: polo-like kinase 1 siRNA (PLK1-si), negative control: nsi. Shown are RLUs ± SD (n = 32). Right: Analysis of siRNA screen: The chemosensitivity of each siRNA was expressed as a z score Ara-C-sensitivity ± SD (n = 2). (D), Chemosensitivity of CUL4A-, RFC2-, and TP73-depleted and Ara-C treated U-2 OS cells (13 µM, IC20). Growth assays of siRNA transfected U-2 OS cells: Two different siRNAs per gene were used as indicated. Control cells: nsi, solvent: buffer-treated cells. (E), Western blot evaluating knockdown efficiency of indicated siRNAs in U-2 OS cell line compared with control cells (nsi). β-ACTIN: loading control. (F), Cell viability of siRNA-transfected U-2 OS cells after 48 h of Ara-C treatment with the indicated concentrations. Bars show mean % normalized to solvent-treated cells ± SD (n = 3). For all specific siRNAs (CUL4A-si, TP73-si, RFC2-si) vs nsi P < 0.0001 (2-way ANOVA with Tukey's multiple comparisons test). ADPRTL3 = Poly(ADP-Ribose) Polymerase Family Member 3; Ara-C = cytarabine; β-ACTIN = beta-ACTIN; CDK2 = cyclin dependent kinase 2; CUL4A = Cullin 4A; CUL4A-si = siRNA against CUL4A; E2F2 = E2F Transcription Factor 2; EHMT1 = Euchromatic Histone Lysine Methyltransferase 1; ERCC2 = ERCC Excision Repair 2, TFIIH Core Complex Helicase Subunit; FOXO3A = Forkhead Box O3; HOP = stress induced phosphoprotein 1; IC = inhibitory concentration; nsi = nontargeting siRNA; PLK1-si = siRNA targeting the polo-like kinase 1; RFC2 = replication factor C subunit 2; RFC2-si = siRNA against RFC2; RLU = raw luminescent light unit; siRNA = small interfering RNA; SPO11 = SPO11 Initiator Of Meiotic Double Stranded Breaks; TP73 = Tumor Protein P73; TP73-si = siRNA against TP73; U-2 OS = U-2 OS osteosarcoma cell line.
Depletion of translesion polymerase ζ causes identical effects as knockdown of TP73 and CUL4A
After incorporation of cytarabine-triphosphate into the DNA molecule DNA synthesis blocks, DNA strand breaks accumulate and polymerase α is inhibited. The single-strand DNA is RPA-coated and therefore ATR is recruited and activated. Several proteins (RAD6, RAD18, CUL4A, CDT2, and proliferating cell nuclear antigen [PCNA]) are engaged into the lesions. Some complexes are in turn responsible for mono-ubiquitination of PCNA, facilitating the switch of replication polymerases to TLS polymerases for activation of error-prone TLS.23, 24 We thus analyzed whether treatment with Ara-C resulted in the induction of mono-ubiquitination of PCNA in osteosarcoma cells. Indeed the data in Figure 3A demonstrate that Ara-C treatment leads to increased mono-ubiquitination of PCNA during 48 hours of incubation. If subsequent recruitment of TLS-complexes after PCNA mono-ubiquitination was critical for cells to cope with Ara-C induced DNA damage, depletion of other members of the TLS-complex should have similar effects as depletion of CUL4A. In keeping, knockdown of polymerase η (POLH) and REV3L (encoding for a catalytic subunit of polymerase ζ) had identical effects as treatment with siRNA directed against TP73 and CUL4A (Figure 1E and Figure 3B, C). The polymerase-depleted cells are resensitized towards cytarabine treatment, compared with control cells (Figure 3B, C). These data suggest that recruitment of translesion polymerases such as polymerase ζ renders cells resistant towards the anti-metabolic drug cytarabine.
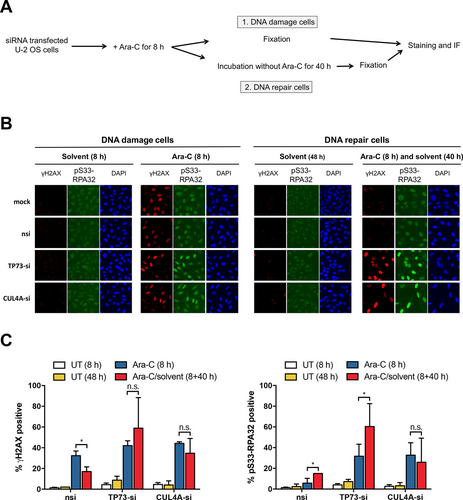
Impaired DNA damage response in TP73-, CUL4A-, and REV3L-depleted osteosarcoma cells. (A), Experimental design of IF assay of siRNA transduced and 13 µM Ara-C treated or untreated U-2 OS cells. We distinguish between (1.) DNA damage cells: cells were fixed directly after the DNA damage and (2.) DNA repair cells: cells were allowed to repair the DNA damage. (B), Representative IF images of DNA damage marker γH2AX and pS33-RPA32 of in (A) treated cells at indicated time points. Control: mock, nsi. DAPI: nuclear counterstaining. (C), Quantifications of DNA markers are shown. Bars show mean % of 2 different siRNAs per gene ± SD (n = 6) of cells positive for γH2AX (left) and pS33-RPA32 (right), *P < 0.05 (multiple t tests). Ara-C = cytarabine; CUL4A = Cullin 4A; CUL4A-si = siRNA against CUL4A; DAPI = 4′,6-Diamidin-2-phenylindol; IF = immunofluorescence; n.s. = not significant; nsi = nontargeting siRNA; pS33-RPA32 = serine 33 phosphorylated replication protein A 32; REV3L = catalytic subunit of polymerase ζ; siRNA = small interfering RNA; TP73 = Tumor Protein P73; TP73-si = siRNA against TP73; U-2 OS = U-2 OS osteosarcoma cell line; UT = solvent treated cells; γH2AX = H2A histone family member X phosphorylated on serine 139.
The transcription factor p73 induces REV3L expression directly by binding to the REV3L promoter
In the previous section, we have shown that knockdown of TP73 leads to a similar phenotype in the presence of cytarabine as depletion of REV3L or POLH. This suggests a prior unknown role of TP73 in the regulation of TLS. In U-2 OS cells, the knockdown of TP73 leads to a decreased level of REV3L expression (Figure 4A). This indicated that REV3L might be transcriptionally regulated by p73. Therefore, we performed chromatin immunoprecipitation analysis in osteosarcoma cells (Figure 4B). Indeed, p73 binds to the promoter sequences of REV3L. Next, we analyzed the REV3L promoter sequence and identified a putative p73 binding site (BS) (Suppl. Figure S2). To further dissect a direct regulation of REV3L by p73, we cloned this promoter fragment and a TP73 BS-mutated version into a luciferase reporter and assessed its transcriptional regulation by overexpression of p73. Transactivating isoforms TAp73α and TAp73β indeed caused a significant increase in luciferase activity using the REV3L wildtype promoter, whereas the mutated fragment of the REV3L promoter does not influence the luciferase signal (Figure 4C). Thus, in keeping with our hypothesis, TAp73 induces the expression of REV3L.
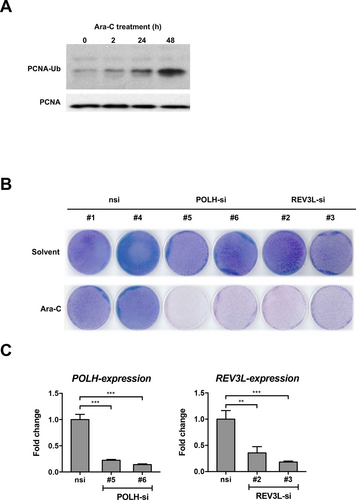
Depletion of translesion polymerase ζ causes similar effects as knockdown of TP73 and CUL4A. (A), PCNA mono-ubiquitination is induced after Ara-C treatment. Modification of PCNA in wildtype U-2 OS after 13 µM Ara-C treatment at indicated time points is analyzed by Western blot. (B), Growth assays of siRNA-transfected U-2 OS cells: Two different siRNAs per gene were used as indicated. Control cells: nsi, solvent: buffer-treated cells, Ara-C: 13 µM. (C), qRT-PCR evaluating knockdown efficiencies of indicated siRNAs in U-2 OS cell line compared with control (nsi) cells. Bars show mean fold change of mRNA expression ± SD of indicated genes compared with nsi-control (n = 3). **P < 0.01, ***P < 0.001 (1-way ANOVA with Tukey's multiple comparisons test). Ara-C = cytarabine; mRNA = messenger RNA; nsi = nontargeting siRNA; PCNA = proliferating cell nuclear antigen; PCNA-Ub = mono-ubiquitinated isoform of proliferating cell nuclear antigen; POLH = polymerase η; POLH-si = siRNA against POLH; qRT-PCR = quantitative reverse transcription polymerase chain reaction; REV3L = catalytic subunit of polymerase ζ; REV3L-si = siRNA against REV3L; siRNA = small interfering RNA; U-2 OS = U-2 OS osteosarcoma cell line.
Figure 5 depicts our results in a model. During replication in human cells, the RFC complex plays a role in PCNA clamp loading. In case of DNA damage, for example, after cytarabine incorporation, the replication is blocked, and DNA damage and repair proteins are able to repair the damage or to overwrite the damaged DNA to complete replication and to continue cell proliferation. E3 ligases CRL4-CDT2 or RAD6-RAD18 complexes are recruited to damaged DNA and lead to a polymerase switch, thereby recruiting active translesion polymerases ζ and η. The activation of TLS affects the completion of DNA replication and furthermore enables the cells to proliferate in the presence of the DNA damaging agent cytarabine. When RFC2, CUL4A, or the TLS polymerases are depleted, the cells undergo apoptosis after cytarabine treatment. Our data suggest that cancer cells survive chemotherapy treatment by increasing TLS.25, 26
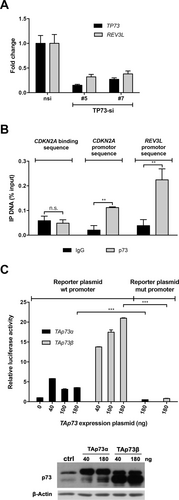
REV3L as a target of the transcription factor p73. (A), qRT-PCR of siRNA-transfected U-2 OS cells, as indicated. Bars show mean fold change of mRNA expression ± SD of indicated genes compared with nsi-transfected control (n = 3). P < 0.001 for all comparisons (expression levels upon treatment with TP73-si # 5/7 vs respectively nsi, multiple t tests). (B), ChIP in wildtype U-2 OS demonstrates the binding of p73 at REV3L promoter sequence and CDKN2A promoter sequence (positive control), but not on negative control (CDKN2A binding sequence, randomly chosen sequence in CDKN2A gene). Binding is shown as mean % input ± SD (n = 3). IgG: negative control of ChIP. **P < 0.01 (multiple t tests). (C), Luciferase reporter assay shows induction of the luciferase activity under control of the wildtype but not mutated REV3L promoter sequence in TAp73α and TAp73β overexpressing U-2 OS cells. Bars show the mean relative luciferase activity ± SD compared with vector control (n = 3). Indicated plasmid concentrations were used. Western blot analyzing TAp73 overexpression in transfected U-2 OS cell lines. β-ACTIN: loading control. ***P < 0.001 (multiple t tests). β-ACTIN = beta-ACTIN; ChIP = chromatin immunoprecipitation; IP = immunoprecipitation; mRNA = messenger RNA; mut = mutated; n.s. = not significant; RNA; nsi = nontargeting siRNA; PCNA = proliferating cell nuclear antigen; qRT-PCR = quantitative reverse transcription polymerase chain reaction; REV3L = catalytic subunit of polymerase ζ; siRNA = small interfering RNA; TAp73α and TAp73g = transactivation proficient splice variants (alpha/beta) of p73; TP73-si = siRNA against TP73; U-2 OS = U-2 OS osteosarcoma cell line; wt = wildtype.
The inhibition of cullins could overcome Ara-C resistance in AML cells
CUL4A as another hit of our chemosensitizer screen encodes for a cullin-RING E3 ubiquitin ligase. These enzymes are post-translationally modified for activation by neddylation and thereby can be inhibited by the selective NEDD8-activating enzyme inhibitor pevonedistat (MLN4924). Cell survival assays show that the effect of cytarabine is amplified by the cullin-inhibitor pevonedistat in U-2 OS (Suppl. Figure S3) and AML cells. Ara-C-sensitive (HL-60) as well as chemo-resistant AML cells (THP-1 or KG1a, respectively) show a higher sensitivity to Ara-C in combination with pevonedistat as to 1 drug alone (Figure 6A). These data suggest that the pharmacological inhibition of cullins overcomes the Ara-C resistance in AML cells. The inhibition of cullins (1 or 4) through the treatment with pevonedistat is shown by the stabilization of the cullin substrate, the DNA replication factor CDT1.27 Our experiments show that in the presence of pevonedistat as well as under control conditions, cullins are less active as CDT1 accumulates (Figure 6B). In the presence of Ara-C, CDT1 is degraded, whereas cotreatment with pevonedistat rescues expression of CDT1. Furthermore, we could show that in 2 highly Ara-C resistant HL-60 subclones (R52 and R56) that were generated by long time culture with increasing concentrations of Ara-C, the pharmacological inhibition of cullins by pevonedistat causes a dramatic decrease in cell viability with increasing concentrations of pevonedistat, compared with control (Figure 6C). Compared with cytarabine-sensitive HL-60 cells, these resistant clones show increased levels of CUL4A-expression (Figure 6D).
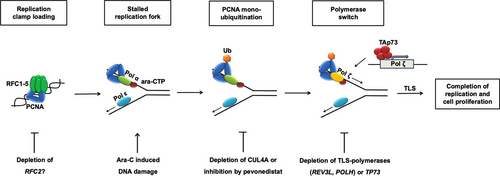
Proposed model of resistance to cytarabine. The antimetabolite cytarabine is misincorporated into DNA during replication. At the thereby stalled replication fork RAD18 independent mono-ubiquitination of PCNA by CUL4A complexes induces a polymerase switch from polymerase α to error-prone DNA polymerases ζ or η that allow the completion of replication and ongoing proliferation of cancer cells despite the presence of Ara-C. Sensitivity to Ara-C can be restored by abrogation of CUL4A or its transactivator p73. Pevonedistat mimics this effect by weakening the activation of CUL4A (beside other cullins) through inhibition of neddylation explaining at least partially the shown synergism between this novel drug and Ara-C. Ara-C = cytarabine; CTH = cytidine triphosphate; CUL4A = Cullin 4A; PCNA = proliferating cell nuclear antigen; RAD18 = RAD18 E3 Ubiquitin Protein Ligase; RFC = replication factor C; TAp73 = full length (transactivation profiecient) p73; TLS = translesion DNA synthesis.
In another experiment using an small hairpin RNA-based approach, we were able to show that knockdown of CUL4A sensitizes the highly cytarabine resistant AML cell line OCI-AML3 towards Ara-C (Figure 7).
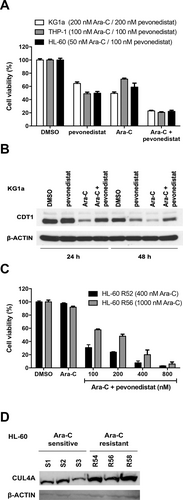
The effect of cytarabine is amplified by the addition of pevonedistat in AML cells. (A), Three different AML cells were treated with DMSO (control), pevonedistat or Ara-C alone or in combination and cell viability was measured using ATP-based proliferation assay. Cytarabine-sensitive HL-60 cells were incubated with 50 nM, cytarabine resistant THP-1 cells were incubated with 100 nM Ara-C, and/or 100 nM pevonedistat and cytarabine resistant KG1a cells were incubated with 200 nM Ara-C and/or 200 nM pevonedistat for 72 h. Bars show mean % cell viability ± SD normalized to untreated cells (n = 3). For all cell lines, P < 0.001 for each possible comparison (2-way ANOVA with Tukey's multiple comparisons test). (B), KG1a cells treated in (A) were harvested after 24 and 48 h of treatment and Western blot analysis was performed with antibodies detecting CDT1 or β-ACTIN (loading control). (C), Cytarabine resistant HL-60 cells (clone R52, R56: growing in the presence of 400 and 1000 nM Ara-C, respectively) were treated with DMSO (control), Αra-C (1 μM) alone or Αra-C (1 μΜ) in combination with pevonedistat at the indicated dose for 72 h and cell viability was measured using ATP-based proliferation assay. Bars show mean % cell viability ± SD normalized to DMSO treated cells (n = 3), for all drug combinations vs Ara-C only P < 0.001 (multiple t tests). (D), Western blot analyzing CUL4A expression levels in Ara-C sensitive (S1, S2, S3) vs Ara-C resistant (R54, R56, R58) subclones of HL-60 leukemia cells. β-ACTIN: loading control. AML = acute myeloid leukemia; Ara-C = cytarabine; β-ACTIN = beta-ACTIN; CDT1 = Chromatin Licensing And DNA Replication Factor 1; CUL4A = Cullin 4A; DMSO = dimethyl sulfoxide.
High expression of CUL4A and TP73 is associated with worse prognosis in AML patients
In order to address whether overexpression of either CUL4A or TP73 may impair the prognosis in AML, we analyzed a cohort of 242 AML patients that had been treated within different German AML treatment protocols and had received cytarabine as part of induction and/or consolidation therapy. High expression of CUL4A or TP73 is associated with poor survival in AML (Figure 8A), in keeping with our here demonstrated in vitro results. This effect is also seen in patients whose AML cells express high levels of both CUL4A and TP73 (Figure 8B).
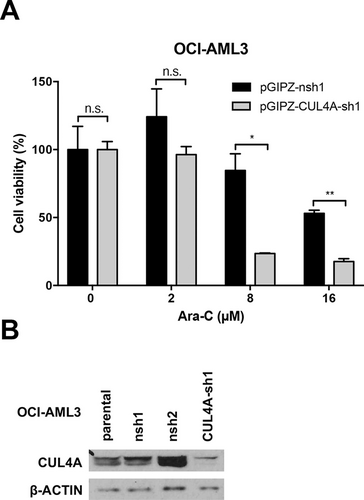
Knockdown of CUL4A sensitizes OCI-AML3 cells towards cytarabine. (A), The viability of OCI-AML3 cells was measured (CellTiter-Glo) after lentiviral transduction (pGIPZ vector) with shRNA against CUL4A and nsh (control) and increasing concentrations of Ara-C for 24 h. (B), Knockdown efficiency of CUL4A-sh1 compared with nsh1, nsh2, and parental OCI-AML3 shown by Western blot analysis. β-ACTIN: loading control. *P < 0.05, **P < 0.01 (multiple t tests). AML = acute myeloid leukemia; Ara-C = cytarabine; β-ACTIN = beta-ACTIN; CUL4A = Cullin 4A; CUL4A-sh1 = shRNA against CUL4A; n.s. = not significant; nsh = nonspecific shRNA; pGIPZ = pGIPZ cloning vector; shRNA = small hairpin RNA.
DISCUSSION
Despite recent progress in the treatment of some subgroups of AML by the introduction of new targeted therapies, mortality remains high, and thus, there is a significant medical need for novel therapies. Since most patients die due to resistance to standard chemotherapeutic agents, we used a chemosensitizer screening approach to define new mechanisms of resistance to the antimetabolite cytarabine, the chemotherapeutic agent most commonly used in AML therapy. The screen was performed with cytarabine and siRNA-pools directed against 437 genes encoding for nuclear proteins as well as proteins implicated in DNA repair in cancer cells. For 2 reasons, we took advantage of U-2 OS osteosarcoma cells for our screen: (1) the siRNA screening transfection procedure we chose was not working in various AML cell lines tested and (2) U-2 OS cells are highly resistant against Ara-C but still activate DNA damage pathways upon treatment (eg, CHK1 via p53 and p21). From 2 independent runs of the screening procedure, 3 genes emerged whose downregulated expression robustly sensitized U-2 OS cells to Ara-C: CUL4A, TP73, and RFC2 (Figure 1). In this project, we elaborated on the mechanism of action of 2 of the 3 hits, CUL4A and TP73.
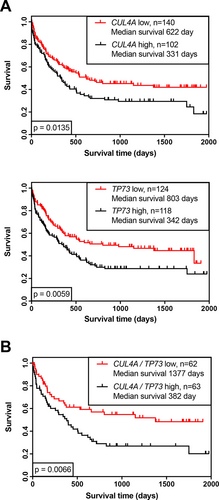
High expression of CUL4A or TP73 is associated with worse prognosis in AML patients. (A), Kaplan-Meier analysis of overall survival of a cohort of 242 AML patients expressing CUL4A or TP73. (B), Subgroup of 125 patients with CUL4A and TP73 on an either low (red line) or high level (black line). (A), Based on best splitting thresholds. (B), On upper and lower quartile analyses, P values on log-rank test (Mantel-Cox). Dataset kindly provided by the author (TH), MLL. AML = acute myeloid leukemia; MLL = Munich Leukemia Laboratory.
When analyzing DNA damage response and DNA repair mechanisms under screening conditions, we observed an accumulation of DNA damage foci after incubation with Ara-C. Cells treated with Ara-C and control siRNA showed declining foci level, while in cells treated with Ara-C and siRNA against TP73 or CUL4A DNA damage foci further accumulated (Figure 2). In subsequent experiments, we observed a comparable phenotype after knockdown of translesion DNA polymerases η and REV3L, the catalytic subunit of polymerase ζ, suggesting that cells cope with cytarabine-induced replication block and DNA-lesions by activating TLS (Figure 3). CUL4A, the ubiquitin ligase component of various multimeric cullin-RING-based complexes, has been shown to play a role in the activation of TLS by mono-ubiquitination of PCNA independent of RAD18, thereby facilitating the necessary polymerase switch.24, 28
TP73 encodes a member of the TP53 family of transcription factors involved in cellular responses to stress and development, and p73-deficient cells show altered DNA repair.29 Interestingly, we could identify a common mechanism of action of the 2 Ara-C-synthetic lethal targets: We were able to detect a BS for p73 in the REV3L promoter and could proof its transcriptional activation by p73 in luciferase experiments (Figure 4). p73 is a bona fide transcription factor implicated in cell cycle regulation, apoptosis and DNA repair.30, 31 TP73 is expressed in 2 major isoforms: TAp73 contains the N-terminal transactivation domain and activates p53-target genes and therefore induces apoptosis or cell cycle arrest. ΔNp73 isoforms lack the transactivation domain but exert a dominant-negative effect on TAp73 through formation of inactive hetero-oligomeric complexes.30 In AML, both isoforms of TP73 are expressed. It has previously been reported that in AML without recurrent genetic abnormalities (PML-RARA, RUNX1-RUNX1T1, or CBFB-MYH11 fusion transcripts), cells with higher ΔNp73/TAp73 ratios were significantly more resistant to Ara-C–induced apoptosis.32 This observation in the mentioned subgroups of APL and “good risk” AML cannot be explained by our model, that is dependent on the transcriptional activity of the full-length isoforms of TP73.
The role of CUL4A in human cancer is discussed controversially. CUL4A is amplified in different human cancers, including prostate, ovarian, breast and hepatocellular carcinoma cells, indicating its role as a critical oncogene.33, 34 In AML cell lines and clinical samples, it has been shown that inactivation of E3 cullin-RING ligases by pevonedistat causes accumulation of C-MYC that transactivates PMAIP1, the gene encoding for NOXA, leading to increased BAX and BAK activation and in the end to apoptotic events.35 Furthermore, knockdown of CUL4A induced chemosensitivity to gemcitabine, a drug similar to cytarabine, in lung cancer cells.36 In prostate cancer cells, CUL4A expression was associated with worse response to chemotherapy, which, on the other hand, induced a favorable outcome upon treatment with thalidomide.37 Taken together, most authors see CUL4A as an oncogene that is associated with poor response to treatment with classical chemotherapeutic agents. This notion is further supported by our result from primary AML cases. The Kaplan-Meier survival analyses show that high expression levels of CUL4A as well as TP73 and the combination of both were significantly correlated with worse prognosis (Figure 8). Further evidence of the relevance of TLS in AML comes from a study by Ziv et al.38 Performing a screen to find novel TLS-regulating genes, they identified the nucleophosmin gene (NPM1) to have a stabilizing effect on the catalytic core of polymerase η and correspondingly impaired TLS in the presence of mutated NPM1 due to increased proteasomal degradation of this polymerase. Mutation of NPM1 is found in 30% of AML patients, and it is an established positive prognostic marker in the revised 2017 European LeukemiaNet classification1 also predicting a good response to cytarabine-based induction therapy. Based on our data, we assume a similar mode of action for the drug pevonedistat in combination with Ara-C: to exert its activity as E3-ligase, CUL4 needs to be neddylated. Treatment with pevonedistat that is an inhibitor of this posttranslational modification should therefore lead to lower levels of active CULLIN complexes and impaired TLS accordingly. The combination of pevonedistat and Ara-C has synergistic effects with Ara-C in AML cell lines and primary AML samples.39, 40 We could additionally show that the treatment with Ara-C in combination with the cullin inhibitor pevonedistat overcomes Ara-C resistance, even in resistant AML cells (Figure 6). To date, two clinical trials to test this combination have been set up (Identifier: NCT03330821, NCT03459859) and promising data of a randomized phase 2 trial combining pevonedistat with another nucleoside analog, azacitidine, were published recently.41 In conclusion, we show here that high expression of CUL4A and TP73 is associated with worse prognosis in AML. Further, we propose that both genes share a common mode of action in this respect by inducing resistance to cytarabine. This effect could be caused by enhanced TLS that allows AML cells to cope with the DNA damage induced by Ara-C, thereby overcoming the subsequent replicative stress. p73 acts as a transcription factor via its newly identified target gene REV3L, and CUL4A mono-ubiquitinates PCNA required for the consecutive recruitment of error-prone translesion DNA polymerases. Based on our model, we also propose a novel mechanism for the synergistic effects of pevonedistat and Ara-C that has been shown in preclinical trials: Pevonedistat inhibits the activity of cullins leading to impaired TLS; comparable to intrinsic deficiency of TLS being an underlying mechanism for the good response to Ara-C treatment in the favorable subgroup of NPM1-mutant AML. The pharmacologic inhibition of CULLIN complexes is a promising therapeutic approach to overcome cytarabine resistance in AML, probably by inhibiting translesion synthesis mechanisms.
ACKNOWLEDGMENTS
We thank Dr. Michael Krause, Sigrid Bischofsberger, Angelika Filmer, and Kathleen Stabla for excellent help and technical assistance. Furthermore, we thank Prof. Dr. Daniel Baumhoer for support during the project.
AUTHOR CONTRIBUTIONS
TS and AN designed and supervised the project. MR, JAS, AMK, and ACB performed experiments. All authors interpreted and/or reviewed the data. MR, JAS, ACB, TS, and AN wrote or edited the article. All of the coauthors reviewed the article.
DISCLOSURES
The authors have no conflicts of interest to disclose.
SOURCES OF FUNDING
This work was funded by The Deutsche Forschungsgemeinschaft (KFO210 Ne310/14-1, Ne310/14-2, and Ne310/18-1) and the German José Carreras Foundation (AH06/01 to A.N.).


