Mitral annular plane systolic excursion on exercise: a simple diagnostic tool for heart failure with preserved ejection fraction
Abstract
Aims
Current guidelines for the diagnosis of heart failure with normal or preserved ejection fraction (HFpEF) are based on measurements at rest. However, in HFpEF ventricular dysfunction is more apparent on exercise. We hypothesized that Mitral annular plane systolic excursion (MAPSE) which is easy to acquire on exercise could be used to detect occult left ventricular (LV) impairment.
Methods and results
Cardiopulmonary exercise testing and 2D-Doppler echocardiography were performed at rest and on exercise. MAPSE was assessed by using M-mode (apical four-chamber view). Sixty-two patients with HFpEF [LV ejection fraction (LVEF)=60 ± 7%] with reduced VO2 max (18.6 ± 5.2 mL/min/kg) and 36 control subjects (LVEF=62 ± 7%, VO2 max 29.4 ± 4.8 mL/min/kg) were studied. MAPSE at rest was significantly lower in patients (10.9 ± 2.1 vs. 12.1 ± 2.2 mm in controls, P= 0.008) which was even more pronounced on exercise (12.0 ± 2.2 mm and 16.2 ± 2.7 mm, respectively, P< 0.001). At rest MAPSE correlated with longitudinal strain (r = 0.432, P= 0.001), peak systolic myocardial velocity (r = 0.545, P< 0.001), and early diastolic myocardial velocity (r = 0.322, P= 0.02) and on exercise with LV apical rotation (r = 0.582, P< 0.001), longitudinal strain (r = 0.589, P< 0.001), and myocardial tissue velocities (P< 0.001). The area under the receiver operating characteristic curve for MAPSE was 0.655 (confidence interval 0.540–0.770) at rest and 0.901 (confidence interval 0.835–0.967) on exercise, to differentiate between patients and controls.
Conclusion
Mitral annular plane systolic excursion at rest and on exercise correlates well with more sophisticated measurements of ventricular function in HFpEF patients. It is potentially a useful and easily acquired measurement, especially on exercise, for the diagnosis of HFpEF.
Introduction
Many patients with heart failure present with a normal or only mildly reduced left ventricular ejection fraction (LVEF; >50%)1,2 and are commonly labelled as having diastolic heart failure or, more precisely, heart failure with preserved ejection fraction (HFpEF).3,4 Although it is well known that these patients show widespread systolic and diastolic dysfunction at rest and on exercise, it is still difficult to confirm the diagnosis.3–7 The European Society of Cardiology (ESC) and the American Society of Echocardiography (ASE) offer diagnostic flowcharts that include comprehensive and complex echocardiographic parameters to assess the impairment of LV function despite normal or only mildly reduced LVEF.3,5 However, some of these parameters can be difficult to measure in these often-obese patients [Difference of duration of reverse pulmonary vein atrial systolic flow and duration of mitral valve atrial wave flow (Ard-Ad)] or require calculations to index to body surface area [left atrial volume index (LAVI) or left ventricular mass index] which is difficult to implement in a busy clinical setting. More recent echocardiographic techniques such as colour tissue doppler imaging (TDI) or speckle tracking are even more time consuming and not applicable in all patients. Furthermore, it is well known that a greater part of LV dysfunction appears on exercise and is often not seen at rest.7 This is not surprising since most patients only develop their symptoms on exercise. Furthermore, problems with accurate diagnosis make assessment of prognosis difficult.8
A simple measurement for diagnosing LV impairment at rest and on exercise in patients with HFpEF is, therefore, required. Speckle tracking (strain) and colour-TDI (Sm, Em) have shown that systolic and diastolic longitudinal function is significantly impaired in HFpEF patients at rest and on exercise.7,9,10 Mitral annular plane systolic excursion (MAPSE) is an easy way to assess longitudinal function and seems to be very sensitive in many different cardiac conditions.11–14 We hypothesized that MAPSE could be helpful for detecting LV impairment at rest and on exercise and could differentiate between patients and healthy controls. We also hypothesized that this parameter may also correlate with the more complex guideline parameters.
Methods
Patients aged >60 years with a clinical diagnosis of heart failure with normal EF were recruited. All patients had signs or symptoms of heart failure (New York Heart Association class II or III), an LVEF >50% assessed from a previous clinical echocardiogram and met the criteria of Vasan and Levy for probable diastolic heart failure.15 Healthy subjects with a comparable mean age were recruited as controls. Patients were studied on treatment (Table 1). Exclusion criteria were: moderate-to-severe pulmonary disease, significant congenital or valvular heart disease (moderate to severe according to ESC/ASE), pacemakers or implantable cardiac defibrillators, or an established history of ischaemic heart disease. All subjects gave written informed consent and the study was approved by the appropriate Research Ethics Committees. Some of the patients and controls were included in a previously published study.7
| Patients (n= 62) | Controls (n= 36) | P-value | |
|---|---|---|---|
| Age | 71 ± 8 | 70 ± 7 | P= 0.599*** |
| Sex | 41♀ /21♂ | 29♀/7♂ | P = 0.166* |
| BMI (kg/m2) | 30.5 ± 4.8 | 24.4 ± 3.4 | P< 0.001*** |
| NYHA | Class II = 44 | / | |
| Class III = 18 | / | ||
| VO2 max (mL/min/kg)(percent of predicted) | 18.6 ± 5.2 | 29.4 ± 4.8 | P < 0.001*** |
| (77 ± 18%) | (133 ± 22%) | ||
| Years of hypertension | 9.0 ± 9.6 | 0 | P < 0.001** |
| NT-proBNP (pg/mL) | 138.2 ± 147.2 | 54.3 ± 24.8 | P = 0.012*** |
| Diabetes mellitus | 16/62 (26%) | 0/36 (0%) | P < 0.001* |
| Atrial fibrillation | 5/62 (8%) | 0/36 (0%) | P = 0.155* |
| ACE-inhibitor | 19/62 (31%) | 0/36 (0%) | P < 0.001* |
| AT1-blocker | 20/62 (32%) | 0/36 (0%) | P < 0.001* |
| Beta-blocker | 22/62 (35%) | 0/36 (0%) | P< 0.001* |
| Ca-channel blocker | 15/62 (24%) | 0/36 (0%) | P= 0.001* |
| Diuretic | 31/62 (50%) | 0/36 (0%) | P< 0.001* |
| Alpha-blocker | 11/62 (18%) | 0/36 (0%) | P = 0.006* |
| Statin | 19/62 (31%) | 0/36 (0%) | P < 0.001* |
| LVEF (Simpson) (%) | 60 ± 7 | 62 ± 7 | P = 0.187*** |
| IVSD (mm) | 11.3 ± 3.2 | 9.4 ± 1.8 | P = 0.004*** |
| PW thickness (mm) | 11.0 ± 2.5 | 9.2 ± 1.5 | P = 0.001*** |
| LVEDD (mm) | 46.6 ± 6.4 | 45.6 ± 5.1 | P = 0.440*** |
| LVESD (mm) | 28.8 ± 5.5 | 28.5 ± 4.2 | P = 0.747*** |
| FS (%) | 38.4 ± 7.7 | 37.6 ± 6.9 | P = 0.618*** |
| LVMI (g/m2) | 94.7 ± 33.2 | 76.5 ± 19.2 | P = 0.010*** |
| LVEDVI (mL) | 40. ± 9.3 | 38.9 ± 8.9 | P = 0.441*** |
| LVESVI (mL) | 16.3 ± 4.8 | 14.9 ± 5.1 | P = 0.265*** |
| LAVI (mL/m2) | 31.7 ± 10.8 | 22.9 ± 7.7 | P < 0.001*** |
| A (m/s) | 0.86 ± 0.20 | 0.72 ± 0.16 | P = 0.001*** |
| E (m/s) | 0.70 ± 0.17 | 0.60 ± 0.11 | P= 0.001*** |
| E/A | 0.82 ± 0.20 | 0.86 ± 0.23 | P= 0.403*** |
| DT (ms) | 239 ± 57 | 250 ± 49 | P = 0.319*** |
| IVRT (ms) | 99 ± 25 | 97 ± 20 | P = 0.723*** |
| E/e’ | 11.3 ± 4.2 | 8.2 ± 1.9 | P < 0.001*** |
- a BMI, body mass index; NYHA, New York Heart Association classification for heart failure; VO2 max, peak oxygen uptake; NT-proBNP, N-terminal pro-brain natriuretic peptide; LVEF, left ventricular ejection fraction; IVSD, diastolic interventricular septal thickness; PW, posterior wall; LVEDD, left ventricular end-diastolic diameter; LVESD, left ventricular end-systolic diameter; FS, fractional shortening; LVMI, left ventricular mass index; LVEDVI, left ventricular end-diastolic volume index; LVESVI, left ventricular end-systolic volume index; LAVI, left atrial volume index; E, early mitral diastolic inflow velocity; A, late mitral diastolic inflow velocity; E/A, ratio of early to late Mitral inflow velocities; DT, deceleration time of peak early Doppler Mitral filling velocity; IVRT, isovolumic relaxation time; E/e’, ratio of early mitral diastolic inflow velocity to early diastolic mitral annular velocity.
- b Data are mean ± standard deviation.
- * Fisher's exact test.
- ** Mann–Whitney U Test.
- *** Unpaired t-test.
Cardiopulmonary exercise test
Subjects had standard spirometry before they underwent incremental treadmill exercise testing with metabolic gas exchange and simultaneous heart rate, blood pressure, and oxygen saturation monitoring using a modified Bruce protocol as previously described.7,16
Two-dimensional and tissue Doppler echocardiography
All subjects underwent a full echocardiographic examination at rest and on exercise using a GE Vingmed Vivid Seven scanner (Horton, Norway). Exercise echocardiography was performed on a semi-recumbent and tilting bicycle ergometer (Lode BV, Netherlands) to a maximum heart rate of 100 bpm (i.e. sub-maximal exercise to maximize frame rates). All patients became symptomatic during exercise (fatigue or dyspnoea). Blood pressure was measured at rest and on peak exercise. Rate pressure products were calculated. Images were recorded while subjects were still peddling. At least three sets of images with loops consisting of three consecutive cardiac cycles each were stored for offline analysis using a customized software package (EchoPac, GE Healthcare, Little Chalfont, Buckinghamshire, UK). Analysis was performed in three cycles by two of four experienced members from the working group (F.W.G.W., Y.T.T., F.C., and E.S.P.L.). Left ventricular volume and EF were measured using the modified biplane Simpson's method.17 Left ventricular mass was calculated according to the Devereux formula.18 Left atrial (LA) volume was calculated using the biplane area-length method and indexed to body surface area to derive LAVI.19
Mitral annular plane systolic excursion was measured by using the apical four chamber view focused on the left ventricle. An M-mode vector was placed through the mitral annulus close to the septal and the lateral wall, respectively. The vector was adjusted to be as parallel to the walls as possible by using anatomical M-mode where necessary. Mitral annular plane systolic excursion was measured in millimetres as previously described.11–14 Values of both walls were averaged.
The early filling (E) and atrial filling (A) peak velocities, E/A ratio, deceleration time of early filling, and isovolumic relaxation time were measured from transmitral flow.
Colour M-mode Doppler was obtained by positioning the scan line through the mitral valve with the Nyquist limit and the colour baseline adjusted to obtain the best spatial resolution. The mitral flow propagation velocity (Vp) was measured by the slope along the aliasing isovelocity line as previously described.7
Peak mitral annular myocardial velocities of two walls of the left ventricle (septal and lateral) were recorded with real-time pulsed wave tissue Doppler method as previously described.7 The peak early diastolic mitral annular velocity (e’) was measured and values averaged. E/e’, an index of LV filling pressure, was calculated.20 Colour-coded tissue Doppler images were acquired for four (septal, lateral, inferior, and anterior) myocardial walls and analysed offline, as previously described, to assess systolic myocardial (Sm) and diastolic myocardial (Em) velocities.7
In a second step, patients were categorized as HFpEF or non-HFpEF patients according to the criteria of the ESC.3
Speckle tracking
Left ventricular longitudinal strain, radial strain, and rotation were assessed using the speckle tracking method.7 Offline analysis of apical 4- and 2-chamber images, and short-axis images at three levels (basal, mid-ventricular, and apical) were completed by tracing the endocardium in end diastole and the thickness of the region of interest adjusted to include the entire myocardium. Rotation and radial strain in short axis, and longitudinal strain in long-axis images, were measured as previously described.7
Derived parameters
Stroke volume was calculated using the aortic valve pulsed wave Doppler method.7 End-systolic meridional wall stress was calculated using radial parameters (posterior wall thickness and inner diameter) from the short-axis image at the papillary muscle level, according to an equation published by Reichek et al.21
Statistical methods
Sample size was estimated using pilot data.6 Statistical analysis was performed using SPSS version 15.0 (Chicago, IL, USA). Continuous variables are expressed as mean ± standard deviation. Comparisons between patients and controls were performed using an unpaired t-test for normally distributed data and Mann–Whitney U test for non-normally distributed data (years of hypertension). Comparisons between HFpEF patients, non-HFpEF patients, and controls were performed using analysis of variance with Tukey test as post-hoc analysis.
To compare resting and exercise data within the patients and the controls, a paired t-test was used for normally distributed data.
Receiver operating characteristic (ROC) curves were plotted to examine the ability of MAPSE to differentiate patients and healthy controls at rest and on exercise or to differentiate between patients fulfilling the ESC HFpEF criteria and healthy controls at rest and on exercise. Pearson's correlation coefficient was used to examine associations between variables.
Inter-observer and intra-observer agreements were performed using readings from 20 randomly selected subjects and calculated using Alpha model reliability analysis and reported as inter-class correlation coefficient (ICC) with 95% confidence interval. A P-value <0.05 was considered significant.
Results
A total of 149 subjects (92 patients and 57 controls) were recruited. Thirty patients were excluded as follows: eight were found to have respiratory limitation on cardiopulmonary exercise test (CPET), 15 were unable to exercise or had poor image quality for analysis, five had no increase in heart rate on exercise, one was found to have evidence of ischaemia on CPET and one had a normal VO2 max on exercise. Of the 57 healthy controls recruited, only 36 had no relevant past medical history or medications and could be included in the study. Of the 21 healthy control subjects excluded, 19 had evidence of hypertension (previously undiagnosed) at rest, one subject fulfilled the echocardiographic criteria for HFpEF, and one had poor image quality for analysis. Demographic data for the patients and healthy controls are presented in Table 1.
The LVEF and LV dimensions were comparable between patients and controls. Left ventricular mass index, LAVI, mitral inflow E and A waves, and E/e’ were significantly higher in patients than in controls (Table 1).
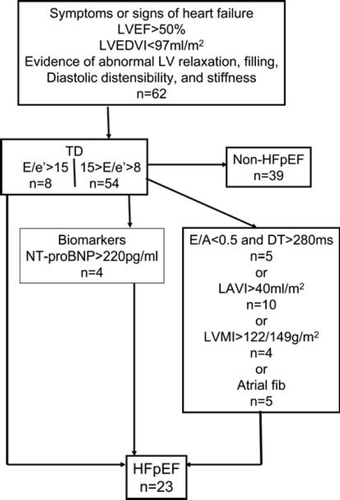
Twenty three patients fulfilled the HFpEF criteria of the ESC (Figure 1).
Haemodynamic changes
Resting and exercise heart rates were comparable between the two groups. Patients had a slightly increased systolic blood pressure at rest compared with healthy controls. On exercise, systolic and diastolic blood pressure was comparable between the groups. Rate−pressure products were comparable at rest and on exercise. Patients had a higher stroke volume at rest due to a higher velocity time integral (VTI) of the aortic outflow, but they were unable to increase stroke volume as much as healthy controls, so that the significant difference disappeared on exercise (Table 2).
| Patients rest | Patients ex | P-value* | Controls rest | Controls ex | P-value** | P-value | |
|---|---|---|---|---|---|---|---|
| HR (bpm) | 69 ± 12 | 91 ± 10 | P< 0.001 | 69 ± 11 | 93 ± 9 | P < 0.001 | P = 0.985*** |
| P = 0.368**** | |||||||
| BP (mmHg) | Sys: 146 ± 14 | Sys: 167 ± 16 | P < 0.001 | Sys: 138 ± 12 | Sys: 162 ± 14 | P < 0.001 | P = 0.045***s |
| P = 0.905***d | |||||||
| Dia: 79 ± 11 | Dia: 88 ± 11 | P < 0.001 | Dia: 79 ± 8 | Dia: 86 ± 8 | P < 0.001 | P = 0.133****s | |
| P = 0.044****d | |||||||
| Rate−Press product (mmHg×bpm) | 102 ± 23 | 153 ± 25 | P < 0.001 | 95 ± 19 | 152 ± 22 | P < 0.001 | P = 0.107*** |
| P = 0.827**** | |||||||
| Meridional WS (g/cm2) | 47.6 ± 13.3 | 53.5 ± 13.8 | P = 0.220 | 53.8 ± 12.0 | 61.1 ± 9.6 | P = 0.044 | P = 0.030*** |
| P = 0.011**** | |||||||
| SV (mL/min) | 73 ± 25 | 76 ± 24 | P = 0.375 | 65 ± 15 | 80 ± 24 | P = 0.006 | P = 0.070*** |
| P = 0.514**** | |||||||
| CO (L/min) | 5.3 ± 2.2 | 6.7 ± 2.2 | P < 0.001 | 4.5 ± 1.2 | 7.5 ± 2.6 | P < 0.001 | P = 0.056*** |
| P = 0.150**** | |||||||
| Sm (cm/s) | 5.0 ± 0.9 | 6.0 ± 1.2 | P < 0.001 | 5.9 ± 1.4 | 7.7 ± 1.4 | P < 0.001 | P = 0.001*** |
| P < 0.001**** | |||||||
| Em (cm/s) | 4.6 ± 1.6 | 6.5 ± 1.8 | P < 0.001 | 5.6 ± 1.3 | 8.3 ± 1.8 | P < 0.001 | P = 0.003*** |
| P < 0.001**** | |||||||
| GlobLong Strain (%) | −18.3 ± 3.3 | −19.9 ± 4.0 | P < 0.001 | −21.1 ± 3.0 | −23.9 ± 2.5 | P < 0.001 | P = 0.002*** |
| P < 0.001**** | |||||||
| RadStrain (%) | 41.8 ± 14.5 | 48.9 ± 16.0 | P = 0.039 | 49.2 ± 13.6 | 58.9 ± 13.1 | P = 0.002 | P = 0.046*** |
| P = 0.021**** | |||||||
| ApicalRot (°) | 10.9 ± 4.3 | 13.6 ± 4.6 | P = 0.001 | 13.0 ± 3.1 | 18.0 ± 3.8 | P < 0.001 | P = 0.030*** |
| P < 0.001**** | |||||||
| Vp (m/s) | 39.7 ± 8.5 | 52.8 ± 13.0 | P < 0.001 | 39.8 ± 7.9 | 67.0 ± 17.9 | P < 0.001 | P = 0.990*** |
| P < 0.001**** | |||||||
| MAPSE (mm) | 10.9 ± 2.1 | 12.0 ± 2.2 | P < 0.001 | 12.1 ± 2.2 | 16.2 ± 2.7 | P < 0.001 | P = 0.008*** |
| P < 0.001**** |
- a HR, heart rate; BP, blood pressure; s, systole; d, diastole; Rate−Press product, rate−pressure product; Meridional WS, end-systolic meridional wall stress; LVEF, left ventricular ejection fraction (Simpson); SV, stroke volume; CO, cardiac output; Sm, systolic mitral annular velocity; Em, early diastolic annular velocity; GlobLong Strain, global longitudinal strain; RadStrain, radial strain; ApicalRot, peak apical rotation; Vp, mitral flow propagation velocity; MAPSE, mitral annular plane systolic excursion.
- b Data are mean ± standard deviation.
- * Paired t-test between rest and exercise for patients.
- ** Paired t-test between rest and exercise for controls.
- *** Unpaired t-test between patients and controls at rest.
- **** Unpaired t-test between patients and controls on exercise.
End-systolic meridional wall stress was significantly different for patients and controls at rest and on exercise. Patients had less wall stress due to a thicker posterior wall and a smaller inner diameter, while blood pressure was comparable at rest and on exercise (Table 2).
Longitudinal function—tissue Doppler and speckle tracking
Mitral annular velocities in systole and early diastole (Sm and Em colour TDI), longitudinal strain, radial strain, and apical rotation at rest were significantly lower in patients compared with controls (Table 2). On exercise these differences were even more pronounced, as previously described.7
Mitral flow propagation velocity
Mitral flow propagation velocity (Vp) was comparable between patients and controls at rest but became significantly different on exercise, due to a significant increase in Vp on exercise in control subjects (Table 2).
Mitral annular plane systolic excursion
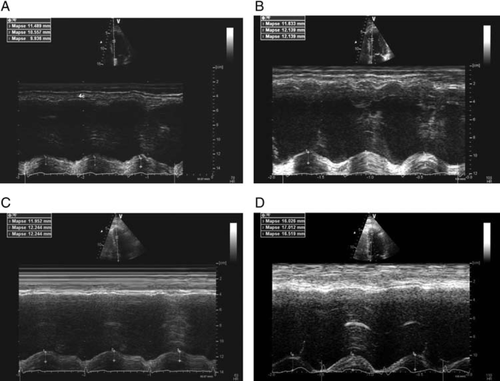
In patients, MAPSE was significantly reduced at rest and even more so on exercise (Figure 2). Patients had a significantly smaller increase in MAPSE (Table 2:▵MAPSE 1.2 ± 1.2 compared with controls 4.0 ± 2.4 P< 0.001). Patients with HFpEF had a comparable MAPSE at rest compared with non-HFpEF patients (10.6 ± 2.6 vs. 11.0 ± 1.7 mm, P= 0.737). On exercise there was a slight but non-significant difference (11.2 ± 1.8 vs. 12.4 ± 2.3 mm, P= 0.147). Analysis-of-variance analysis for all three groups (HFpEF patients, non-HFpEF patients, and controls) showed a significant difference at rest (P= 0.023) and on exercise (P< 0.001).
Correlations and receiver operating characteristic curves
Mitral annular plane systolic excursion at rest correlated well with many HFpEF criteria, colour TDI, and speckle tracking parameters (Table 3). These correlations were even more marked on exercise. Clinical parameters (VO2 max, years of hypertension) correlated with MAPSE on exercise.
| MAPSE at rest | MAPSE on exercise | |||
|---|---|---|---|---|
| Pearson correlation | Significance (P-value) | Pearson correlation | Significance (P-value) | |
| LVMI | 0.176 | 0.128 | 0.204 | 0.086 |
| LAVI | 0.220 | 0.038 | 0.279 | 0.009 |
| CO | 0.156 | 0.148 | 0.303 | 0.011 |
| Sm | 0.545 | <0.001 | 0.730 | <0.001 |
| Em | 0.322 | 0.002 | 0.357 | 0.001 |
| E/e’ | 0.331 | 0.001 | 0.359 | 0.001 |
| Longitudinal Strain | 0.432 | 0.001 | 0.589 | <0.001 |
| Radial strain | 0.196 | 0.133 | 0.338 | 0.017 |
| Apical rotation | 0.283 | 0.019 | 0.582 | <0.001 |
| Vp | 0.105 | 0.319 | 0.519 | <0.001 |
| VO2 max | 0.197 | 0.097 | 0.512 | <0.001 |
| LVEF | 0.282 | 0.014 | 0.326 | 0.013 |
| Rate−Press product (mmHg×bpm) | 0.283 | 0.008 | 0.032 | 0.773 |
- a MAPSE, mitral annular plane systolic excursion; LVMI, left ventricular mass index; LAVI, left atrial volume index; CO, cardiac output; Sm, systolic mitral annular velocity; Em, early diastolic annular velocity; E/e’, ratio of early mitral diastolic inflow velocity to e’; Vp, mitral flow propagation velocity; VO2 max, peak oxygen uptake; LVEF, left ventricular ejection fraction; Rate−Press product, rate−pressure product.
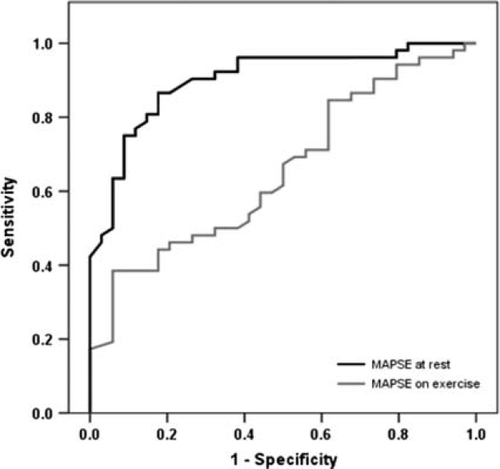
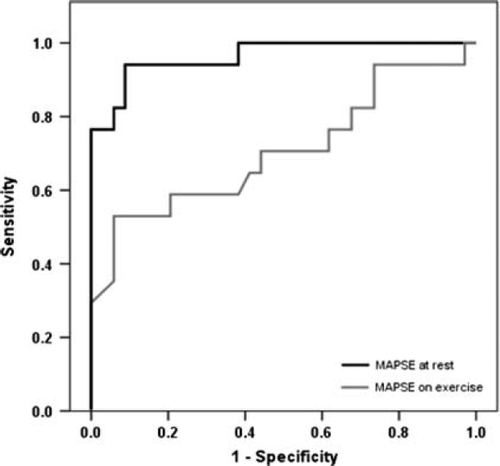
The ROC for MAPSE at rest showed an area under the curve (AUC) of 0.665 (CI = 0.540–0.770) and for MAPSE on exercise an AUC of 0.901 (CI = 0.835–0.967, Figure 3), to differentiate between patients and controls. Using MAPSE on exercise <14.5 mm as a cut-off to identify patients the sensitivity was 91% and the specificity 76%. The ROCs to differentiate between patients fulfilling the ESC criteria for HFpEF and controls, showed an AUC of 0.707 for MAPSE at rest (CI = 0.539–0.875) and an AUC of 0.964 for MAPSE on exercise (CI = 0.914–1.014, Figure 4). Using MAPSE on exercise <13.5 mm as a cut-off to identify patients fulfilling the ESC criteria for HFpEF3 sensitivity was 95% and specificity was 85%.
Inter- and intra-observer variability
The inter-observer variability at rest by ICC was between 0.81 and 0.96. On exercise, ICC varied from 0.67 to 0.99, Vp had the highest inter-observer variability. The ICC of MAPSE at rest was 0.82 and on exercise 0.83.
The intra-observer variability by ICC at rest varied from 0.83 to 0.98 and on exercise 0.66 to 0.98. Again Vp had the highest variability compared with other measurements. The ICC of MAPSE at rest was 0.83 and on exercise 0.88, respectively.
Discussion
This study demonstrates that MAPSE measured at rest and on exercise is a potentially useful tool to identify patients with heart failure and impaired LV function despite a normal EF. It is a simple way to assess LV function and it is reduced even when LVEF is still normal. Mitral annular plane systolic excursion correlates with other parameters such as E/e’ and LAVI, which have been included in recent guidelines for the diagnosis of HFpEF.3,5 It also correlates with more sophisticated and time-consuming measurements of LV function, such as longitudinal strain, apical rotation, and Sm. Mitral annular plane systolic excursion also correlates with diastolic parameters (Em, Vp) illustrating the close relation between systolic and diastolic function, particularly on exercise. Furthermore, MAPSE on exercise correlates with clinical parameters such as VO2 max and the duration of known hypertension. Therefore, MAPSE is a potentially very useful tool for the diagnosis of HFpEF as it can be easily obtained even on exercise and in the majority of obese patients. Since exercise intolerance is the cardinal manifestation of heart failure, it is important to assess LV function during exercise that gives a more complete and often revealing assessment of the degree of LV dysfunction.
Mitral annular plane systolic excursion was used in early studies as a marker of LV function but was soon eclipsed by the introduction of TDI. In 1997, Willenheimer et al.22 showed that MAPSE was strongly related to one-year mortality with no deaths in those with MAPSE>10 mm but 36% mortality in those with MAPSE <6.4 mm. Similar results were found by Nikitin et al.23 More recently, in a 10-year follow-up study Grüner-Sveälv et al.24 found that MAPSE was a strong risk predictor of long-term survival and in a multivariate Cox proportional hazard analysis, adjusting for age, gender, heart rate, systolic blood pressure, and short-axis fractional shortening, MAPSE was the only independent predictor of outcome (hazard ratio=0.89). These results emphasize the importance of longitudinal function and the motion of the mitral annulus in overall LV function and mechanics. In addition, the downward movement of the annulus during systole is also a reflection of LV twist or torsion which helps to pull the annulus towards the apex; interestingly, we found a good correlation between MAPSE and apical rotation. Carlsson et al.25 estimated from magnetic resonance imaging studies that 60% of the normal stroke volume is due to longitudinal shortening of the ventricle. Furthermore, in diastole, recoil of the aortic valve (AV) plane is very important to aid early LV filling as movement of the annulus upwards around the incoming column of blood aids filling significantly. Loss of AV plane motion will have a serious impact on LV function and may explain why it is also an early marker of LV mechanical dysfunction.
Carluccio et al.26 recently showed that deformation indices detect abnormal systolic function in HFpEF patients more accurately than velocities. But deformation measurements are not so robust or clinically reliable as TDI or MAPSE.
The ratio of the E and e’ (E/e’) is an indirect marker of LV end-diastolic pressure (LVEDP) and it is a major factor in the ESC guidelines for the diagnosis of HFpEF. E/e’ can also be measured on exercise. Burgess et al.27 found that an E/e’ >13 on exercise could accurately identify a raised LVEDP >15 mmHg. However, in a previous study, we found that E/e’ did not increase consistently on exercise in patients with HFpEF.7 Recently, doubts have been raised about the accuracy of the E/e’ ratio as a non-invasive measurement of LVEDP in all situations.28 Also, on exercise, fusion of the mitral inflow E and A waves frequently occurs at higher heart rates that can make precise measurement of E/e’ difficult. In contrast, MAPSE is a more robust measurement and easier and quicker to obtain when heart rate is increased on exercise.
This study has some limitations as follows. Apical rotation only was used for the analysis, since basal rotation on exercise was unreliable due to through-plane motion which increases during exercise. The LV apex is relatively fixed in position and allows reliable speckle tracking analysis on exercise. In addition, apical rotation has been shown to represent the dominant component of the overall LV torsion.29 Recent reports suggest that both Em and Sm may be after-load dependent,30 and MAPSE is almost certain to be too, but in our study arterial blood pressure was similar in patients and controls both at rest and on exercise. Exercise was submaximal but patients were symptomatic at this level of exercise, thus reflecting a realistic level of exercise in this age group. Also, the frame-rate limitations of speckle tracking reduce the maximal heart rate that can be used for testing. This problem should not affect MAPSE and further studies could be done using maximal exercise testing with MAPSE as the index of LV function.
All patients were taking medication as it was considered unethical to stop treatment. Diuretics reduce symptoms and there is a suggestion that angiotensin-converting enzyme inhibitors and angiotensin receptor antagonists may improve longitudinal function.31 It is probable that the effect of treatment would be to improve longitudinal function and, therefore, reduce the differences in MAPSE that we saw between patients and controls. In addition, if treatment was stopped in these hypertensive patients it would have been difficult to account for the resulting increase in arterial blood pressure on exercise.
In conclusion, we have shown that MAPSE is a simple and technically easy measurement to obtain at rest and on exercise and it reflects more sophisticated indices of LV function. Annular motion is a fundamental property of ventricular function and the simple M-mode measurement, MAPSE, appears to be a robust and good discriminator especially if recorded on exercise.
Acknowledgement
The authors thank Rebekah Weaver and Stuart Wragg for their assistance.
Funding
The British Heart Foundation (grant number: PG/06/106/21472) and North Staffs Heart Committee.
Conflict of interest: none declared.


