Prognostic significance of different measures of the ventilation-carbon dioxide relation in patients with suspected heart failure
Abstract
Aims
We studied the prognostic significance of the ventilatory equivalent of carbon dioxide production (VEqCO2) at different time-points of a maximal cardiopulmonary exercise test (CPET) in patients with suspected heart failure (HF).
Methods and results
The VEqCO2 was calculated at three different time-points; VEqCO2 (rest) was calculated following 30 s of resting data immediately prior to the start of exercise; VEqCO2 (nadir) was the lowest 30-s average over the duration of the test; VEqCO2 (peak) was calculated using the mean value of the final 30 s of exercise. We included a healthy control group who had no evidence of cardiorespiratory disease. Four hundred and twenty-three patients with suspected HF (mean age 63 ± 12 years; 80% males; left ventricular ejection fraction 36 ± 6 %; peak oxygen uptake 22.3 ± 8.1 mL kg−1 min−1; VE/VCO2 slope 34 ± 8) were included in the study. Seventy-eight healthy participants (62% males; age 61 ± 11 years) were recruited as controls. One hundred and eighteen patients died during follow-up with a median follow-up of 8.6 ± 2.1 years in survivors. The strongest univariable predictors of all-cause mortality were VEqCO2 (nadir) (χ2 = 47.9), peak oxygen uptake (χ2 = 53.0), and the VE/VCO2 slope (χ2 = 31.7). In a Cox multivariable proportional hazards model, VEqCO2 (nadir) (χ2 = 8.8), peak systolic blood pressure (χ2 = 6.0), and age (χ2 = 6.6) were the most potent independent predictors of all-cause mortality.
Conclusion
The VEqCO2 (nadir) provides greater prognostic value than other related ventilatory variables in patients with suspected HF. Further work in other populations is required to confirm our conclusions.
Introduction
Cardiopulmonary exercise testing (CPET) is used to give diagnostic and prognostic information in patients with cardiorespiratory disease.1 During exercise in healthy individuals, there is a linear relation between minute ventilation (VE) and carbon dioxide production (VCO2), and the ventilatory response can be characterised by the slope of the relation between the two variables (the VE/VCO2 slope). In patients with chronic heart failure (CHF), the gradient of the VE/VCO2 slope is greater than normal, so that for a given volume of carbon dioxide production, the ventilatory response is greater.2–6
Another way of characterising the relation between these variables is the instantaneous ratio of ventilation to carbon dioxide production, the ventilatory equivalent for CO2 (VEqCO2). During a maximal incremental exercise test in healthy subjects, there is an initial decrease in VEqCO2 at the onset of exercise, followed by a plateau. Towards the end of exercise, lactic acid production causes an increase in ventilation relative to carbon dioxide production and thus the VEqCO2 rises. We have observed the same pattern in patients with CHF, although with more severe HF, there was a more pronounced increase in VEqCO2 towards the end of exercise.7 In the most severely affected patients, VEqCO2 increased from the start of exercise.
The VEqCO2 at peak exercise has similar8 or superior9 prognostic power to the VE/VCO2 slope. The VEqCO2 at the anaerobic threshold (AT) (which is comparable with the lowest VEqCO210) provided additive prognostic value to peak oxygen uptake,11 and was similar to the VEqCO2 at peak exercise.12 Recently, Myers et al.13 evaluated the prognostic power of the lowest VE/VCO2 ratio (VEqCO2 nadir). The higher the VEqCO2 (nadir), the worse the risk in patients with CHF. In multivariable analysis, the lowest VE/VCO2 ratio (defined as the lowest minute sample collected during the CPET) was similar to the VE/VCO2 slope in predicting risk in 847 patients.13 We are not aware of any studies that have evaluated the prognostic value of VEqCO2 at rest before exercise. We wanted to determine the prognostic significance of VEqCO2 at different time-points during a maximal incremental CPET in patients with suspected HF.
Methods
The Hull and East Riding Ethics Committee approved the study, and all patients provided informed consent. We recruited consecutive patients referred to a community HF clinic with symptoms of breathlessness (NYHA functional class II–III) who were found to have left ventricular systolic dysfunction (LVSD) on investigation. Clinical information obtained included past medical history and drug and smoking history. Clinical examination included assessment of body mass index (BMI), heart rate, rhythm, and blood pressure. Patients were excluded if they were unable to walk without assistance from another person (not including mobility aids), or if they were unable to exercise because of non-cardiac limitations (such as osteoarthritis), or had significant respiratory disease (defined as a predicted forced expiratory volume in 1 second <70%).
Heart failure was defined as the presence of current symptoms of HF, or a history of symptoms controlled by ongoing therapy, due to cardiac dysfunction and in the absence of any more likely cause.14 Left ventricular function was determined from 2D echocardiography, and was carried out by one of three trained operators. Left ventricular function was assessed by estimation on a scale of normal, mild, mild-to-moderate, moderate, moderate-to-severe, and severe impairment, and was assessed by a second operator blind to the assessment of the first; where there was disagreement on the severity of LV dysfunction, the echocardiogram was reviewed jointly with the third operator and a consensus reached. The left ventricular ejection fraction (LVEF) was calculated using Simpson's formula from measurements of end-diastolic and end-systolic volumes on apical 2D views, following the guidelines of Schiller et al.15 and LVSD was diagnosed if LVEF was ≤45%.
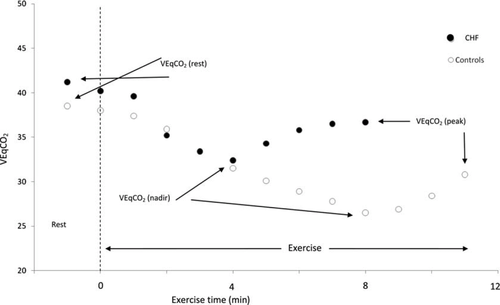
Patients underwent a symptom-limited, treadmill maximal CPET using the Bruce protocol modified by the addition of a Stage 0 (2.74 km h−1 and 0% gradient). Metabolic gas exchange was measured with an Oxycon Delta metabolic cart (VIASYS Healthcare, Inc., Philadelphia, PA, USA).16 Peak oxygen uptake (pVO2) was calculated as the average VO2 for the final 30 s of exercise.17 The ventilatory AT was calculated by the V-slope method.18 The gradient of the relationship between VE and VCO2 (VE/VCO2 slope) was calculated by linear regression analysis using data acquired from the whole test.19 The VEqCO2 output ratio was calculated at three different time-points; VEqCO2 (rest) was calculated from the last 30 s of resting data before the start of exercise. Ventilatory equivalent for carbon dioxide production was then plotted from start to finish of exercise. Each consecutive 30-s reading was averaged and the lowest point was defined as the VEqCO2 (nadir).10 The VEqCO2 (peak) was calculated from the final 30 s of exercise. Figure 1 graphically demonstrates a typical response in the VEqCO2 relation during rest and exercise in a CHF patient.
The VEqCO2 (rest), (nadir), and (peak) outputs were used to generate ratio values including VEqCO2 (rest/peak ratio), VEqCO2 (nadir/peak ratio), and VEqCO2 (rest/nadir ratio). The peak respiratory exchange ratio (pRER) was calculated as the mean VCO2/VO2 ratio for the final 30 s of exercise. For comparative purposes, we also included a healthy control group who had no evidence of cardiac, respiratory, or musculoskeletal limitation. Healthy controls were randomly invited to participate from two local GP practices.
Statistical analysis
Predictive Analytics Software (SPSS version 17.0) was used to analyse the data. Continuous variables are presented as mean ± SD, and categorical data are presented as percentages. Continuous variables were assessed for normality by the Kolmogorov–Smirnov test. An arbitrary level of 5% statistical significance was used throughout (two-tailed). An independent t-test was used to measure differences between suspected HF patients and healthy controls.
All survivors were followed for a minimum of 12 months and we therefore give the probability of 12-month survival. All baseline variables were entered as potential univariable predictors of mortality using Cox analysis, and we adjusted for age, sex, BMI, aetiology of HF, and severity of LV dysfunction (none, trivial, mild, mild-to-moderate, moderate, moderate-to-severe, severe). A multivariable Cox proportional hazards model using the forward Wald method was used to identify independent predictors of all-cause mortality from all candidate predictor variables in Table 1. We used a Pearson product moment correlation (r ≥ 0.30) to identify colinearity between candidate variables. The outcome measure was all-cause mortality. Receiver operator characteristic (ROC) curves were used to identify the value of the strongest predictor variables of survival to 12 months. We reported the area under the curve (AUC) with 95% confidence intervals (CI), sensitivity, specificity, and optimal cut-points in our ROC analysis. To define the optimal cut-point, we used the point closest to the upper left corner of the ROC curve, often known as the (0, 1) criterion. Kaplan–Meier survival curves were plotted for the strongest candidate predictors; data were dichotomised by optimal cut-points.
| Variable (mean ± SD) | CHF patients | Healthy controls | P-valuea |
|---|---|---|---|
| n | 423 | 78 | |
| Males (%) | 80 | 62 | 0.0001a |
| Age (years) | 63 (12) | 61 (11) | 0.529 |
| BMI (kg m−2) | 28 (5) | 26 (3) | 0.001a |
| LVEF (%) | 36 (6) | 60 (6) | 0.0001a |
| pVO2 (mL kg−1 min−1) | 22.3 (8.1) | 36.2 (8.8) | 0.0001a |
| VE/VCO2 slope (full) | 33.8 (7.7) | 27.7 (3.0) | 0.0001a |
| VEqCO2 (rest) | 41.2 (6.5) | 38.5 (4.6) | 0.001a |
| VEqCO2 (nadir) | 32.4 (6.2) | 26.5 (3.0) | 0.0001a |
| VEqCO2 (peak) | 36.7 (8.0) | 30.8 (3.6) | 0.0001a |
| VEqCO2 (rest/peak ratio) | 1.14 (0.17) | 1.26 (0.17) | 0.0001a |
| VEqCO2 (nadir/peak ratio) | 0.89 (0.08) | 0.86 (0.07) | 0.007a |
| VEqCO2 (rest/nadir ratio) | 1.29 (0.16) | 1.46 (0.17) | 0.0001a |
| AT (mL kg−1 min−1) | 15.2 (5.7) | 23.4 (6.6) | 0.0001a |
| Peak RER | 1.07 (0.10) | 1.08 (0.06) | 0.223 |
| Exercise duration (s) | 564 (250) | 881 (256) | 0.0001a |
| Heart rate (rest) (b.p.m.) | 76 (15) | 72 (12) | 0.079 |
| Heart rate (peak) (b.p.m.) | 136 (30) | 165 (20) | 0.0001a |
| Systolic BP (rest) (mmHg) | 137 (25) | 148 (20) | 0.0001a |
| Systolic BP (peak) (mmHg) | 172 (36) | 199 (22) | 0.0001a |
| Diastolic BP (rest) (mmHg) | 84 (15) | 90 (9) | 0.0001a |
| Diastolic BP (peak) (mmHg) | 93 (22) | 101 (21) | 0.003a |
| Loop diuretic (%) | 67 | — | — |
| ACE-I (%) | 75 | — | — |
| Beta-blocker (%) | 77 | — | — |
- a BMI, body mass index; LVEF, left ventricular ejection fraction; pVO2, peak oxygen uptake; ACE-I, ACE-inhibitor; peak RER, peak respiratory exchange ratio; AT, anaerobic threshold; BP, blood pressure.
- a Differences between CHF and healthy controls, P< 0.05.
Results
Four hundred and twenty-three suspected HF patients (mean age 63 ± 12 years; 80% males; LVEF 36 ± 6 %; peak VO2 22.3 ± 8.1 mL kg−1 min−1;VE/VCO2 slope 34 ± 8) were included in the study. Of these, 75% were taking ACE-inhibitors, 77% beta-blockers, and 67% loop diuretics. Seventy-eight healthy subjects (62% males; age 61 ± 11 years) were recruited as a control group. The healthy controls had a higher peak oxygen uptake and lower VE/VCO2 slope. Their VEqCO2 was lower at all time points, but the ratios of VEqCO2 (rest/peak ratio) and VEqCO2 (rest/nadir ratio) were higher (Table 1).
One hundred and eighteen patients died during follow-up, representing a crude death rate of 28%. In surviving patients, the median follow-up time was 8.6 ± 2.1 years. Univariable predictors of outcome derived from the exercise tests are shown in Table 2. With the exception of VEqCO2 (nadir/peak) ratio, all candidate variables were significant univariable predictors. The strongest univariable predictors of all-cause mortality were peak oxygen uptake (χ2 = 53.0), VEqCO2 (nadir) (χ2 = 47.9), and the VE/VCO2 slope (χ2 = 31.7). Following adjustment for age, sex, BMI, severity of LV dysfunction, and aetiology of CHF (Table 3), peak oxygen uptake (χ2 = 25.8), VEqCO2 (nadir) (χ2 = 19.1), and the VE/VCO2 slope (χ2 = 15.8) were the strongest univariable predictors of mortality.
| Variables | P-value | HR | 95% CI | χ2 | |
|---|---|---|---|---|---|
| VEqCO2 (rest) | 0.0001 | 1.062 | 1.038 | 1.087 | 26.1 |
| VEqCO2 (nadir) | 0.0001 | 1.095 | 1.068 | 1.122 | 47.9 |
| VEqCO2 (peak) | 0.0001 | 1.051 | 1.034 | 1.068 | 27.3 |
| VEqCO2 (rest/peak ratio) | 0.008 | 0.222 | 0.073 | 0.676 | 8.9 |
| VEqCO2 (nadir/peak ratio) | 0.277 | 2.289 | 0.199 | 6.308 | 1.2 |
| VEqCO2 (rest/nadir ratio) | 0.001 | 0.111 | 0.032 | 0.383 | 18.5 |
| VE/VCO2 slope | 0.0001 | 1.060 | 1.041 | 1.079 | 31.7 |
| Peak oxygen uptake | 0.0001 | 0.891 | 0.862 | 0.920 | 53.0 |
| Anaerobic threshold | 0.0001 | 0.870 | 0.828 | 0.914 | 28.3 |
| Variables | P-value | HR | 95% CI | χ2 | |
|---|---|---|---|---|---|
| Peak oxygen uptake | 0.0001 | 0.866 | 0.818 | 0.916 | 25.8 |
| VEqCO2 (nadir) | 0.001 | 1.072 | 1.028 | 1.117 | 19.1 |
| VE/VCO2 slope | 0.006 | 1.042 | 1.012 | 1.074 | 15.8 |
| Anaerobic threshold | 0.0001 | 0.868 | 0.801 | 0.939 | 15.7 |
| VEqCO2 (peak) | 0.012 | 1.038 | 1.008 | 1.068 | 14.3 |
| VEqCO2 (rest/nadir ratio) | 0.014 | 0.105 | 0.017 | 0.634 | 13.1 |
| VEqCO2 (rest/peak ratio) | 0.036 | 0.146 | 0.024 | 0.881 | 11.7 |
| VEqCO2 (rest) | 0.236 | 1.025 | 0.984 | 1.067 | 9.4 |
| VEqCO2 (nadir/peak ratio) | 0.700 | 2.138 | 0.044 | 2.796 | 7.5 |
- a Model adjusted for: age, sex, BMI, severity of LV dysfunction; aetiology of CHF.
In a Cox multivariable proportional hazards model, VEqCO2 (nadir) (χ2 = 8.8), peak systolic blood pressure (χ2 = 6.0), and age (χ2 = 6.6) were the most potent independent predictors of all-cause mortality in patients (Table 4). VEqCO2 (nadir) was highly correlated with VE/VCO2 slope (r= 0.92; P= 0.0001), and moderately inversely correlated with peak oxygen uptake (r= −0.58; P= 0.0001). Peak oxygen uptake showed a moderate inverse correlation with VE/VCO2 slope (r= −0.46; P= 0.0001).
| Variables | χ2 | P-value | HR | 95% CI | |
|---|---|---|---|---|---|
| VEqCO2 (nadir) | 8.76 | 0.003 | 1.07 | 1.023 | 1.116 |
| Peak SBP (mmHg) | 5.95 | 0.02 | 0.99 | 0.980 | 0.998 |
| Age (years) | 6.57 | 0.01 | 1.05 | 1.011 | 1.089 |
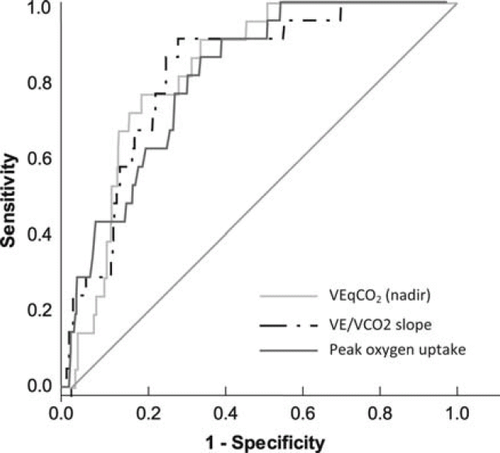
Receiver operator characteristic curve analysis of the value of VEqCO2 (nadir), VE/VCO2 slope, and peak VO2 for predicting all-cause mortality at 12 months is shown in Figure 2. VEqCO2 (nadir) (AUC = 0.81; P< 0.0001; 95% CI = 0.74–0.89; sensitivity = 86; specificity = 62; optimal cut-point = 33); VE/VCO2 slope (AUC = 0.78; P< 0.0001; 95% CI = 0.69–0.86; sensitivity = 91; specificity = 63; optimal cut-point = 34); and peak VO2 (AUC = 0.76; P< 0.0001; 95% CI = 0.67–0.85; sensitivity = 86; specificity = 57; optimal cut-point = 20 mL kg−1 min−1) were similar in their relation to all-cause mortality at 12 months.
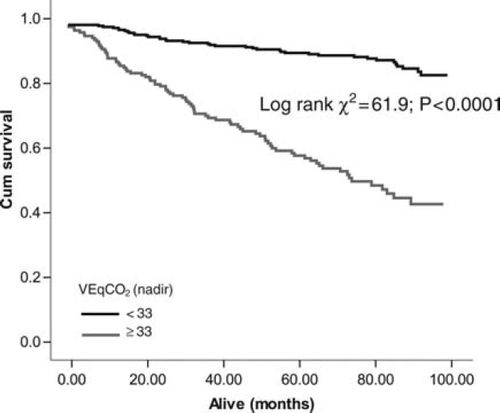
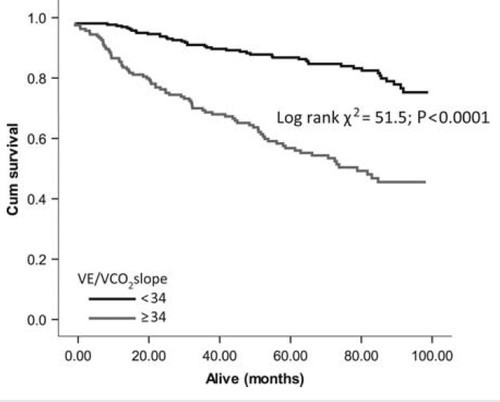
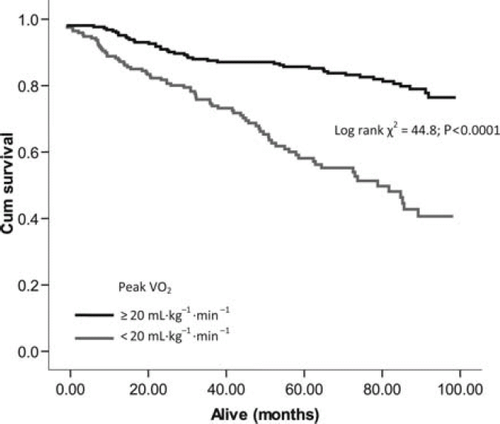
Optimal cut-points determined from ROC analysis were used to construct Kaplan–Meier survival curves for VEqCO2 (nadir), VE/VCO2 slope, and peak VO2. The VEqCO2 (nadir) showed the largest separation between cut points (<33 vs. ≥33; log rank χ2 = 61.9; P< 0.0001; Figure 3), followed by the VE/VCO2 slope (<34 vs. ≥34; log rank χ2 = 51.5; P< 0.0001; Figure 4) and peak VO2 (<20 vs. ≥20 mL kg−1 min−1; log rank χ2 = 44.8; P< 0.0001; Figure 5).
Discussion
We have found that the VEqCO2 (nadir) has greater prognostic power than other measures of the ventilation-carbon dioxide relation including VEqCO2 at rest, VEqCO2 at peak, and the VE/VCO2 slope, and it is also superior to peak oxygen uptake in patients with CHF. To our knowledge, no previous study has evaluated the prognostic value of the ventilatory equivalent for carbon dioxide at different time-points of an incremental exercise test in patients with CHF. One of the benefits of VEqCO2 nadir over, for example, the VE/VCO2 slope, is that the data may be more stable and reproducible when compared with data collected between different laboratories, exercise modalities, and between patients of different sex and age.20 The limitation of the VE/VCO2 slope is that the relation is not linear beyond respiratory compensation, and in the early stages of exercise, the relation may be subject to transient hyperventilation.10
Myers et al.13 recently compared the prognostic value of the VEqCO2 nadir with the VE/VCO2 slope in 847 CHF patients. Following Cox multivariable age-adjusted analysis, the VEqCO2 nadir (HR = 2.0; 95% CI 1.1–3.4, P= 0.02) was similar to the VE/VCO2 slope (HR = 2.2; 95% CI 1.33.7, P= 0.002) in predicting combined risk of all-cause mortality and cardiac transplantation. Our optimum cut-points for the VE/VCO2 nadir (33) and the VE/VCO2 slope (34) were identical to those proposed by Myers et al.,13 although our patients had a much higher cut-point for peak oxygen uptake (20 vs. 14 mL kg−1 min−1). The lower peak oxygen uptake values reported by Myers et al.13 may in part be explained by the inclusion of cycle ergometry as a mode of exercise, alongside treadmill testing in an unreported number of patients.
While other studies have not reported the prognostic significance of the VEqCO2 nadir in CHF, some have described the value of the VEqCO2 at the AT, which Wasserman et al.21 described as being analogous to the VEqCO2 nadir. In a study of 470 consecutive CHF patients, who were not taking beta-blockers, followed for 1.5 years,12 only an abnormally high VEqCO2 at the AT and a low chronotropic index were independently predictive of all-cause mortality after adjustment for peak oxygen uptake, age, sex, history of disease, and resting systolic blood pressure. When peak oxygen uptake was forced into the regression model, only a high VEqCO2 at the AT and a low chronotropic index were predictive of death. Our findings are in support of these conclusions.
Although we found that the prognostic value of VEqCO2 at peak exercise was inferior to the nadir time-point, Mejhert et al.9 found that VEqCO2 at peak exercise was the strongest predictor of mortality, followed by LV end-systolic volume in a study of 67 clinically stable CHF patients >60 years of age. However, as our study is so much larger, we believe it has greater power in determining the relation between exercise variables and outcome. Arena et al.8 found that both the VE/VCO2 slope and VEqCO2 at peak exercise predicted 1-year cardiac-related mortality and hospitalization in 235 CHF patients, and while not identical, both variables provide similar prognostic information.
In conclusion, the VEqCO2 (nadir) provides greater prognostic value than other related ventilatory variables in patients with suspected HF. Further work in other populations is required to confirm our conclusions.
Conflicts of interest: There are no conflicts of interest to report.


