

Differential Export Taxes along the Oilseeds Value Chain: A Partial Equilibrium Analysis
The authors are listed in alphabetical order. No senior authorship is assigned. We would like to thank the two anonymous referees and the editor, David Hennessy, for their very helpful comments and suggestions on previous drafts. We would also like to thank Patrice Cassagnard, Alexandre Gohin, Sara Gustafson, Chantal Le Mouël, and Alexander Saak for their feedback on earlier drafts.
Abstract
Differential Export Tax (DET) rates, or the policy of imposing high export taxes on raw commodities and low export taxes on processed goods, generate public revenues and promote production at the more processed stages of a value chain. We study the theoretical justification of this trade policy by designing a simple international trade model which shows that a tax on exports of a raw agricultural commodity in a country that exports seeds and vegetable oils increases the sum of final consumers' surplus, processing sector profits, farmers' surplus, and public revenues. We then develop a partial equilibrium model of the world's oilseed value chain and simulate the total elimination of DETs in Argentina and Indonesia, as well as the independent removal of export taxes at various stages of production in the same countries. Estimations show that removing export taxes along the entire value chain in Argentina and Indonesia reduces the local production of biofuels by only 0.4% in Argentina, while eliminating only the export tax on biofuels in Argentina leads to a 9.6% volume increase in Argentinean biofuels production.
Export taxes are a commonly enacted policy worldwide. In 2010, the Organization for Economic Cooperation and Development (OECD) concluded that from 2003 to 2009, 65 out of 128 World Trade Organization (WTO) members implemented some type of export restriction, particularly on raw commodities (OECD 2010). Since export taxes' main effect is to decrease the domestic price of a good, they are often applied as a food security policy (Bouët and Laborde 2012). Other justifications for using export taxes include terms-of-trade improvement, public revenue increases, and a response to tariff escalation in developed countries (Piermartini 2004; Kim 2010).
Tariff escalation, defined as a situation in which import duties increase as a product becomes more processed, results in higher “effective protection” for the final production stage of a value chain (Corden 1971). When applied in developed countries, this policy tends to favor processing industries within those countries, and tends to increase developing countries' specialization in unprocessed primary commodities (Piermartini 2004). In response to tariff escalation, some developing countries apply decreasing export tax rates along their production value chains in order to promote more processed production within their own countries. This tax system is sometimes referred to as Differential Export Taxes (DET), which are commonly applied along the oilseeds value chain, which is characterized by several important stages of transformation, from seeds to oils and meals produced from crushed seeds, and finally to biodiesel produced from oils.1 Examples of countries applying DETs in the oilseeds sector include Argentina (soybeans) and Indonesia (palm oil).2 Examples of entities that use tariff escalation in the same sector include the European Union (EU) and the United States.
To the best of our knowledge, DETs have not yet been systematically studied. Rather, the economic literature, briefly summarized below, has paid more attention to the economic impact of export taxes in general. By restricting its exports of a particular commodity, a country that supplies a significant share of the world market can increase the world price of that commodity; this argument is very similar to the optimum tariff argument (also called the large-country argument) put forth by Bickerdike (1906), Enke (1944), and Johnson (1953). Export taxes on primary commodities work as an indirect subsidy for processing industries, as noted by Corden (1971). Just, Schmitz, and Zilberman (1979) show that in an international trade model with an international trading firm that exercises monopoly/monopsony power, the government in the exporting country may apply an export tax to maximize welfare. Eaton and Grossman (1986), Rodrik (1989), Bernhofen (1997), and Deardorff and Rajaraman (2005) focus on the profit-shifting argument, while Piermartini (2004), as well as Mitra and Josling (2009) and Kim (2010), provide a review of the theoretical and empirical literature on export taxes. Bouët and Laborde (2012) assess the rationales behind export taxes in the context of a food crisis. Finally, Bouët, Estrades, and Laborde (2013) evaluate the impact of export taxes on global welfare for all sectors and find that removing export taxes increases global welfare by 0.23%, a larger figure than the expected gains from the Doha Round.3
The objective of this article is to provide insight into the specific implications of a DET. To accomplish this, we analyze whether the rationales behind DETs stem from a country's desire to support its domestic processing industry, particularly in response to tariff escalation implemented by its trading partners. Thus, we first develop a stylized theoretical model to determine the detailed impact of tariff escalation and DETs. This model shows that when an export tax is imposed on a raw agricultural commodity by a developing country that exports both the commodity and a processed good made from that commodity, the tax augments a national surplus function. Second, we design a calibrated partial equilibrium model of the oilseeds value chain. This model incorporates 10 countries/regions, three production stages, and four types of seeds. We simulate the elimination of DETs along the production chain in two countries (Argentina and Indonesia), as well as the elimination of import tariffs applied by developed countries (EU and United States) on the same goods. We further study the impact of the independent removal of export taxes along various stages of the value chain. While there have been some similar assessments done at the country level (Amiruddin 2003; Costa et al. 2009), as well as some assessments of agreements to eliminate export subsidies, import tariffs, and export taxes in the oilseeds chain (Meilke, Wensley, and Cluff 2001), this is the first global assessment of the effects of DETs along this particular value chain. To the best of our knowledge, this is also the first time that the validity of DETs as a policy response to tariff escalations has been examined.
The remainder of the article is structured as follows. In the next section, we introduce our stylized theoretical model that provides general conclusions about DETs and tariff escalation. In the subsequent section, we first present our partial equilibrium model calibrated to the oilseeds sector before analyzing the results of various policy shocks. The final section provides concluding remarks.
1 A Stylized Theoretical Model of DETs and Tariff Escalation
In this section, we develop a simple theoretical partial model with two sectors (a raw agricultural commodity and a manufactured good using that raw agricultural commodity as an input) and two countries (a developed country implementing a tariff escalation on imports and a developing country implementing a DET).
1.1 Assumptions
We suppose an international (Cournot) duopoly that offers a homogenous manufactured good (e.g., vegetable oils) through two firms. One firm in country 1 (developed country) produces and offers this processed good on its domestic market in quantity x, and one firm in country 2 (developing country) both produces and offers this processed good on its domestic market in quantity z and exports quantity y to country 1's market. The total supply of vegetable oils in country 1's market is X=x+y, and the inverse demand function is p=p(X), with p being the demand price (p′<0). The supply of vegetable oil in country 2's market is z, and the inverse demand function is q=q(z), with q being the demand price q′<0. Imports, y, of vegetable oils by country 1 may be taxed with a specific tariff, t1. There is no international transportation cost.4
The production of vegetable oils requires the intermediate consumption of a raw agricultural commodity (e.g., soy); for simplicity's sake, we presume this to be the unique cost of production in the vegetable oil industry. This is a Leontief technology, and units of the agricultural commodity are chosen such that one unit of vegetable oil requires one unit of soy. There is no fixed cost and there is no tax on imports of soy in country 1. The vegetable oil industry provides the unique demand for soy; therefore, world demand for soy is x+y+z.5
Concerning the raw agricultural commodity, the supply comes from both countries in quantities si for country i, ∀i=1,2, and competition is perfect in this sector in both countries. Demand and supply capacities, as well as comparative advantages, are such that country 2 exports soy to country 1. Country 2 may tax exports of soy with a specific tax, t2. There is no tax on exports of vegetable oil in country 2. Let us call w the world price of soy. In the absence of an import tax and other transaction costs in country 1, w is also country 1's domestic price. Implementing an export tax on soy in country 2 implies that country 2's domestic price of soy is w−t2. Supplies of soy are expressed as s1=w and s2=α(w−t2). Since α>1, country 2's supply is larger than country 1's supply when no export tax is levied.
 (1)
(1) (2)
(2) (3)
(3) (4)
(4) (5)
(5) (6)
(6)1.2 Profit Maximization in the Processed Sector
 (7)
(7) (8)
(8) (9)
(9) ,
,  ,
,  ), and marginal profit decreases with the other firm's supply (
 and
and  ). Own effects are greater than cross-effects:
 (10)
(10) (11)
(11) (12)
(12)1.3 Comparative Statics
 (13)
(13) (14)
(14) (15)
(15) (16)
(16) (17)
(17) (18)
(18)1.4 The Design of Optimal Trade Policies
 (19)
(19) (20)
(20) ,
,  ,
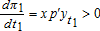
,  . Thus, tariff escalation in country 1 raises the profit of the local vegetable oil firm, decreases local farmers' surplus (through a decrease of the world price of soy), and decreases local consumers' surplus. We also obtain
 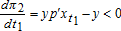 . Thus, tariff escalation in country 1 decreases the profit of country 2's vegetable oil firm.
We also see that 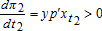 ,
,  ,
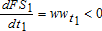
,  . Thus, the DET in country 2 raises the profit of the domestic vegetable oil firm, decreases farmers' surplus, and increases local consumers' surplus. Public revenues are concave downward in t1 and t2.
From this first theoretical model, we conclude that for a developing country exporting both a raw agricultural commodity and a processed good made from this raw commodity, implementing an export tax on the raw commodity is a rational policy under this set of assumptions. It should be noted that the model assumes that the developing country faces a downward-sloping export demand. If this is not the case, an export tax may decrease that country's welfare, as the tax revenue then represents a transfer from domestic producers to the government.
2 A Partial Equilibrium Model of the Oilseeds Sector
The model presented in the previous section provides a theoretical justification for implementing DETs. However, this model is highly stylized and does not account for several of the complexities of the oilseeds value chain. The oilseeds value chain contains more stages than simply raw and processed, and substitutability between different types of seeds exists at some stages. Moreover, we need to consider the value of different economic variables (production, trade, taxes, etc.) at the world level.
In this section we present a partial equilibrium model that accounts for some of these complexities and uses real data to analyze the implications of both DETs in developing countries and tariff escalations in developed countries. We first present the main characteristics of the oilseeds sector.
2.1 Main Features of the Oilseed Sector
We consider three stages of production in the oilseeds value chain: seed production (first stage), meal and oil production (second stage), and biodiesel production (third stage).7 Meals and oils are produced from crushed seeds, while biodiesel is produced from oils. In our model, we consider four types of seeds: soybeans, sunflower seeds, palm nuts, and rapeseeds.8 Soybean meals and soybean oils are produced from crushed soybeans (there is no substitution among seeds in the second stage). In the third stage, biodiesel is produced from composite oil. The biodiesel industry competes with final consumers in the demand for oils, while final consumers imperfectly substitute the different types of oils.
According to the Food and Agriculture Organization (FAO), the most important countries in the oilseeds value chain (acting as either producers or consumers of oilseeds and derived products) are Argentina, Brazil, Canada, China, the EU, India, Indonesia, Malaysia, Ukraine, and the United States. Therefore, these are the countries included in our model.
2.2 The Multimarket Partial Equilibrium Model
In this subsection we present the full equations of our partial equilibrium model. Greek letters denote elasticities and K scale parameters. We adopt standard notations for elasticities, with ɛ for supply elasticities, η for demand elasticities, and σ for substitution elasticities. Subscripts in variables and parameters are as follows: s represents seeds, o represents oils, m represents meals, and b represents biodiesel; r is the set of countries, i stands for the set of seeds (soybeans, sunflower seeds, palm nuts, and rapeseeds), and f stands for a set of agents (f=h, Bio for households and the biodiesel sector, respectively). We successively present the supply-side equations, the demand-side equations, the price linkages equations, and the market-clearing conditions.
2.3 Supply Side
 (21)
(21) (22)
(22) (23)
(23) (24)
(24) (25)
(25) (26)
(26) (27)
(27)2.4 Demand Side
 (28)
(28) (29)
(29) (30)
(30) (31)
(31) (32)
(32) (33)
(33) (34)
(34)In the international market, we assume that goods are homogenous. This assumption means that there are net-exporting and net-importing countries for each good. Exporters' decisions to allocate production domestically or to trade are based on price. Countries can apply export taxes and import duties (ad valorem in either case) on each of the four products.
2.5 Price Linkages
 (35)
(35) (36)
(36) (37)
(37) (38)
(38) (39)
(39) (40)
(40) (41)
(41) (42)
(42)2.6 Market-clearing Conditions
 (43)
(43) (44)
(44) (45)
(45) (46)
(46)We do not model storage: while storage is an important feature of agricultural markets in a stochastic model (see Gouel 2013), our model is not stochastic. The design of a stochastic multi-market, multi-country partial equilibrium model would represent a very complex task that would require us to simplify assumptions to the detriment of realism. Finally, according to USDA data (2010–2013), at the world level stocks are only important (greater than 20% of total consumption) in the soybeans sector.10
2.7 Calibration
To calibrate the model, we use data on production, consumption, and trade taken from the 2007 FAO-Food Balance Sheet, while elasticity values are taken from Food and Agricultural Policy Research Institute11 (please see appendix 1 in the online supplementary material); when elasticities were missing, values from comparable countries were extrapolated. For this reason, we conduct an extensive sensitivity analysis in the last subsection of this section. Regarding the price-elasticity of demand for biodiesel, we suppose ηbi,r=−0.25,∀r. We think that −0.25 is a good approximation for the long-run value of this elasticity, particularly when there is price competition between fossil fuels and biofuels (as is the case in Brazil, for instance). This is the elasticity used in the MIRAGE biofuel model (see Laborde and Valin 2011). Data on export taxes come from various sources (Trade Policy Reports, WTO; OECD), while data on import duties come from Laborde (2013).12 Tables 1 and 2 present the export taxes and import tariffs applied to oilseeds at the benchmark.
| Seeds | Oils | Meals | Biodiesel | ||
|---|---|---|---|---|---|
| Soy | Argentina | 35 | 32 | 32 | 20 |
| Palm | Indonesia | 40 | 25 | – | 3 |
| Palm | Malaysia | – | 30 | – | – |
| Sunflower | Argentina | 32 | 30 | 30 | – |
| Sunflower | Ukraine | 12 | – | – | – |
- a Source: Authors' computations based on various sources.
| Seeds | Oils | Meals | ||
|---|---|---|---|---|
| Palm | EU | 0.00 | 6.68 | 0.00 |
| Palm | U.S. | 0.00 | 0.00 | 0.00 |
| Soy | EU | 0.00 | 5.17 | 0.13 |
| Soy | U.S. | 0.00 | 17.13 | 1.75 |
| Sunflower | EU | 0.00 | 6.07 | 0.00 |
| Sunflower | U.S. | 0.00 | 5.54 | 0.00 |
- a Source: Authors' computations based on Laborde (2013).Note: There are also import duties applied at various stages of the oilseeds value chain in Argentina, Brazil, China, India, Malaysia, Ukraine, and Canada. These import duties are accounted for in our model but they are not removed in the scenarios presented in this study.
Export taxes are widely used throughout the global oilseeds sector. The exceptions to this statement are the United States, where export taxes are prohibited by law, and the EU, which actively pushes for the prohibition of export taxes in the WTO.13 In 2010, Argentina imposed a 35% export tax on soybeans, a slightly lower export tax (32%) on soybean by-products (soy oil and soy meals), and a much lower export tax (20%) on soy-based biodiesel. The range of import duties applied in the oilseeds sector is wider than the range of export taxes. Here we look at two large entities that apply tariff escalations in this sector: the EU and the United States. Both countries apply import tariffs on vegetable oil but do not apply tariffs on oilseeds.14
2.8 Simulation Results
We evaluate seven scenarios, the first three of which are global. In scenario 1, we remove export taxes in countries implementing a DET (Argentina and Indonesia). In scenario 2, we remove import duties in countries implementing tariff escalation (the EU and the United States). In scenario 3, we combine scenarios 1 and 2. The remaining four scenarios are specific to Argentina and involve the removal of export taxes on seeds only (scenario 4a), the removal of export taxes on oils and meals only (scenario 4b), the removal of export taxes on biofuels only (scenario 4c), and the implementation of a uniform export tax at each stage of production along the soy/palm value chains (scenario 4d). In this final scenario, we select the uniform level of export tax that implies the same level of public revenues as the one in the baseline (with DETs).15
For simplicity we will focus here on Argentina and the United States; the results for Indonesia and the EU are available in appendix 3 presented in the online supplementary material. We also focus our comments on the seeds/oils/biofuels value chain; the analysis of the seeds/meals value chain provides similar results.
We first consider the simultaneous elimination of all export taxes in Argentina and Indonesia (scenario 1). As price parity equations (35 to 38) illustrate, removing export taxes raises domestic prices in the country implementing the tax and reduces the international price of the good. As table 3 shows, this is indeed what happens when all export taxes applied on the oilseeds complex by Argentina and Indonesia are removed. International seed prices for palm nuts and soybeans fall the most because they face initially higher export taxes.
| Oils | Meals | Seeds | |||||||||||
|---|---|---|---|---|---|---|---|---|---|---|---|---|---|
| Scenario | Biod | Soy | Sunf | Rapes | Palm | Soy | Sunf | Rapes | Palm | Soy | Sunf | Rapes | Palm |
| 1. Removal of DETs in ARG & IDN | −0.7 | −1.9 | −1.6 | −1.3 | −3 | −3.1 | −1.8 | 0.6 | −4.1 | −3 | −1.3 | −0.7 | −7.6 |
| 2. Removal of tariff esc. in EU & US | 1.6 | 3.8 | 2.5 | 2 | 1.8 | 0.4 | −0.4 | −0.4 | −0.7 | 0.2 | 0.5 | 0.6 | 0.9 |
| 3. Scenarios 1 & 2 | 1 | 1.8 | 0.8 | 0.6 | −1.3 | −2.7 | −2.2 | 0.2 | −4.7 | −3 | −0.8 | −0.1 | −6.9 |
| 4a. Export taxes on seeds removed- ARG | 0.4 | 1.1 | 1.4 | 0.8 | 0.8 | 1 | 3.1 | −0.4 | −0.3 | −7 | −5.6 | 0.4 | 0.4 |
| 4b. Export taxes on oils&meals removed-ARG | 0.9 | −1.4 | −1.5 | −0.9 | −0.8 | −1.7 | −3 | 0.4 | 0.3 | 0.9 | 2.1 | −0.5 | −0.4 |
| 4c. Export taxes on biodiesel removed-ARG | −0.8 | 0.1 | 0 | 0 | 0 | 0 | 0 | 0 | 0 | 0 | 0 | 0 | 0 |
| 4d. Uniform tax - public revenues constant | 0.5 | −0.1 | 0 | 0 | 0 | 0 | 0 | 0 | 0 | −0 | 0 | 0 | 0 |
- a Source: Authors' calculations. Note: ARG = Argentina; esc. = escalation; IDN = Indonesia; Biod = Biodiesel; Sunf = Sunflower; Rapes = Rapeseeds.
There is no export tax imposed on rapeseed at the benchmark. The international prices of rapeseed products vary as consumption of rapeseed products is substituted worldwide for consumption of other types of products.
Table 4 illustrates the variation in domestic prices, while table 5 highlights changes in production volume. Under scenario 1, as expected, there is an increase in the domestic prices of soybeans and sunflower seeds and their downstream products (including biodiesel) in Argentina. The magnitude of the variation in domestic prices is directly related to the value of the export tax that was initially in place.
| Oils | Seeds | |||||||||||||||||
|---|---|---|---|---|---|---|---|---|---|---|---|---|---|---|---|---|---|---|
| Biod | Soy | Sunf | Rapes | Palm | Soy | Sunf | Rapes | Palm | ||||||||||
| Scenario | ARG | US | ARG | US | ARG | US | ARG | US | ARG | US | ARG | US | ARG | US | ARG | US | ARG | US |
| 1. Removal of DETs in ARG & IDN | 19.2 | −0.7 | 29.5 | −1.9 | 27.9 | −1.6 | −1.3 | −1.3 | −3.0 | −3.0 | 30.4 | −3.4 | 30.3 | −1.3 | −0.7 | −0.7 | −7.6 | −7.6 |
| 2. Removal of tariff esc. in EU & US | 1.6 | −1.4 | 3.8 | −11.4 | 2.5 | −2.9 | 2.0 | −3.8 | 1.8 | 1.8 | 0.2 | 0.2 | 0.5 | 0.5 | 0.6 | −1.1 | 0.9 | 0.9 |
| 3. Scenarios 1 & 2 | 21.3 | −2.0 | 34.4 | −13.1 | 31.1 | −4.5 | 0.6 | −5.1 | −1.3 | −1.3 | 30.6 | −3.3 | 30.9 | −0.8 | −0.1 | −1.8 | −6.9 | −6.9 |
| 4a. Export taxes on seeds removed- ARG | 0.4 | 0.4 | 1.1 | 1.1 | 1.4 | 1.4 | 0.8 | 0.8 | 0.8 | 0.8 | 26.0 | −6.7 | 24.7 | −5.6 | 0.4 | 0.4 | 0.4 | 0.4 |
| 4b. Export taxes on oils & meals removed-ARG | 0.9 | 0.9 | 30.1 | −1.4 | 28.1 | −1.5 | −0.9 | −0.9 | −0.8 | −0.8 | 0.9 | 0.9 | 2.1 | 2.1 | −0.5 | −0.5 | −0.4 | −0.4 |
| 4c. Export taxes on biodiesel removed-ARG | 19.1 | −0.8 | 0.1 | 0.1 | 0.0 | 0.0 | 0.0 | 0.0 | 0.0 | 0.0 | 0.0 | 0.0 | 0.0 | 0.0 | 0.0 | 0.0 | 0.0 | 0.0 |
| 4d. Uniform tax - public revenues constant | −8.6 | 0.5 | 0.0 | −0.1 | 0.0 | 0.0 | 0.0 | 0.0 | 0.0 | 0.0 | 1.9 | −0.4 | 0.0 | 0.0 | 0.0 | 0.0 | 0.0 | 0.0 |
- a Source: Authors' calculations. Notes: ARG = Argentina; esc. = escalation; IDN = Indonesia; Biod = Biodiesel; Sunf = Sunflower; Rapes = Rapeseed.
| Oils | Seeds | |||||||||||||
|---|---|---|---|---|---|---|---|---|---|---|---|---|---|---|
| Biod | Soy | Sunf | Rapes | Soy | Sunf | Rapes | ||||||||
| Scenario | ARG | US | ARG | US | ARG | US | ARG | US | ARG | US | ARG | US | ARG | US |
| 1. Removal of DETs in ARG & IDN | −0.4 | 0.9 | 4.1 | 0.0 | 4.4 | −0.1 | −0.1 | −0.1 | 8.9 | −1.0 | 4.0 | −0.4 | −0.1 | −0.2 |
| 2. Removal of tariff esc. in EU & US | −0.6 | 6.3 | 1.4 | −5.1 | 1.9 | −0.6 | 0.9 | −0.4 | 0.1 | 0.1 | 0.1 | 0.1 | 0.1 | −0.3 |
| 3. Scenarios 1 & 2 | −1.2 | 7.0 | 5.7 | −5.0 | 6.5 | −0.8 | 0.7 | −0.4 | 8.9 | −1.0 | 4.1 | −0.2 | 0.0 | −0.5 |
| 4a. Export taxes on seeds removed- ARG | −0.2 | −0.5 | −27.7 | 4.2 | −35.8 | 1.1 | 0.1 | 0.0 | 7.7 | −2.1 | 3.4 | −1.7 | 0.1 | 0.1 |
| 4b. Export taxes on oils & meals removed-ARG | −16.4 | 2.0 | 17.6 | −1.8 | 22.1 | −0.7 | −0.1 | 0.0 | 0.3 | 0.3 | 0.3 | 0.6 | −0.1 | −0.2 |
| 4c. Export taxes on biodiesel removed-ARG | 9.6 | −0.9 | 0.0 | 0.0 | 0.0 | 0.0 | 0.0 | 0.0 | 0.0 | 0.0 | 0.0 | 0.0 | 0.0 | 0.0 |
| 4d. Uniform tax - public revenues constant | −5.9 | 0.5 | −1.3 | 0.2 | 0.0 | 0.0 | 0.0 | 0.0 | 0.6 | −0.1 | 0.0 | 0.0 | 0.0 | 0.0 |
- a Source: Authors' calculations. Note: ARG = Argentina; esc. = escalation; Biod = Biodiesel; Sunf = Sunflower; Rapes = Rapeseeds.
In the case of soybeans and sunflower value chains in Argentina, export taxes are applied throughout the various production stages. Eliminating all of these export taxes augments the cultivation of soybeans (+8.9%; see table 4, scenario 1 for Argentina) and sunflower seeds (+4.0%). As export taxes are also levied on oils and meals, the domestic prices of these processed goods increase, raising the crush margin and promoting higher production (a direct DET effect). On the other hand, eliminating export taxes on soybeans promotes exports of the raw commodity and reduces local production of downstream products (oils and meals) since production costs rise and the effect on the crush margin is negative (an indirect DET effect). The first effect (direct DET effect) is higher in Argentina (soy oils: +4.1%). If we simulate the elimination of export taxes on just meals and oils, their production and exports would increase; the opposite would happen if we eliminate export taxes on just soybeans. In this second case, production and exports of downstream products would fall y.
When a DET is removed from the entire value chain of a particular oilseed, there are at least two effects on the cultivation of other seeds: a supply-side effect and a demand-side effect. The supply-side effect implies a reallocation of productive resources depending on how domestic prices change. The demand-side effect is linked to changes in activity at downstream stages of production. The magnitude of these different effects depends on the initial level of export taxes at the various stages of production, the degree of substitutability between different crops, and the intensity of the downstream-upstream linkage.
Here we consider a scenario in which only export taxes on seeds are removed (scenario 4a). This scenario has a large and positive effect on the seed's domestic price (see table 4 for the case of Argentina in scenario 4a: the domestic price of soybeans increases by 26.0%). This increases the cost of production all along the value chain; the domestic price of soy oils and biofuels increase by 1.1% and 0.4%, respectively.
If we only remove export taxes at the intermediate stage of production (e.g., oils), the direct effect is an increase in the domestic price of soy oils (+30.1%; scenario 4b, Argentina in table 4). Such a policy also has both upward and downward effects on prices along the value chain. The upward effect is an augmentation of the production of soy oils, which implies an augmented demand for soybeans and an increase in their domestic price (+0.9%). The downward effect occurs through an augmentation of the production cost for the biofuels industry (+0.9%). However, both effects are small compared to the direct effect.
Based on table 5, we can conclude that the DET in Argentina has a slightly positive impact on local biodiesel production, but removing the DET decreases biodiesel production by only 0.4% nationwide in Argentina.16
If we simulate the removal of the export tax only on biodiesel in Argentina (scenario 4c), we find a 9.6% increase in local biodiesel production. On the other hand, if export taxes are removed only on soy oils in Argentina (scenario 4b), biofuel production is significantly reduced (−16.4%). A similar result is seen in the impact that removing the export tax on soybeans has on soy oil and meal production. Thus, while it is a valid claim to say that DETs in agricultural commodity-exporting developing countries are implemented to support those countries' processing industries, a positive export tax on products in the final stage of processing is not a valid policy to promote production at this last stage.
Export taxes on biofuels can, however, be justified by other outcomes, such as increases in public revenues. A uniform export tax imposed all along the value chain (scenario 4d; the uniform tax is 31.9%) can generate the same level of public revenue as in the baseline, but the impact on biofuel production is negative in Argentina (−5.9%).
Regarding tariff escalation, scenario 2 (the removal of import duties in the EU and the United States) results in an unexpected negative impact on biodiesel production in Argentina (−0.6%). However, this scenario has a positive impact on oil and meal production in both countries, regardless of which type of seed is used. Looking at the initial import duties reveals that tariff escalation exists only for oils and meals in the United States, while in the EU tariff escalation is applied along the entire value chain, including biodiesel production. These import tariff structures negatively affect the production of oils and meals in Argentina; however, the situation for biodiesel is more complicated since scenario 2 implies a significant increase in European imports of biodiesel and an increase in the U.S. exports of the same product. Under this scenario, U.S. imports of oils, particularly soy oils, increase significantly, not only because the U.S. tariff on soy oils is removed but because input demand from the U.S. biodiesel industry increases.
On the one hand, we conclude that tariff escalation in the EU hurts oil and biodiesel production in Argentina (if we run a scenario in which only EU import duties are cancelled, oils and biodiesel production increases in Argentina.) On the other hand, the U.S. tariff structure negatively affects the production of oils in Argentina but positively contributes to biodiesel production in that country.
Table 6 presents surplus variations for farmers, the crushing industry, the biofuels industry, livestock producers, and final consumers in Argentina (the same table for the United States is presented in appendix 3 in the online supplementary material).17 As expected, eliminating DETs in Argentina and Indonesia (scenario 1) benefits Argentina's producers in the first stages of production (seeds and crushing), while public revenues, households, and producers are hurt in the last stage of production (biofuels). Removing import duties in the EU and the United States (scenario 2) benefits Argentinean farmers and the crushing industry by increasing exports, but this reorientation of seeds, oils, and meals to the export market is detrimental to Argentina's local biofuel industry, livestock producers, and local consumers. Removing export taxes at only one stage of production (scenarios 4a, 4b, and 4c) positively affects that specific stage, as well as upstream stages, thanks to an expansion of input demand. Conversely, these scenarios hurt downstream producers through an increase in the cost of inputs. For example, removing the export tax on oils and meals (scenario 4b in table 6) increases the surplus of both the crushing industry and the farmers but hurts the biofuels industry, the livestock sector, and the final consumers.
| Seeds | Crush | Biofuels | Livestock | Households | Households | Tariff | ||
|---|---|---|---|---|---|---|---|---|
| Scenario | farmers | industry | producers | producers | oils | biofuels | revenues | TOTAL |
| 1. Removal of DETs in ARG & IDN | 3106.9 | 567.1 | −2.6 | −150.4 | −80.4 | −3.8 | −3680.0 | −243.2 |
| 2. Removal of tariff esc. in EU & US | 19.7 | 184.8 | −3.7 | −1.8 | −7.9 | −0.3 | 75.2 | 266.0 |
| 3. Scenarios 1 & 2 | 3132.0 | 815.8 | −7.4 | −152.5 | −89.7 | −4.2 | −3679.3 | 14.7 |
| 4a. Export taxes on seeds removed- ARG | 2628.4 | −1787.9 | −1.3 | −7.2 | −4.4 | −0.1 | −1485.2 | −657.8 |
| 4b. Export taxes on oils & meals removed-ARG | 101.5 | 3420.1 | −71.5 | −157.4 | −81.3 | −0.2 | −3522.5 | −311.3 |
| 4c. Export taxes on biodiesel removed-ARG | 2.2 | 0.9 | 79.4 | 0.1 | −0.1 | −3.8 | −82.5 | −3.7 |
| 4d. Uniform tax - public revenues constant | 170.4 | −142.0 | −33.2 | 0.0 | 0.1 | 1.8 | 0.0 | −3.0 |
- a Source: Authors' calculations.Note: ARG = Argentina; esc. = escalation; IDN = Indonesia.
Adding together all of the surplus variations allows us to estimate the country-wide impact of various scenarios (the last column of table 6). Removing the DET in Argentina has an overall negative impact for the country; the benefits for farmers and the crushing sector are smaller than the losses of public revenues and the losses for consumers, the livestock sector, and the biofuels industry. In the case of scenario 1, most of the losses are in public revenues, while the main beneficiaries are farmers.18 Removing import duties in the EU and the United States is positive overall for Argentina, as is the combination of both scenarios (removing the DET and import duties). While the overall benefits to Argentina stemming from scenario 3 are small (only 14.7 million USD) there is a substantial gain for farmers (3.1 billion USD) and a significant loss in public revenues (3.7 billion USD).
Considering scenario 4a, the benefits for farmers are less than those emerging from scenario 1, meaning that Argentinean farmers gain more from the removal of export taxes on seeds, oils, meals, and biofuels than from the removal of export taxes on seeds alone. For the crushing industry, the best scenario is a removal of export taxes only at the crushing stage of production (scenario 4b).
As far as the United States is concerned (please see Appendix 3 in the online supplementary material), removing DETs in Argentina and Indonesia (scenario 1) implies a substantial increase in both countries' exports of soybeans, sunflower seeds, palm nuts, oils, and meals. This scenario hurts U.S. farmers and the U.S. crushing sector; however, as it decreases the U.S. domestic price of oils and meals, it benefits the U.S. biofuel industry, livestock sectors, and final consumers.
Considering the removal of Argentinean export taxation at only one stage of the value chain (e.g., stage x), we conclude that U.S. producers at the same stage are hurt (due to more competition from abroad), while downstream activities benefit through reduced input costs. Upstream activities are hurt by decreased production at stage x, but benefit from fewer exports from Argentina as Argentinean producers sell more domestically. For example, when Argentina removes its export taxes on oils and meals (scenario 4b), it hurts the U.S. crushing industry, which in turn demands fewer seeds from U.S. farmers. However, since Argentinean farmers sell more to the domestic crushing industry under this scenario, U.S. farmers also export more. This latter effect outweighs the former.
If we add the surpluses of all U.S. agents, we conclude that the removal of DETs in Argentina and Indonesia is negative for the United States, particularly since it implies substantial losses for U.S. farmers. The United States is also hurt by the removal of its own import duties, as well as those of the EU. This appears to be an optimum tariff argument, but it needs to be verified using a scenario that only includes the elimination of import duties in the United States. Such a scenario (not presented here) leads to a U.S. loss of 99.4 million USD, which confirms the optimum tariff argument. This loss is larger than the overall U.S. benefit derived from scenario 2, meaning that the United States is hurt by the imposition of import duties in the EU.
2.9 Sensitivity Analysis
We conduct a sensitivity analysis regarding the following seven elasticities used in the model: ηmgi,r, ɛi,r, ηmgbi,r, ηlr, ηmi,r, σoi,r, and ηbi,r. For each elasticity, we proceed to all calculations presented in this section under two options: an elasticity multiplied by 2 and divided by 2 (results in appendix 5 presented in the online supplementary material).
Most results do not change significantly, particularly those concerning international and domestic prices. A few results concerning production volume are substantially modified, including, for example: the production of sunflower oils when ηmgi,r, the crush margin elasticity, is changed under scenarios 4a and 4b; the production of biodiesel and oils when ηmgbi,r, the price elasticity of intermediate consumption of oils by the biodiesel sector, is changed; the production of soy seeds in Argentina when ɛi,r, the price elasticity of the seed supply, is changed. We also note an inversion of sign of the total surplus gained by Argentina under scenario 3 when ηlr, the price elasticity of final demand for oils, and ηmi,r, the price elasticity of demand for meals, are changed. This means that the previous conclusion, that the overall impact on Argentina of additional escalations in the EU and the United States, and of DETs in Argentina and Indonesia is negative, is fragile.
Concerning ηbi,r, we also proceed with the same calculations for an elasticity fixed at −0.1 and at −0.01. In the short run, particularly under a mandate (specifically, with separate mandates for biodiesel and ethanol), final demand for biodiesel may be very inelastic. All calculations are also available in appendix 5 (table A13; please see the appendix 5 in the online supplementary material). We also conclude that the results show significant robustness. Concerning ηbi,r, only the production of biofuels is significantly affected by this change in elasticity; under scenario 3, the production of biodiesel in Argentina decreases by 4.2% when ηbi,r=−0.01, while it decreases by only 1.2% under the reference value of ηbi,r.
3 Concluding Remarks
This article has assessed the rationale for Differential Export Tax (DET) rates imposed along production value chains, specifically in the oilseeds sector. These policies are often implemented in response to tariff escalations by importing partners. We first examined the theoretical justification for DETs using a stylized theoretical model. In this framework, for a developing country that exports both a raw agricultural commodity and a processed good made from this raw commodity to a developed country, implementing a tax on exports of the raw agricultural commodity may increase welfare in the exporting country.
Our results from a partial equilibrium model calibrated to the international oilseeds sector show that implementing the current tariff escalation in the EU and the United States has a positive impact on the production of vegetable oils in both entities, but a negative impact on vegetable oil production in Argentina. On the other hand, the current DETs in Argentina and Indonesia have a positive impact on the production of biofuels in Argentina, but a negative impact on Argentinean production of vegetable oils, soybeans, and sunflower seeds. In the end, the large country argument holds for both Argentina and the United States.
Therefore, in countries like Argentina or Indonesia, a DET allows for production augmentation at the final stages of the value chain (biodiesel). However, DETs, as they are currently implemented in Argentina, do not support the production of vegetable oils. Moreover, biodiesel producers in Argentina would significantly benefit if the export tax were removed from this downstream stage of the value chain, while export taxes at the upstream stages of production were kept constant. Therefore, we conclude that a DET, particularly as it is implemented in Argentina, does not maximize the production of processed goods at the final stage of production. However, it is important to note that DETs may serve other objectives, such as the collection of public revenues.
We also conclude that while export taxes are the cause of significant trade distortions, tariff escalation is also a distortive trade policy that significantly impacts the production structure in emerging and developing countries. Consequently, if DETs merit specific attention from international organizations like the WTO, they should be discussed alongside tariff escalations since both policies are closely connected.19

