Metabolic fate of AMP, IMP, GMP and XMP in the cytosol of rat brain: an experimental and theoretical analysis
Abstract
A systematic study of the metabolic fate of AMP, IMP, GMP and XMP (NMP) in the presence of cytosol from rat brain is here presented; the kinetics of both disappearance of NMP, and appearance of their degradation products was followed by HPLC. In the absence of ATP, AMP was preferentially degraded to adenosine with concomitant appearance of inosine and hypoxanthine. In the presence of ATP, AMP was preferentially degraded via IMP. The nucleosides generated in the course of the reactions are further degraded, almost exclusively, via nucleoside phosphorylase using as cofactor the Pi generated in the reaction mixture. In order to quantify the effect of each one of the enzymes involved in the degradation of NMP, two complementary approaches were followed: (i) the Vmax and Km values of the enzymes acting in the intermediate steps of the reactions were determined; (ii) these data were introduced into differential equations describing the concentration of the nucleotides and their degradation products as a function of the time of incubation. Factors affecting kinetic parameters of the equation velocity as a function of ATP concentration were introduced when required. The differential equations were solved with the help of Mathematica 3.0. The theoretical method can be used to simulate situations not feasible to be carried out, such as to measure the influence of nm–µm concentrations of ATP on the metabolism of AMP.
Abbreviations used
-
- NMP
-
- nucleoside monophosphate
5′-Nucleotidases (EC 3.1.3.5) catalyse the hydrolysis of purine or pyrimidine nucleoside 5′-phosphates to the corresponding nucleosides and inorganic phosphate. An ecto 5′-nucleotidase (e-N) (glycosyl-phosphatidylinositol (GPI)-anchored) and three forms appearing in the cytosolic subcellular fraction (e-Ns, c-N-I, c-N-II) have been described in vertebrates (for a review see Zimmermann 1992). Only two of these enzymes have been described in the cytosol of rat brain: e-Ns and c-N-II. e-Ns appears to be derived from the glycosyl phosphatidyl inositol (GP-I) anchored e-N (Orford and Saggerson 1996); it has a preference for AMP (low Km) and is inhibited by ATP and ADP (Ki, µm) and by EDTA (Ipata 1968; Mallol and Bozal 1983; Orford and Saggerson 1996). c-N-II has a preference for IMP and GMP over AMP. The enzyme purified from rat brain (Marques et al. 1998) has molecular and kinetic characteristics similar to the enzyme from other sources: it is activated by dinucleoside polyphosphates (Ka, µm, Pinto et al. 1986; Itoh and Yamada 1990), decavanadate (Ka, nm, Le Hir 1991), ATP and ADP (Ka, mM, Van den Berghe et al. 1977a; Itoh 1981). The enzyme from rat brain is also activated by polyphosphates (Ka, µm, Marques et al. 1998). Depending on the extraction and assay procedures one of the two cytosolic 5′-nucleotidases may pass unnoticed. In our experience, both enzymes can be detected in the cytosolic extracts of rat brain if the proper experimental conditions are set up.
The products of the hydrolysis of purine nucleoside 5′-monophosphates are the corresponding nucleosides. Adenosine generated inside/outside the cell is transported (either direction) by facilitated diffusion through a nucleoside transport system (Geiger and Fyda 1991). Adenosine plays important roles in the general functioning of the nervous system acting at the pre-, post- and non-synaptic levels, generally resulting in an inhibitory effect (Ribeiro 1991; Rudolphi et al. 1992a). Adenosine has a protective role in cerebral ischaemia (Rudolphi et al. 1992b). Three main types of receptors for adenosine (A1, A2 and A3) have been described in cell surfaces (Linden 1991; Rudolphi et al. 1992b; Dalziel and Westfall 1994; Ledent et al. 1997).
The homeostasis of bases, nucleosides and nucleotides (and of other metabolites as well) is essential for the proper functioning of the cell. Changes in the substrate concentration or in the kinetic properties of some enzymes involved in these metabolic pathways may cause very disturbing effects on the nervous system (Palella and Fox 1989; Van den Berghe et al. 1992; Redimbo et al. 1996). Many regulatory factors operate to maintain the appropriate level of the components of the nucleotide pool. Although some of them are known, the general picture of this metabolic pathway is still fragmentary, as a consequence of the lack of both a systematic study of the molecular and kinetic properties of the enzymes involved in a specific tissue or organ and the scarcity of quantitative approaches to metabolic and signalling pathways (Bhalla and Iyengar 1999). Valuable attempts to simulate the purine nucleotide metabolism in an ideal tissue have been previously reported (Franco and Canela 1984; Canela et al. 1987; Curto et al. 1997).
The object of this work stems from our previous studies both on 5′-nucleotidases from rat brain and other tissues (Pinto et al. 1986; Marques et al. 1998) and on general aspects of enzyme kinetics (Ribeiro et al. 1994; Fontes et al. 2000). Here we have followed the metabolic fate of AMP (and other nucleoside monophosphates) in vitro in the presence of cytosol from rat brain in different experimental conditions. The kinetic parameters of the enzymes participating in these metabolic pathways were also calculated and used to feed differential equations describing the concentration of the substrates and intermediate products as a function of the incubation time. Good correlation between the experimental and the theoretical approaches was observed.
Materials and methods
Materials
All common purine nucleotides, nucleosides or bases were purchased from Sigma Chemical Co. (St Louis, MO, USA).
Preparation of the cytosolic fraction from rat brain
Male Sprague–Dawley rats (250 g) were used and killed by decapitation. The brain was rapidly dissected out and suspended (at 3 mL/g) in an ice-cold solution containing 50 mm Tris–HCl, pH 7.4, 10 mm 2-mercaptoethanol and 0.28 m sucrose and disrupted mechanically in a Teflon pestle tissue homogenizer, usually with six passes up and down. Tissue extracts were spun at 12 000 g for 20 min and the supernatant further centrifuged at 100 000 g for 60 min. The final supernatant was dialysed for 4 h against 200 volumes of the homogenization buffer without sucrose; the first dialysis was followed by a second one of 14 h against the same buffer. All procedures were carried out at 4 °C. All assays were performed with freshly prepared supernatants.
Determination of enzyme activities
The reaction mixtures (0.15 mL) contained 50 mm Tris–HCl pH 7.4, 5 mm MgCl2 and the proper nucleoside and/or nucleotide, and inorganic phosphate or ribose-1-phosphate, when required. The reaction, initiated by the addition of brain cytosol (around 0.05 mg protein), was incubated at 37 °C, and analysed by HPLC as follows. Aliquots of 0.03 mL were withdrawn from the reaction mixture at the indicated times, transferred into 0.180 mL hot water and kept at 95 °C for 1.5 min. After chilling, the mixture was filtered and 0.05 mL were injected into a Hypersil ODS (4.6 × 100 mm) column. Elution was performed, at a constant flow rate of 0.5 mL/min, with a 20-min linear gradient (5–30 mm) of sodium phosphate pH 7.5, in 20 mm tetrabutylammonium bromide/20% methanol (buffer A), followed by a 10-min linear gradient (30–100 mm) of sodium phosphate. The nature and the concentration of the products generated in the course of the reaction were established by comparison with chromatograms of appropriate standards.
Energy charge
Energy charge is defined in terms of actual concentrations as ([ATP] + 0.5 [ADP])/([ATP] + [ADP] + [AMP]) (Atkinson 1966).
Procedure and system used for solving differential equations
Calculations were carried out with a Power Macintosh G3 and running the Mathematica 3.0 program.
Results
General outline
This paper deals with two different, although complementary, aspects (experimental and theoretical) of the metabolism of purine nucleotides in brain.
The pathways considered in the metabolism of AMP, IMP, GMP and XMP (Fig. 1a,b) are only those detected in freshly obtained (not frozen) cytosol from total rat brain in the presence of the indicated nucleotides, nucleosides or bases, and in the specified experimental conditions. In the experimental part, the different substrates (nucleotides, nucleosides, bases, Pi and ribose-1-phosphate) were incubated with the cytosol and their metabolic fate followed, by HPLC, at different times of incubation. From these results, and from data previously published by others, maximum velocities (V) and Km values of the enzymes involved in these pathways were collected (Table 1). Based on the pathways specified in Fig. 1, changes in the theoretical concentration of each metabolite, along with the time of incubation, can be described with an appropriate set of differential equations (Fig. 2). These equations were solved with the help of the Mathematica 3.0 program. Details of the equation velocities of the enzymes involved in the metabolic pathways specified in 1, 2 are collected in the Appendix.
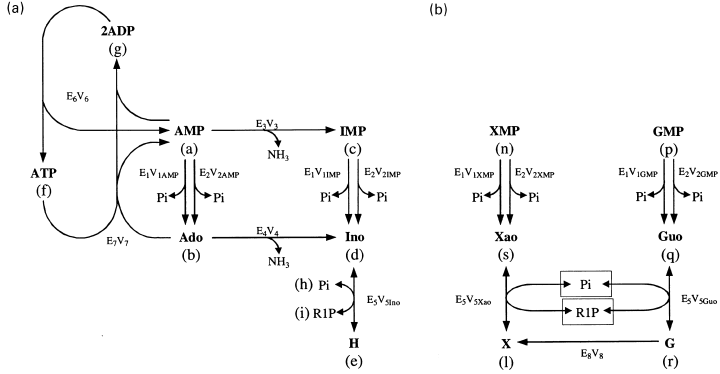
Purine nucleotide metabolism in rat brain cytosol. The metabolic pathways considered for the metabolism of AMP and IMP (a) and for the metabolism of GMP and XMP (b) are represented in the Figure. The enzymes participating in these pathways are E1, solubilized ecto-5′-nucleotidase (e-Ns); E2, IMP-GMP specific 5′-nucleotidase (c-N-II); E3, AMP deaminase; E4, adenosine deaminase; E5, purine nucleoside phosphorylase; E6, adenylate kinase; E7, adenosine kinase; E8, guanine deaminase. Vn, Maximum velocity of the reaction catalysed by En, on the substrate indicated (when pertinent as in the cases of E1, E2, E5).
| Enzyme | Substrate | V (mU/mg) | Km, µm | Ki, µm (I)a |
|---|---|---|---|---|
| E1 5′-Nucleotidase (e-Ns) | AMP | 24 | 24d | 24 (Ado) |
| IMP | 16 | 110d | 110 (Ino) | |
| GMP | 13 | 220d | 220( Guo) | |
| XMP | 12 | 300 | 300 (Xao) | |
| 0.013 (ADP)e | ||||
| 0.032 (ATP)e | ||||
| 200 (Pi) | ||||
| E2 5′-Nucleotidase IMP-GMP specific (c-N-II) | AMP | 4.8f | 15 000f | 15 000 (Ado) |
| 4.8b | 7000b | 7000 (Ado) | ||
| IMP | 1.6 | 600 | 600 (Ino) | |
| 8b | 300b | 300 (Ino) | ||
| GMP | 8 | 4600 | 4600 (Guo) | |
| 8b | 700b | 700 (Guo) | ||
| XMP | 8 | 11 000 | 11 000 (Xao) | |
| 8b | 4700b | 4700 (Xao) | ||
| 200 (Pi)f | ||||
| E3 AMPdeaminase | AMP | 100b | 7800g 500b | 3400 (IMP) |
| E4 Adenosine deaminase | Ado | 11 | 54d | 570 (Ino)d |
| E5 Nucleoside phosphorylase | Ino | 18 | 97d | 97 |
| Guo | 40 | 32d | 32 | |
| Xao | 3.4 | 34d | 34 | |
| Pi | 1300 | 1300 | ||
| Hyp | 105 | 22d | 22 | |
| Gua | 30 | 16d | 16 | |
| Xan | 4 | 34d | 34 | |
| Rib-1P | 320d | 320 | ||
| E6 Adenylate quinase | AMP | 100c | 500i | 500 |
| ADP | 1000h | 1300i | 1300 | |
| ATP | 100c | 300i | 300 | |
| E7 Adenosine quinase | Ado | 2.0 | 0.2j | 30 (Ado)k |
| 20 (ATP)j | 20 (ATP) | |||
| 200 (AMP)l | ||||
| 1200 (ADP)l | ||||
| E8 Guanine deaminase | Gua | 46 | 6.4d | 119 (Xan)d |
- a The Ki values of the products were assumed equal to the Km values of the substrate in the cases of enzymes E1, E2, E5, E6 and E7. Except when indicated all values were determined experimentally; bvalues obtained in the presence of Ap4A; cvalues theoretically calculated with the Mathematica 3.0 program. En, represent the enzymes as specified in Fig. 1. Values taken from the literature are indicated as follows: dFranco et al. 1981; eMallol and Bozal 1988; fMarques et al. 1998; gLee and Wang 1968; hSchultz and Lowenstein 1976; iLong (1968); jYamada et al. (1980); kNewby et al. (1983); lFox and Kelley (1978).
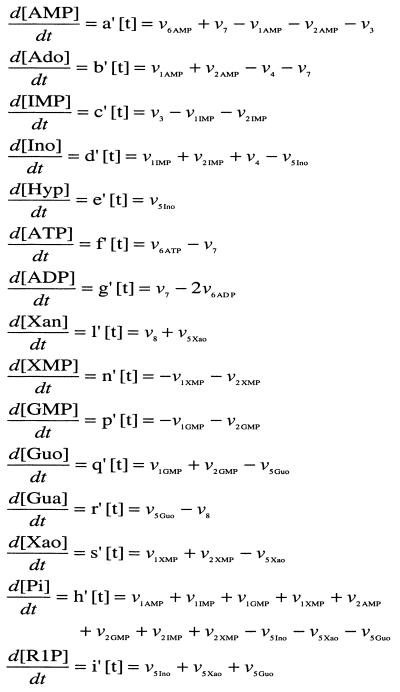
Differential equations describing the fluxes operating in the metabolism of AMP, IMP, GMP and XMP, as described in Figure 1.
Fate of AMP in the cytosol from rat brain
AMP (1 mm) was incubated, under the conditions described in Materials and methods, in the presence of rat brain cytosol. Aliquots were taken at the indicated times and analysed by HPLC (Fig. 3a). In these conditions, AMP was consumed in about 120 min incubation, with the concomitant appearance of adenosine, inosine and hypoxanthine (Fig. 3a). From the shapes of the curves of the appearance of products, it could be inferred that AMP was metabolized following the pathway: AMP→adenosine→inosine→hypoxanthine (Fig. 1). No appreciable formation of IMP or adenine was detected in these assay conditions. The potential appearance of inorganic phosphate or ribose-1-phosphate, in the course of the reaction, was not experimentally followed.
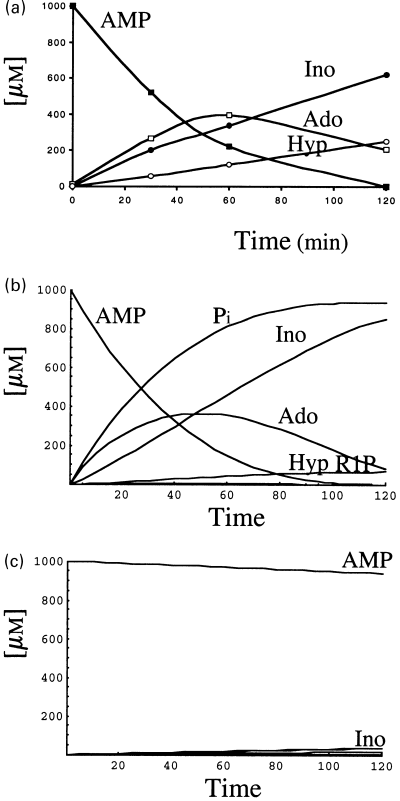
Metabolism of AMP (1 mm) by rat brain cytosol, in the absence of ATP. The reaction mixture (0.15 mL), containing an aliquot of rat brain cytosol (0.05 mg) and 1 mm AMP as described in Materials and methods, was incubated at 37 °C; at the times indicated, aliquots were taken and analysed by HPLC (a). The differential equations of Figure 2 were solved considering the occurrence of only one substrate (1 mm AMP) and using the kinetic data compiled in Table 1 (b). Influence of solubilized ecto-5′-nucleotidase (E1) on the metabolism of AMP: the same as in (b), except that E1 was equaled to zero (c).
These results were theoretically simulated after introducing the values of the kinetic parameters (Table 1) in all the velocity equations of the enzymes described in 1, 2 and considering the initial concentration of AMP as 1 mm. The corresponding differential equations (Fig. 2) were solved with the help of the Mathematica 3.0 program. It can be observed that both the time course of disappearance of AMP and appearance of the products were similar to those experimentally obtained (Figs 3a and b).
When adenosine or inosine (1 mm each) were incubated in the presence of rat brain cytosol as in Figure 3, no appreciable formation of adenine or hypoxanthine was observed, thus confirming the absence (or at least amounts below the detection limits in our experimental conditions) of adenosine or inosine hydrolase activities in those extracts; addition of 1 mm phosphate to the reaction mixture evoked, in both cases, the appearance of hypoxanthine, but not of adenine, due to a purine nucleoside phosphorylase using inosine but not adenosine as substrates (results not shown). The appearance of hypoxanthine in the experiment described in Fig. 3(a) (where no Pi was added) is due to the nucleoside phosphorylase activity present in the cytosol that uses as co-substrate the phosphate generated in the hydrolysis of AMP by the nucleotidase. Although not experimentally determined, the appearance of ribose-1-phosphate follows the same time course (as revealed by the theoretical approach) as that of hypoxanthine. The course of the phosphate appearance was also observed with the theoretical approach (Fig. 3b).
As stated in the Introduction, two 5′-nucleotidases are present in the rat brain cytosol: E1 (or e-Ns) and E2 (or c-N-II). Although in crude extracts it is difficult to distinguish whether the appearance of adenosine is due to the catalytic effect of E1(e-Ns) and/or E2 (c-N-II) on AMP, the contribution of each one of both 5′-nucleotidases was analysed theoretically, by making E2 = 0 or E1 = 0. When E2 = 0, the pattern obtained for AMP degradation (results not presented) is indistinguishable from that presented in Fig. 3(b). By contrast, when the contribution of e-Ns is mathematically eliminated (by making E1 = 0), the concentration of AMP remains almost unchanged after 150 min, with very low rates of synthesis of adenosine (Fig. 3c). Clearly, in these experimental conditions AMP is firstly degraded to adenosine by the catalytic effect of E1 (e-Ns) and not by E2 (c-N-II). The different efficiencies of E1 and E2 toward AMP are mainly due to their highly different Km values towards AMP (Table 1).
Energy charge and the metabolism of AMP
We approached the metabolism of AMP in crude extracts using more physiological conditions, i.e. considering initial concentrations of 0.3 mm AMP, 1 mm ADP and 2.7 mm ATP, resulting in an adenylic charge value of 0.8. A reaction mixture, containing those nucleotides at the indicated concentrations was analysed by HPLC at different times of incubation (Figs 4a and b). Two different ordinate scales have been used, in order to better appreciate the results. AMP and ADP decreased almost in parallel along the incubation time, whereas the concentration of ATP, after a small increase at the onset of the reaction, remained practically constant along the time of incubation. Compared with Fig. 3(a), the fate of AMP was completely different, since it was transformed preferentially into IMP, which was further metabolized to inosine and hypoxanthine (Figs 4a and b) and no adenosine was formed (compare 3, 4).
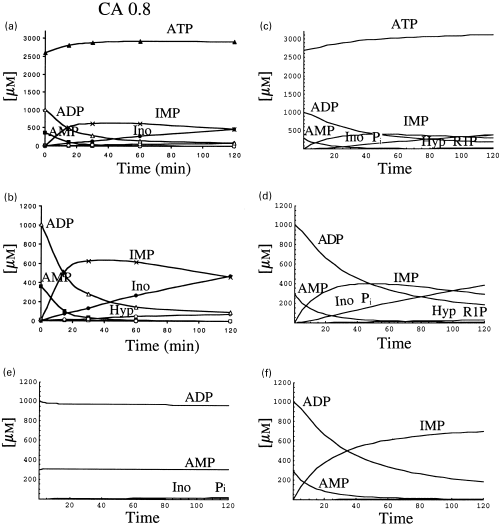
Metabolism of AMP (0.3 mm) by rat brain cytosol, in the presence of an adenylic charge value of 0.8. The experiment was performed as described in Fig. 3. The concentrations of the nucleotides present in the initial reaction mixture were: 0.3 mm AMP, 1 mm ADP and 2.7 mm ATP. The experimental results are represented at two scales, to better visualize the results (a and b). Computer simulation was made considering the kinetics values indicated in Table 1, and the nucleotide concentration indicated above. The results are represented at two scales (c and d) as in (a) and (b). For analysis of the experimental results, further representations were simulated with the theoretical approach, considering E3 = 0 (e) or E2IMP = 0 (f).
When the theoretical approach was applied to the analysis of this metabolic situation, the results (Figs 4c and d), were similar to those experimentally observed (Figs 4a and b). A more detailed analysis of the experimental results can be performed with the help of the theoretical approach. The level of adenosine (Fig. 1) results from its rate of formation through the action of two 5′-nucleotidases (E1 and E2) and its rate of metabolism by adenosine kinase (E7) and adenosine deaminase (E4). The contribution of E7 and E4 to the withdrawal of adenosine was analysed by making E7 = E4 = 0. In this situation, the pattern of AMP metabolism was not different (results not shown) from that presented in Figs 4(c and d), indicating that the absence of adenosine in the experiments shown in Figs 4(a and b) is due to the inhibition of 5′-nucleotidase E1AMP by ATP and ADP (see the velocity equation for E1) and not to a comparative higher rate of withdrawal of adenosine by E7 plus E4. On the other side, when AMP deaminase (E3) is made zero, no metabolism of AMP took place (Fig. 4e), pointing to the activation of this enzyme by ATP as the main factor in the appearance of IMP in these experimental conditions. Once IMP is formed, the emergence of inosine is due to the effect of 5′-nucleotidase E2IMP (and not E1IMP) as can be deduced from the results obtained by making E2IMP = 0, in which case no formation of inosine was detected (Fig. 4f).
The metabolism of AMP by rat brain cytosol was also analysed in the presence of 1 mm free [Mg2+], and different energy charge (or adenylic charge) values: 0.6 (0.9 mm AMP; 1.4 mm ADP, 1.7 mm ATP); 0.4 (1.7 mm AMP; 1.4 mm ADP; 0.9 mm ATP); 0.2 (2.2 mm AMP; 1.2 mm ADP, 0.6 mm ATP). The experimental results are presented, respectively, in Figure 5(a,b.c). In each case, a decrease almost in parallel of AMP and ADP was observed; the amount of ATP increased at the onset of the reaction, and thereafter (following the disappearance of AMP and ADP) its concentration was maintained along the incubation time. In the case of the reaction mixtures containing the above mentioned adenylic charge values, the metabolism of AMP was almost exclusively via IMP.
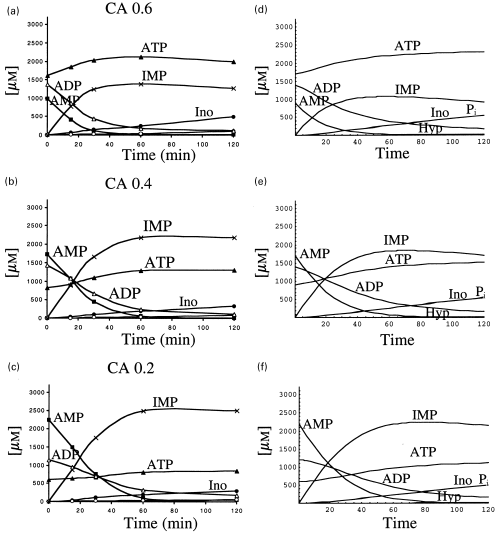
Metabolism of AMP catalysed by rat brain cytosol in the presence of different adenylic charge values. The fate of AMP, and of the other components of the reaction mixture, was followed in reaction mixtures containing adenylic charge values of 0.6 (a); 0.4 (b) or 0.2 (c). The actual composition of these mixtures is specified in the text. The results obtained when the differential equations were fed with the corresponding kinetic values, and the indicated initial substrate concentrations are represented in panels (d, e and f).
Very similar results were obtained with the theoretical approach (Figs 5d–f) by implementing the differential equations with the kinetic parameters of Table 1 and considering the initial concentrations of AMP, ADP and ATP according to the above specified adenylic charge values. The fate of ADP and ATP followed a similar pattern to that obtained experimentally, and AMP was metabolized through the action of AMP deaminase to IMP, in all the cases.
Influence of ATP on the metabolism of AMP
In the experiments so far presented, the metabolism of AMP was both experimentally and theoretically approached in the absence of ATP and in the presence of different adenylic charge values (3-5). The similitude between the results obtained with both methods gives reliability to the use of the theoretical approach for the analysis of other metabolic situations not feasible to be carried out in crude extracts, i.e. the influence of very low concentrations of ATP on the metabolism of AMP (tested at 1 and 0.1 mm). The metabolic pattern of 1 mm AMP (taken as an example of an anoxic condition) was theoretically analysed in the presence of 0, 0.1, 0.3, 1, 3, 10, 30, 100, 300 and 1000 µm ATP. Representative results, obtained in the presence of 0, 0.1, 10 and 1000 µm ATP, are shown in Fig. 6. The rates of disappearance of AMP, and appearance of adenosine are appreciably reduced in the presence of a concentration as low as 0.1 µm ATP (Figs 6a and b). Both rates are so greatly reduced in the presence of 10 µm ATP that the concentration of AMP decreased only slightly during the theoretical incubation time used (Figs 6a and c). The pattern of AMP metabolism changed greatly in the presence of 1 mm ATP, in which case the rate of disappearance of AMP and appearance of IMP increased, and no formation of adenosine was detected (Fig. 6d). As an example, an analysis of the factors contributing to the effect of ATP (3 µm) on the metabolism of AMP is depicted in Figure 6(e), using reduced ordinate and abscissa axes. At the beginning of the reaction, concomitant with the decrease in AMP catalysed by 5′-nucleotidase E1 (not visible at the scale used) there is a decrease in ATP and an increase in ADP, catalysed by adenylate kinase. Note that both ATP and ADP are inhibitors of E1 (see equation above). At longer incubation times, ADP is transformed into AMP and ATP (also catalysed by adenylate kinase); from the moment AMP and ADP are exhausted, the concentration of ATP remains unchanged in this theoretical model. Similar behaviour of the pair ATP/ADP occurred at all the concentrations of ATP used, as is also appreciated in Fig. 6(d), where a concentration of 1 mm ATP was used.

Effect of ATP on the metabolism of 1 mm AMP: theoretical analysis. This effect was analysed considering a fixed concentration of AMP (1 mm) and variable concentrations of ATP: 0 (a); 0.1 µm (b); 10 µm (c); 1 mm (d). Influence of 3 µm ATP represented in a different scale (e). The rates of disappearance of AMP, and appearance of adenosine and IMP are represented as a function of ATP concentration (f).
The influence of ATP on the metabolism of AMP is better appreciated, with the theoretical approach, when the rates of disappearance of AMP and appearance of adenosine and IMP are represented as function of the ATP concentration used (Fig. 6f). ATP has a dual effect on the metabolism of AMP: it is an inhibitor of 5′-nucleotidase (E1) and activator of AMP deaminase (E3). Minimal rates of disappearance of AMP occurred at around 10 µm ATP, a point at which the inhibition by ATP(ADP) of E1AMPis maximal and the activation of AMP deaminase is not strong enough for an appreciable synthesis of IMP. Beyond this point, the enzyme E1 is not any longer active, whereas the activation of AMP deaminase increases with concomitant appearance of IMP.
Following a similar method as that represented in Figure 6, the metabolism of 0.1 mm AMP (taken as an example of a normoxic condition) was analysed in the presence of different concentrations of ATP (Fig. 7). The pattern obtained was similar, in a broad sense, to that obtained with 1 mm AMP, i.e. the velocity of degradation of AMP diminishes (mainly due to the inhibition of 5′-nucleotidase by ATP(ADP) when the ATP is increased up to the inflexion point (around 3 µm), where the rate of degradation of AMP reaches its minimum value. As the concentration of ATP increases beyond that point, the rate of degradation of AMP increases as a consequence of the activation of AMP deaminase (Figs 7a–e). The metabolic patterns obtained in the presence of 50 µm or 10 µm AMP, and variable concentrations of ATP were also similar (results not shown) to that presented in Figure 7, corresponding to a 0.1-mm concentration of AMP.
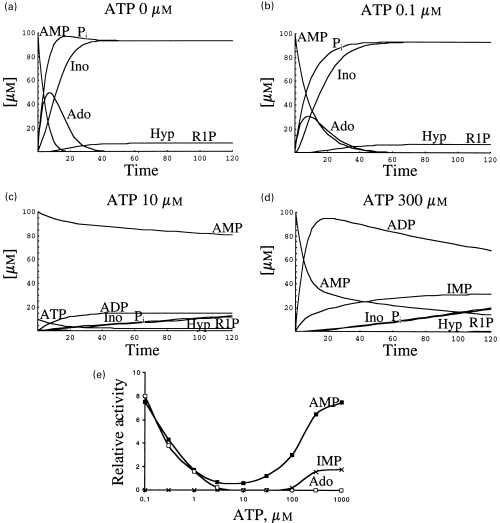
Effect of ATP on the metabolism of 0.1 mm AMP: theoretical analysis. This effect was analyzed considering a fixed concentration of AMP (0.1 mm) and variable concentrations of ATP: 0 (a); 0.1 µm (b); 10 µm (c); 300 µm (d). The rates of disappearance of AMP, and appearance of adenosine and IMP are represented as a function of ATP concentration (e).
GMP and XMP metabolism in rat brain cytosol
The metabolism of these two nucleotides was approached in a similar way to that of AMP, i.e. both nucleotides were incubated by separate in reaction mixtures containing 1 mm of GMP or 1 mm XMP and the products analysed by HPLC (Figs 8a and b). As in the case of the metabolism of AMP and IMP, the experimental results could be reproduced with the theoretical approach (Figs 8c and d). Although, in this case, the analysis was less exhaustive than that presented above for AMP, it is apparent that both approaches (experimental and theoretical) rendered similar results, in the cases of GMP and XMP. Concerning the metabolism of GMP, the non-appearance of guanine, together with the appearance of xanthine and xanthosine in the course of the reaction (Fig. 8a), is indicative of the presence of a strong activity of guanine deaminase, and of the recycling of ribose 1-phosphate in the nucleoside interconversion (Giorgelli et al. 1997).
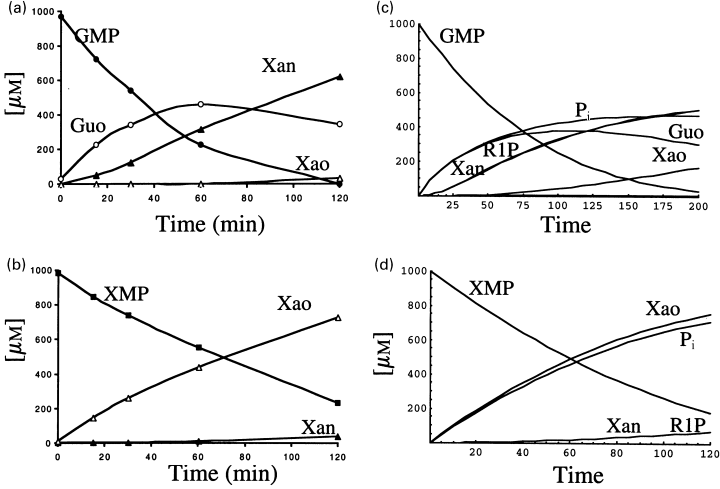
Metabolism of GMP and XMP. 1 mm GMP (a) or 1 mm XMP (b) were incubated with cytosol from rat brain and the course of the reaction was followed by HPLC as indicated in Materials and Methods. The experimental results were simulated with the help of the differential equations (Fig. 2) fed with the initial conditions and the kinetic values indicated in Table 1 (c and d).
In our hands, the metabolism of XMP yields xanthine as a final product, with very low detectable traces of uric acid. The level of xanthine oxidase in rat brain is very low (Markley et al. 1973) and because of that this enzyme activity has not been considered in the mathematical model.
As shown in Table 1, maximum velocities in both directions were determined for purine nucleoside phosphorylase in the case of the four-purine nucleoside/base pairs. The activity (in both directions) on adenosine/adenine was negligible in our experimental conditions. The ratios of the maximum velocities in the direct/reverse directions for the pairs inosine/hypoxanthine, guanosine/guanine, xanthosine/xanthine were around 0.17, 1.3 and 0.85, respectively, and the maximum velocities in the phosphorolysis of nucleosides were around 18, 40 and 3.4 mU/mg protein, respectively.
Discussion
In the work here described, two different approaches (experimental and theoretical) have been followed for the analysis of the degradative pathways of AMP, GMP, IMP and XMP catalysed by rat brain cytosol, a special emphasis being paid to the metabolic fate of AMP.
The experimental approach was used to (i) analyse the disappearance of substrates and appearance of products when nucleotides, nucleosides and bases were incubated in the presence of rat brain cytosol, (ii) determine, when feasible, the kinetic parameters of the enzymes involved in each one of these pathways; when it was not possible, those parameters were taken from previously published results.
The theoretical approach comprised the following steps: (i) setting of the velocity equation for each enzyme, taking into account the kinetic constants and the influence of potential effectors on the actual velocity; (ii) writing the differential equations describing the changes in the concentration of substrates and intermediate products as a function of time; (iii) solving the differential equations with the help of the Mathematica 3.0 (Wolfram 1996). One novelty presented in this work is the possibility of affecting the actual velocity of the appropriate enzyme as a function of a changing concentration of an effector. This method has been applied in the case of the cytosolic IMP/GMP 5′-nucleotidase (E2) and AMP deaminase (E3) both enzymes being activated in a degree depending on the concentration of ATP (see Appendix).
Special emphasis has being paid in this work to the metabolism of AMP. In the absence of ATP, AMP is transformed exclusively to adenosine, via 5′-nucleotidase c-N-II (E1). In the presence of ATP, AMP was degraded to IMP, via AMP deaminase. The study was made with rat brain cytosol, in the presence of AMP, ADP and ATP in quantities large enough to provide adenylic charge values of 0.8, 0.6, 0.4 and 0.2. In all cases, the theoretical approach fits rather well with the experimental results, in spite of the quite different initial substrate concentrations. This agreement gave us confidence to approach theoretically the influence of very low concentrations of ATP on the metabolic fate of AMP, a situation that can not be experimentally tested. The main outcome of these experiments was that the influence of ATP on the metabolism of AMP showed a biphasic nature. As the concentration of ATP increased from 0 to around 10 µm, the rate of disappearance of AMP (and appearance of adenosine) decreased up to a point where the rate of degradation of AMP was almost negligible, due to the increasing degree of inhibition by ATP of E1. Increasing concentrations of ATP, beyond 10 µm and up to 1 mm, conveyed an increase in the rate of disappearance of AMP and appearance of IMP, due the activating effect of ATP on AMP deaminase.
There are reasonable doubts on the occurrence of 5′-nucleotidase E1 in the cytosol of the cell in vivo (Piec and Le Hir 1991). Probably the occurrence of E1 in the cytosol of rat brain extracts, even as obtained in isotonic conditions and with a gentle homogenization procedure (such as it was in this work), could be artefactual. Nevertheless, an activity characterized as 5′-nucleotidase E1 has been detected in the brain extracts (Franco et al. 1981; Orford and Saggerson 1996). In our view the presence of this enzyme does not invalidate the results here presented, that can be extrapolated to an in vivo situation since, in the presence of an ATP concentration as low as 10 µm, this enzyme would not have functional importance related to the metabolism of AMP. Also, one should be aware that, in its normal location, this enzyme activity will be dependent on the now well accepted presence of extracellular nucleotides.
Appendix
The enzymes considered in Fig. 1 were numbered consecutively from E1 to E8. When a particular enzyme (i.e. E1, Figs 1a and b) metabolizes more than one substrate, the actual (v) or maximal (V) velocities are qualified with the number corresponding to the enzyme (1 refers to the enzyme E1) and subindexed with the pertinent substrate. For example (V1AMP and V1GMP) and (v1AMP and v1GMP) correspond to the maximal and actual velocities of E1 for AMP and GMP, respectively (Figs 1a and b and Fig. 2). Similarly, Km1AMP and Ki2AMP refer to the Km of E1 for the substrate AMP and the Ki of E2 by AMP, etc. (see below). The equation velocities for each one of those enzymes are written below. In general, these equations were taken from Franco and Canela (1984), with the modifications indicated in each case.
E1. 5′-nucleotidase (e-Ns) (EC 3.1.3.5)
This enzyme catalyses the dephosphorylation of mononucleotides to the corresponding nucleosides. It cleaves preferentially AMP and is strongly inhibited by ADP and ATP (Ipata 1968; Mallol and Bozal 1988; Orford and Saggerson 1996).

Terms for the inhibition of E1 by ADP and ATP were introduced in the denominator of the equation velocity.


See Table 1 for the kinetic constant values assigned to this enzyme. The values of Ki1Ado, Ki1Guo, Ki1Ino and Ki1Xao are supposed equal to the values of Km1AMP, Km1GMP, Km1IMP and Km1XMP, respectively (Table 1).
E2. IMP-GMP 5′-nucleotidase (c-N-II) (EC 3.1.3.5)
This enzyme prefers IMP and GMP to AMP. The velocity equations are as described for E1, except that: (i) the terms, in the denominator, corresponding to the inhibition by ATP and ADP have been omitted; (ii) the influence of ATP on the V and Km values of E2 for the different substrates have been considered as specified below.


As in the case of E1, the values of Ki2Ado, Ki2Guo, Ki2Ino and Ki2Xao are supposed equal to the values of Km2AMP, Km2GMP, Km2IMP and Km2XMP, respectively (Table 1). The V and Km values, experimentally determined in rat brain, were taken from Marques et al. (1998).
As stated in the Introduction, ATP and Ap4A are activators of this enzyme, increasing V and decreasing Km values in a degree depending on the substrate (AMP, GMP, IMP, XMP) considered. The factors affecting V (F2V) or Km (F2K) were calculated from the V and Km values obtained in the absence and in the presence of 0.05 mm Ap4A (and supposed to be equal to those determined in the presence of 2 mm ATP (Pinto et al. 1986; Marques et al. 1998). Those factors that are related to the ATP concentration theoretically present at each moment in the reaction mixture (as calculated by Mathematica 3.0) were introduced in the above equations according to the following criteria. It was assumed, in both cases, that the increase in V (or the decrease in Km) by ATP follows a hyperbolic (Michaelian) behaviour, reaching a plateau at a saturating concentration of the effector ATP, and a half maximal effect at a determined concentration of ATP (here named as Ka2ATP). In this context, the increase in V by variable ATP concentrations is denoted by the expression V(1 + F2V*[ATP]/([ATP] + Ka2ATP)); similarly, the decrease in the apparent Km value promoted by ATP is denoted by the expression Km(1 –F2K*[ATP]/([ATP] + Ka2ATP)). In the case of V, the F2V factors represent the difference between the maximum velocity value obtained in the presence of ATP and that obtained in the absence of ATP. In the case of Km, the F2K factors represent the difference between the apparent Km value obtained in the absence of ATP and that obtained in the presence of ATP. The values for those factors were calculated from the data presented in Table 1, and were the following: F2VAMP, 0;
 , 0;
, 0;
 , 6.4;
 , 0;
, 0;
 , 8000;
 , 3900;
 , 300;
 , 6300.
 has been considered as 1 mm for both V and Km values.
E3. AMP deaminase (EC 3.5.4.6)
The catalysed reaction is:

AMP deaminase from several sources follows complex kinetics greatly influenced by alkali metal, magnesium ions, inorganic phosphate, detergents, ATP, GTP, Ap4A (Setlow and Lowenstein 1967; Lee and Wang 1968; Chapman and Atkinson 1973; Schultz and Lowenstein 1976; Van den Berghe et al. 1977b; Schultz and Lowenstein 1978; Fernández et al. 1984; Ito et al. 1988; Spychala and Marszalek 1991; Ranieri-Raggi et al. 1995; Sims et al. 1999). There is evidence of the existence of multiple forms of AMP deaminase in rat brain with different kinetic parameters (Ogasawara et al. 1975, 1978). In the absence of ATP activator, with increasing levels of AMP, a sigmoidal curve was observed for AMP deaminase from rat brain, with apparent Km(S0.5) values in the range 5–10 mm. In the presence of ATP the velocity versus AMP concentration was nearly hyperbolic and the apparent Km(S0.5) decreased significantly (Lee and Wang 1968; Chapman and Atkinson 1973; Van den Berghe et al. 1977b). The purification and general properties of the enzyme from sheep brain have been reported (Ito et al. 1988). The enzyme also presented a hyperbolic kinetics in relation to AMP with a Km(S0.5) value of around 12.5 mm. The kinetics of the enzyme changed from sigmoidal to hyperbolic in the presence of increasing concentrations of ATP, with a decrease in the apparent Km value (from 12.5 to around 0.8 mm).
In our experimental conditions (compare 3, 4), the enzyme activity increased from being unnoticeable in the mixture containing 1 mm AMP to a substantial quantitity (around 100 mU/mg protein) when the same reaction mixture was supplemented with 1 mm ATP, a result expected from the data on the kinetic parameters previously reported for this enzyme (see References above).
We have tried to reproduce theoretically the experimental results obtained using rat brain cytosol with the following adjustments in the equation velocity: (i) the enzyme was supposed to follow sigmoidal kinetics, according to the formula

with a Hill coefficient (n) of 3; (ii) as shown above, ATP decreased the apparent Km(S0.5) value of the enzyme with a concomitant change in the velocity vs. AMP concentration curve, which changed from sigmoid to hyperbolic; this behaviour of the enzyme was theoretically simulated in a way similar to that described above for 5′-nucleotidase (E2), i.e. variable concentrations of ATP affected in a Michaelian way both the value of n (changing it from 3 to 1) and the value of Km(S0.5), changing from 7.8 mm to 0.5 mm, in the absence and presence of ATP, respectively. Therefore, the factor F3K, that modifies the Km(S0.5) value as a function of the ATP concentration, was adjusted to 7300 (i.e. 7800 − 500). The activation constant for ATP in both cases (Ka3ΑΤP) was settled at 0.05 mm (Ito et al. 1988). The formula resulting from these considerations is as above, but with n and S0.5 modified as follows:


E4. Adenosine deaminase (EC 3.5.4.4)
The catalysed reaction and the equation velocity are:


The kinetic values for this enzyme are listed in Table 1.
E5. Purine nucleoside phosphorylase (EC 2.4.2.1)
The catalysed reaction is:

The rate equations (Franco and Canela 1984; Cornish-Bowden 1995) are the following:


where,


The values of Ki5Gua, Ki5Hyp and Ki5Xan were taken from the literature or supposed to be equal to Km5Guo, Km5Ino and Km5Xao (see Table 1 for references).
E6. Adenylate kinase (EC 2.7.4.3)
The reaction catalysed is:

The reaction is assumed to be random bi-reactant (Fromm 1975), and the corresponding equation is:

The kinetic values for this enzyme are taken from previously published results (see Table 1), except that corresponding to V6AMP (equal to V6ATP) that was theoretically adjusted with the Mathematica 3.0 program from the experimental results presented in 4, 5.
E7. Adenosine kinase (EC 2.7.1.20)
The reaction catalysed is:

The reaction is assumed to be of the bi-bi ordered type (Franco and Canela 1984; Mimouni et al. 1994) with adenosine as the first acting substrate

where,


The kinetic values used for this enzyme are listed in Table 1.
E8. Guanine deaminase (EC 3.5.4.3)
The catalysed reaction and the equation velocity are:


The enzyme from rat brain shows Michaelian behaviour (Franco et al. 1981), the reaction is irreversible and inhibited competitively by the reaction product xanthine (see Table 1 for the kinetic values).
Acknowledgements
This investigation was supported by grants from Dirección General de Investigación Científica y Técnica (PM95/0013; PM98-0129) and Comunidad de Madrid (08.9/0004/98). We thank Isabel de Diego for very able technical assistance. J.O. was an Erasmus student from the Faculdade de Farmácia, Universidade do Porto (Portugal).


