Prostaglandin E Receptor Subtypes in Cultured Rat Microglia and Their Role in Reducing Lipopolysaccharide-Induced Interleukin-1 β Production
Abbreviations used : [Ca2+]i, intracellular Ca2+ concentration ; cAMP, cyclic AMP ; DMEM, Dulbecco's modified Eagle's medium ; 11dx, 11-deoxyprostaglandin E1 ; FBS, fetal bovine serum ; FSK, forskolin ; IL, interleukin ; LPS, lipopolysaccharide ; 190H, 19-hydroxyprostaglandin E2 ; PG, prostaglandin ; PGE-OH, 1-hydroxy-prostaglandin E1 ; 17PT, 17-phenol trinor prostaglandin E2.
Abstract
Abstract : Prostaglandins (PGs) are potent modulators of brain function under normal and pathological conditions. The diverse effects of PGs are due to the various actions of specific receptor subtypes for these prostanoids. Recent work has shown that PGE2, while generally considered a proinflammatory molecule, reduces microglial activation and thus has an antiinflammatory effect on these cells. To gain further insight to the mechanisms by which PGE2 influences the activation of microglia, we investigated PGE receptor subtype, i.e., EP1, EP2, EP3, and EP4, expression and function in cultured rat microglia. RT-PCR showed the presence of the EP1 and EP2 but not EP3 and EP4 receptor subtypes. Sequencing confirmed their identity with previously published receptor subtypes. PGE2 and the EP1 agonist 17-phenyl trinor PGE2 but not the EP3 agonist sulprostone elicited reversible intracellular [Ca2+] increases in microglia as measured by fura-2. PGE2 and the EP2/EP4-specific agonists 11-deoxy-PGE1 and 19-hydroxy-PGE2 but not the EP4-selective agonist 1-hydroxy-PGE1 induced dose-dependent production of cyclic AMP (cAMP). Interleukin (IL)-1β production, a marker of activated microglia, was also measured following lipopolysaccharide exposure in the presence or absence of the receptor subtype agonists. PGE2 and the EP2 agonists reduced IL-1β production. IL-1β production was unchanged by EP1, EP3, and EP4 agonists. The adenylyl cyclase activator forskolin and the cAMP analogue dibutyryl cAMP also reduced IL-1β production. Thus, the inhibitory effects of PGE2 on microglia are mediated by the EP2 receptor subtype, and the signaling mechanism of this effect is likely via cAMP. These results show that the effects of PGE2 on microglia are receptor subtype-specific. Furthermore, they suggest that specific and selective manipulation of the effects of PGs on microglia and, as a result, brain function may be possible.
Prostaglandins (PGs) have diverse roles in normal and pathologic brain function ; however, their role in brain inflammation has been most extensively studied. An important component of brain inflammation is microglial activation. Although PGs are generally considered proinflammatory molecules, they have been shown to prevent or reduce the activation of microglia (Théry et al., 1994 ; Caggiano and Kraig, 1996, 1998 ; Minghetti et al., 1997) and macrophages (Herlin and Kragballe, 1982 ; Figueiredo et al., 1990). Determination of the receptors and associated secondary signaling mechanisms responsible for this effect is important to understand further the antiinflammatory properties of PGs, the pharmacologic agents that control them, and their effect on brain function.
Microglia in vivo become activated following perturbations of normal brain homeostasis, including cell death occurring during development (Ashwell et al., 1989) and reduced neuronal activity (Borges and Berry, 1978), as well as following nerve transection (Schelper and Adrian, 1980), ischemic events (Neuwelt et al., 1978), and spreading depression (Gehrmann et al., 1993 ; Caggiano and Kraig, 1996). In vitro microglia are activated by many substances, including lipopolysaccharide (LPS), and respond by producing cytokines such as interleukin (IL)-1β (Hetier et al., 1988). Although factors that cause microglial activation have been extensively studied, the molecular and cellular processes that prevent or reduce microglial activation are largely unknown. One factor known to reduce microglial activation is exposure to PGE2. PGE2 reduces microglial-induced neuron toxicity (Théry et al., 1994), nitric oxide production (Minghetti et al., 1997), and IL-1β production (Caggiano and Kraig, 1998). The molecular mechanisms by which PGE2 acts on microglia, however, are unknown.
PGs also have important roles in modulating immune function, causing both decreased and increased lymphocyte activity (Phipps et al., 1991 ; Fedyk et al., 1996). Fedyk et al. (1996) showed that some inhibitory effects of PGE2 on normal and transformed B cells can be attributed to a single PGE receptor subtype. It is likely that the subtypes of receptors that cells express and the signaling mechanisms they use are responsible for the diverse effects of prostanoids and the complexity of their actions (Negishi et al., 1995). The ability of PGE2 to alter the immunological activation state of microglia, such as IL-1β production, may also be attributable to a subset of receptor subtypes.
Four PGE receptor subtypes i.e., EP1, EP2, EP3, and EP4, have been identified (for review, see Negishi et al., 1995 ; Narumiya, 1996). EP1 is coupled to a G protein, phosphatidylinositol production, and increased intracellular Ca2+ concentration ([Ca2+]i) (Coleman et al., 1994ab). EP2 and EP4 are coupled to a Gs protein, adenylyl cyclase activation, and cyclic AMP (cAMP) production (Honda et al., 1993 ; Coleman et al., 1994a,b ; Toh et al., 1995). There are at least three variants of EP3, and these variants can cause increased [Ca2+]i or the activation or inhibition of adenylyl cyclase (Narumiya, 1996). We sought to determine which of these PGE receptor subtypes are expressed in microglia, to demonstrate the activity of their messenger systems, and to investigate if one or more of these subtypes could reproduce the effect of PGE2 in reducing microglial activation.
MATERIALS AND METHODS
Cell culture
Primary microglial cell cultures were prepared as described by Caggiano and Kraig (1998). In brief, mixed-cell cultures were prepared with a modified technique from that of Giulian and Baker (1986) and Gebicke-Haerter et al. (1989). Wistar rat pups (Charles River Laboratories, Wilmington, MA, U.S.A.) were deeply anesthetized with halothane on postnatal day 0-2. Pups were washed with ethanol and decapitated, brains were removed into Dulbecco's modified Eagle's medium (DMEM) with 10% fetal bovine serum (FBS) and then transferred to Hanks' balanced salt solution without added Ca2+ or Mg2+, and the meninges were carefully removed. Cortices were bluntly removed from midbrain and hindbrain. Remaining meninges were removed, and brains were transferred to DMEM containing no serum. When all brains had been prepared, they were placed in a 50-ml Falcon tube containing trypsin in Hanks' balanced salt solution without added Ca2+ or Mg2+. This mixture was triturated three times and shaken at 240 rpm for 15 min at 37°C. Filtered FBS (5 ml) and DNase (0.5 ml ; 5,000 units) were added, and the tubes were spun at 1,200 rpm for 3 min. Supernatant was removed, and 5 ml of DMEM with 10% FBS and DNase was added. The solution was triturated with a 10-ml pipette until any remaining tissue clumps were dissociated. DMEM with 10% FBS was added to a volume of 30 ml. Tubes were vortex-mixed and then centrifuged for 10 min at 1,200 rpm. Supernatant was removed, 25 ml of DMEM with 10% FBS was added, and tubes were vortex-mixed and spun for 10 min at 1,200 rpm. Again, supernatant was removed, 25 ml of DMEM with 10% FBS was added, and tubes were vortex-mixed and spun for 5 min at 1,200 rpm. Following this spin, supernatant was removed, and cells were resuspended in a small volume of medium and counted on a hemacytometer. Cells were diluted to ~2 × 10⁷ cells per 12 ml with DMEM plus 10% FBS and plated in 75-cm2 flasks (12 ml per flask). Medium was completely changed after 2 days. At 4 days, one-half of the medium was changed, and at 6 days one-quarter of the medium was changed.
Isolation of microglia
At 10-16 days, plates contained a monolayer of astrocytes with microglia loosely attached and floating in the medium (Giulian and Baker, 1986 ; Levison and McCarthy, 1991). When plates were ready as assessed by microglial density in the medium, the plates were gently agitated by hand, and the medium was removed and plated onto 24-well plates, coverslips, or 35-cm2 tissue culture dishes, depending on application. Microglia were plated at ~5 × 10⁵ cells per 35-cm2 tissue culture dish and approximately one-third this number for the 24-well plates.
Identity and purity of microglia
The identity of the microglia was determined as described by Caggiano and Kraig (1998) using the markers OX-42 (MCA OX-42 ; Serotec, Oxford, U.K.) and ED-1 (MCA 431 ; Serotec). The purity of the cells was also determined as described by Caggiano and Kraig (1998) using 1,1′-dioctadecyl-3,3,3′,3′-tetramethylindocarbocyanine perchlorate low-density lipoprotein (Dil-Ac-LDL ; Molecular Probes, Eugene, OR, U.S.A.) and the vital cell marker calcein acetoxymethyl ester (Molecular Probes). Purity of cells for fura-2, cAMP, and IL-1β production was between 95 and 99%. Purity for RT-PCR experiments was >99%. The activation state of the microglial cultures was determined as described by Caggiano and Kraig (1998) using OX-42 expression density, latex microsphere uptake rate, and expression of the outwardly rectifying K+ current.
RT-PCR
Microglia intended for RNA isolation were purified three times according to the methods of Giulian and Baker (1986), to avoid possible astrocyte contamination. Total RNA was isolated from primary microglial cultures on 35-cm2 dishes using the Trizol reagent (BRL Life Sciences, Gaithersburg, MD, U.S.A.). Total RNA was also isolated from several organs (lung, heart, liver, spleen, large intestine, small intestine, kidney, and testes) and from pure astrocyte cultures for use as controls. The cDNAs were produced from the total RNAs using SuperScript II reverse transcriptase (RT+) enzyme (BRL Life Sciences). Some RT reactions were performed without the reverse transcriptase enzyme (RT-) as negative controls. Primers were designed from divergent regions of the receptor subtype cDNAs available from GenBank [EP1 (Okuda-Ashitaka et al., 1996), EP2 (Boie et al., 1997), EP3, and EP4 (Kitanaka et al., 1997)]. Primers for EP3 were designed from a conserved region of the splice variants. PCR assays were done on positive control, microglial RT+, and microglial RT-cDNAs. PCR for the EP3 receptor message was also performed on astroglial RT+ and RT- cDNAs. Primers were as follows : EP1, forward 5′ TGT ATA CTG CAG GAC GTG CGC CC 3′, reverse 5′ GGG CAG CTG TGG TTG AAG TGA TG 3′, with a product size of 537 bp ; EP2, forward 5′ GGC TTC TTA TTC GAG AAA CCA GAC CCT AGT GGC 3′, reverse 5′ AGG TCC CAC TTT TCC TTT CGG GAA GAG GTT TCA TC 3′, with a product size of 621 bp ; EP3, forward 5′ GCC GGG AGA GCA AAC GCA AAA A 3′, reverse 5′ ACA CCA GGG CTT TGA TGG TCG CCA GG 3′, with a product size of 537 bp ; and EP4, forward 5′ CCT TCT CTT ACA TGT ACG CGG GCT TCA G 3′, reverse 5′ TGC TTT CAG TTA GGT CTG GCA GGT ATA GGA GG 3′, with a product size of 676 bp.
PCR mixtures contained 1× reaction buffer, 0.2 mM deoxynucleotide triphosphates, 2.25 mM MgCl2, each primer at 100 nM, and 1-2 μ1 of RT product with Advantage cDNA polymerase mix (Clonetch, Palo Alto, CA, U.S.A.).
Cycling conditions. A two-step protocol was used for all reactions. For EP1, EP2, and EP3 the conditions were 94°C for 10 min initial melt, 94°C melt (30 s), 69.5°C anneal and extend (60 s), repeated for 40 cycles, with a final extension of 72°C for 10 min. For EP4 a melting temperature of 96°C and an annealing/extension temperature of 72°C were used.
PCR sequencing
PCR products were purified using the Qiagen (Hilden, Germany) PCR purification kit. Products were sequenced by the dye-termination half-reaction technique. PCR sequencing assays contained 200 ng of PCR product, 1.6 pM primer, and 4 μ1 of labeled nucleotide/polymerase mix. Reactions were cycled 25 times through the following steps : 96°C (10 s), 50°C (5 s), 60°C (4 min). The product was precipitated, washed, and sequenced on an automated sequencer (model 377 ; Applied Biosystems, San Francisco, CA, U.S.A.) and analyzed with Chromas software ver. 1.43 (Conor McCarthy, Brisbane, Australia).
cAMP assay
Microglia were plated on 24-well tissue culture dishes. Production of cAMP was measured according to the methods of Fardale et al. (1993). In brief, cells were loaded with [3H]adenosine in DMEM with 10% FBS for 20 h. At this time cells were washed twice with phosphate-buffered saline and exposed to agonists in DMEM with no serum for 30 min. Agonists included PGE2, 19-hydroxy-PGE2 (190H), 11-deoxy-PGE1 (11dx), 1-hydroxy-PGE1 (PGE-OH), and sulprostone (Cayman Chemical Co., Ann Arbor, MI, U.S.A.) with 10 μM forskolin (FSK). All reactions contained the phosphodiesterase inhibitor rolipram at 10 μM (Calbiochem, San Diego, CA, U.S.A.). Agonists were removed and replaced with a stop solution containing 5% trichloroacetic acid, 1 mM ATP, and 1 mM cAMP for 30 min at 4°C. Cells were then scraped from the dishes with a rubber spatula and transferred with the stop solution to 1.5-ml tubes. Tubes were spun in a microcentrifuge (16,000 g) for 1 min. These solutions were applied to Dowex columns and washed with 3 ml of doubly distilled water. The flow through was collected and counted for [3H]ATP. These columns were then placed on alumina columns and washed three times each with 3 ml of doubly distilled water. [3H]cAMP was eluted with 3 ml of 100 mM imidazole buffer, collected, and counted for radioactivity. Production of cAMP was expressed as [3H]cAMP/([3H]cAMP + [3H]ATP). All trials were normalized for cell density by expressing values as a percentage of normal controls (normal medium and rolipram with no agonist).
Fura-2 imaging
Microglia plated on glass coverslips were loaded with the ratiometric Ca2+-sensitive dye fura-2 acetoxymethyl ester (Molecular Probes) for 25 min and then washed for 10 min with normal medium. Coverslips were mounted in a movable open perfusion system (PDMI-2 ; Medical Systems, Greenvale, NY, U.S.A.) on a Leica Mikroskopie (Wetzlar, Germany) DMIRB/E microscope using a 20× objective. Fura-2 was excited at 340 and 380 nm (1 ratio/s) using a TILL Photonics Polychrome II Monochrometer (Applied Scientific Instruments, Eugene) while agonist [PGE2, 10 μM ; 17-phenyl trinor PGE2 (17PT), 10 μM ; or sulprostone, 100 μM] or control solution (normal Ringer's solution) was applied to cells via ejection from a microelectrode (Picospritzer II ; General Valve, Fairfield, NJ, U.S.A.). Agonists were dissolved in normal Ringer's solution and applied for 20 s as indicated by the bar in Fig. 5. All agonists were applied through glass microelectrodes broken to tips of 10 μM in diameter at a pressure of 35 psi. Bath solution was perfused throughout the experiments at 1 ml/min. Images were acquired with a PXL CCD camera (Photometrics, Tucson, AZ, U.S.A.) and MetaFluor Imaging Systems software (Universal Imaging Corp., West Chester, PA, U.S.A.) with an IBM-compatible computer (AST Premmia 4/66d). Images were background-subtracted and reference-corrected. Ratios of 340/380 nm fluorescence were exported to Excel (ver. 4.0 ; Microsoft Corp.), and plots were produced in SigmaPlot software (ver. 4.0 ; SPSS, Chicago, IL, U.S.A.).
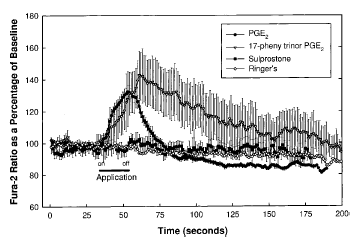
Line and scatter plot of average fura-2 responses in microglia exposed to PGE2, 17PT, sulprostone, or normal Ringer's solution. Microglia were loaded with fura-2 and exposed to agonist or control Ringer's solution using a Picospritzer. The duration of the application was 20 s and is shown by the bar labeled “on” and “off.” Each data point was normalized to the fura-2 baseline values determined by averaging each time point from 5 to 10 s into each trace. Data are group averages ± SE (bars) values. Notice the rapid and consistent rise and fall following PGE2 application. 17PT gave similar rise responses but showed a prolonged decline back to baseline. Sulprostone and Ringer's solution produced no response. Peak responses to PGE2 and 17PT were significantly different from baseline (p < 0.005). Baseline [Ca2+]i values for PGE2- and 17PT-stimulated cells were 77 ± 1.08 and 79 ± 1.57 nM, respectively ; peak values were 151 ± 6.0 and 191 ± 26 nM, respectively.
Fura-2 ratios were converted to [Ca2+]i using the homogeneous (whole-image) calibration technique of Grynkiewicz et al. (1985). Values were determined according to the following equation : [Ca2+]i = KD[(R - Rmin)/(Rmax - R)](Fo/Fs). Calibration values in our system were determined to be as follows : Rmin = 0.16 ; Rmax = 2.33 ; Fo/Fs = 8.0 ; KD = 224 nM.
IL-1β assay
Microglia were plated in 24-well plates. Two days after plating cells were exposed to agonist for 1 h and then to LPS or a combination of LPS and agonist for 24 h in DMEM containing 1% FBS. After initial plating, medium contained indomethacin (1 μg/ml) to redice endogenous prostanoid synthesis. After 24 h, medium was removed and processed for IL-1β using an ELISA kit (Biosource International, Camarillo, CA, U.S.A.).
Phase image
Phase-contrast images were acquired as with the fura-2 images, except that phase-contrast optics were used. These images were background-corrected and sharpened (3 × 3 pixel ; two passes at 50% strength) using Image-Pro Plus software ver. 3.01 (Media Cybernetics, Silver Spring, MD, U.S.A.).
Statistical analyses
All comparisons were made using Student's t test or Dunnett's test for multiple comparisons where several values were compared with a single control.
RESULTS
The appearance of a typical primary microglial culture is shown in Fig. 1. These microglia were grown in normal medium and were allowed to equilibrate in Ringer's solution used with fura-2 imaging. This image was acquired before any experimental perturbation. Note the diversity in cell size and shape, but the absence of dense cytoplasmic inclusions, which tend to indicate an activated state. This image shows the approximate density of cells used in all experimental manipulations. Microglial appearance remained unchanged for the duration of each experiment. Microglia were also characterized by their ability to increase expression of OX-42, enhance latex microsphere phagocytosis, and increase IL-1β production following LPS treatment. These results are not shown here but were reported by Caggiano and Kraig (1998).
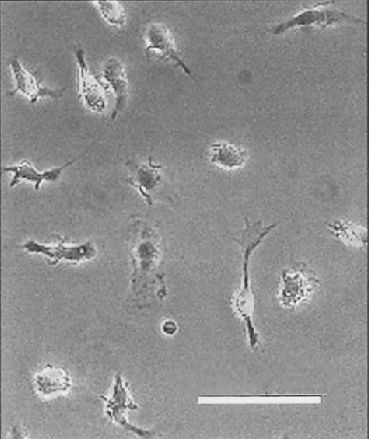
Phase-contrast digital photomicrograph of cultured rat microglia. Photomicrograph shows the morphology of microglia 3 days after isolation from mixed glial cell cultures as used in all experimental manipulations. Note the diversity in cell size and shape but the absence of membrane spiking and inclusion bodies, which might indicate activation. These microglia were plated on glass coverslips and maintained in normal medium. The image was acquired after equilibration in Ringer's solution and before experimental manipulation. Bar = 25 μm.
RT-PCR
PCR assays using primers selected for EP1 and EP2 resulted in products of the expected lengths (537 and 621 bp, respectively) in the positive control (mixed cDNAs) and microglial RT + cDNA (Fig. 2). An additional set of primers with an expected product of 257 bp was used to confirm the EP1 fragment (EP1′ ; Fig. 2). No products were found in the reactions with microglial RT- cDNA for either set of EP1 or EP2 primers. The purified EP1 and EP2 microglial products were sequenced by the dye-termination technique and shown to be identical to sequences previously published (Okuda-Ashitaka et al., 1996 ; Boie et al., 1997, respectively) for the length of interpretable signal (data not shown). The sequencing reactions of the microglial EP1 fragment yielded 474 bp of interpretable signal. All 474 bp were identical to the sequence of Okuda-Ashitaka et al. (1996). Sequencing reactions of the microglial EP2 fragment produced 516 bp of interpretable signal. All were identical with the EP2 sequence of Boie et al. (1997).
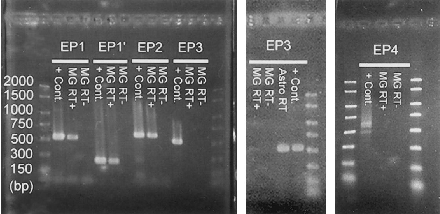
Agarose gels of RT-PCR products for the PGE receptor subtypes. Positive control cDNA (+ Cont.), microglial cDNA (MG RT +), and microglial RNA processed as in the preparation of cDNA but without the reverse transcriptase enzyme (MG RT -) were the templates for each primer pair. Astrocyte cDNA (Astro RT) was also a template for the EP3 primers. All primer sets amplified the appropriatesized product in the positive control cDNA. The markers shown on the left side indicate bp. Two sets of EP1 primers (EP1 and EP1′) and the EP2 primer set amplified the expected targets in MG RT+ but not MG RT- cDNAs. The EP3 and EP4 primers failed to produce their respective bands in MG RT+ cDNA ; however, the EP3 product was amplified from Astro RT cDNA.
PCR assays for the EP3 and EP4 receptor cDNAs yielded a product of the appropriate size (537 and 676 bp, respectively) in the positive controls but not from the microglial RT+ cDNA (Fig. 2). As EP3 message had previously been reported from rat microglial primary cultures (Kitanaka et al., 1996), we tested the primers with several different tissue cDNAs, including lung, kidney, and astrocytes, the latter of which are a common contaminant of microglial primary cultures. The EP3 PCR product was produced from each of these tissues and was especially strong from astrocyte cDNAs (Astro + ; Fig. 2). EP4 was never amplified from microglial RT+ cDNA. Each amplification assay used the same RNA extraction sample and was aliquoted from a common PCR “mix” to ensure equal template ; however, no quantitative claims are made. In addition, note that the positive astrocyte EP3 signal and the negative microglial EP3 signal suggest a lack of astrocyte contamination in the microglial cultures.
Fura-2 Ca2+ imaging
PGE2 applied to microglia using a Picospritzer produced a rapid and reversible Ca2+ response (Figs. 3-5Figs. 3-5Figs. 3-5). Figure 3 is a representative series of pseudo-colored images. The scale has been adjusted toward the red and white range to enhance visualization. The time of each image is shown in the upper right corner, and the approximate location of the Picospritzer micropipette is shown by the hand-drawn electrode tip. Low fluorescence intensities are indicated by blue and green, and higher intensities are denoted by yellow, red, and white. Notice that the central cells increase fluorescence intensity for the duration of the PGE2 application (10 μM in 20-s pulses) and then rapidly return toward their preapplication baseline. Also note that cells not in line with the PGE2 application (far left and top right) show little or no change. An example of the fura-2 ratio values and the calibrated [Ca2+]i averaged from three cells stimulated with PGE2 is shown in Fig. 4. Areas of interest for measurements were drawn around microglia as indicated in the top pseudo-colored image. Microglia measured in Fig. 4 were stimulated five times with PGE2 as described above. Each stimulation and its duration are shown by the horizontal bar above each response. Notice the rapid response to PGE2 and the rapid return toward baseline on cessation of PGE2 application. Also note the incremental response with increased duration of agonist application. These responses were typical of microglia exposed to PGE2 (Table 1).
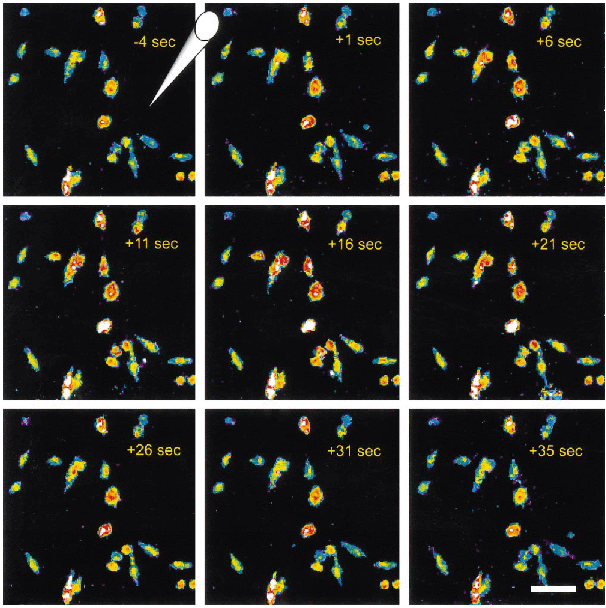
Time series of fura-2 images of microglia during exposure to PGE2. To confirm the expression and activity of the EP1 receptor, microglia were loaded with the Ca2+-sensitive dye fura-2 acetoxymethyl ester. PGE2, the EP1-specific agonist 17PT, the EP3 agonist sulprostone, or normal Ringer's solution was applied to the cells using a Picospritzer. These pseudo-colored images show the response of microglia to a 20-s application of PGE2. The cone in the upper left image shows the approximate location of the ejection microelectrode. Low [Ca2+]i is indicated by blue and green, and higher concentrations are denoted by yellow, red, and white ; however, the scale has been adjusted for demonstration purposes. The time of each image in relation to the beginning of the stimulus is shown in the upper right corners. Bar = 30 μm.
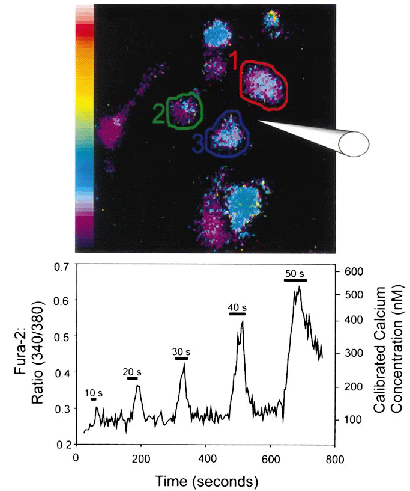
Pseudo-colored image (top panel) and line trace (bottom panel) of the average fura-2 ratios from microglia during stimulation with PGE2. Fura-2-loaded cells were exposed to PGE2 five times as indicated by the horizontal bars. Fura-2 ratios were measured from the areas of interest shown by the circled areas, and the average of these ratios is plotted below. The durations of exposures are as shown on the bars. Notice the immediate response to the application of the agonist and the incremental response with increased exposure times.
| Agonist | Initial ratio | [Ca2+]initial | Peak ratio | [Ca2+]peak |
|---|---|---|---|---|
| PGE2 (n = 30) | 0.25 ± 0.004 | 77 ± 1.08 nM | 0.33 ± 0.014 | 151 ± 6.0 nMa |
| 17PT (n = 18) | 0.25 ± 0.006 | 79 ± 1.57 nM | 0.37 ± 0.025 | 191 ± 26 nMa |
| Sulprostone (n = 24) | 0.25 ± 0.008 | 75 ± 3.02 nM | 0.26 ± 0.010 | 83 ± 3.3 nM |
| Ringer's (n = 16) | 0.24 ± 0.002 | 75 ± 0.34 nM | 0.25 ± 0.002 | 75 ± 0.35 nM |
Microglia were also stimulated with the relatively specific EP1 and EP3 agonists 17PT and sulprostone, respectively. Similar rise responses as those observed with PGE2 were produced by application of the EP1 receptor agonist 17PT but not with sulprostone or normal Ringer's solution. Normal Ringer's solution was applied with the Picospritzer in the same manner as the agonists to control for possible [Ca2+] change resulting from physical disturbance of the cell membrane due to rapid flow of the applied agonist. Figure 5 is a line plot showing the fura-2 fluorescence ratios (340/380 nm excitation ; left vertical axis) reported as a percentage of the ratios of each cell at baseline. Baselines were determined by averaging five to 10 fura-2 ratios obtained 5-10 s, e.g., five to 10 ratios obtained at 1/s, into each recording. All traces were synchronized at the point of agonist application. The average fura-2 values and the calibrated [Ca2+]i for each agonist are shown in Table 1. PGE2 (n = 30) and 17PT (n = 18) produced statistically significant increased peak [Ca2+]i (p < 0.0001). Notice in Fig. 5 and Table 1 that PGE2 and 17PT (EP1 agonist) produced very similar [Ca2+]i rise responses, reaching a peak [Ca2+]i value about twice baseline. Sulprostone (EP3 agonist ; n = 24) and normal Ringer's solution (n = 16) resulted in no significant deviation from baseline (Fig. 5 and Table 1). The return to baseline following stimulation with 17PT was prolonged compared with that of PGE2 (Fig. 5). The responses were also more variable with 17PT as indicated by the larger error bars.
cAMP production
PGE2 produced a dose-dependent accumulation of cAMP following 30 min of exposure (Fig. 6). Data are mean and ± SE percent changes from unstimulated cells (normal medium with rolipram). Unstimulated cells converted 1.75 ± 0.33% of the loaded [3H]adenosine to cAMP. Production of cAMP was significantly increased from normal at ≥100 nM PGE2 concentrations (p < 0.0005), with a maximal increase of 1,198.42 ± 173.97% at 10 μM. PGE2 concentrations > 100 μM were not able to be tested owing to increasing ethanol concentrations. The EP2/EP4-specific agonists 190H and 11dx also produced dose-dependent cAMP responses (Fig. 6) that were significantly increased from those values of normal medium (p < 0.005 values are indicated). The relatively EP4-specific agonist PGE-OH did not cause an increase in cAMP production at any concentration tested, even at 10 μM (Fig. 6). As the EP3 receptor subtype can both increase and decrease cAMP production, the relatively specific EP3 agonist sulprostone was tested for its ability to increase or reduce cAMP production in cells treated with submaximal (10 μM) FSK (Fig. 6). This FSK application resulted in production of cAMP to about one-third maximal or 450% greater than cells treated with normal medium and no FSK. A small increase in cAMP production was found at 10 μM sulprostone compared with cells treated with FSK alone (p = 0.035) ; however, this trend did not persist at 1 or 100 μM (Fig. 6). All tests were done in the presence of 10 μM rolipram.
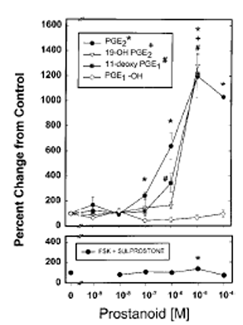
Line and scatter plot shows the cAMP production from microglial cultures. Top panel : Microglia were exposed to PGE2, the EP2 agonists 11dx and 190H, or the EP4 agonist PGE-OH for 30 min at 37°C. PGE2, 11dx, and 190H each resulted in dose-dependent cAMP production. No cAMP was produced following exposure to PGE-OH. Values were compared with control cells exposed to normal medium with rolipram using Student's t test. Significant differences from control with values of p < 0.005 are shown by the symbols indicated. Bottom panel : Microglia were treated with FSK at submaximal concentration (10 μM) and sulprostone. All values are normalized to those in cells treated with FSK and no sulprostone. Sulprostone produced a small significant increase (p = 0.035) at 10 μM, but this trend was not present at 1 or 100 μM.
IL-1β production
Application of LPS (1 μg/ml) in medium containing 1% FBS to microglial cultures for 24 h resulted in the production of IL-1β (measured by ELISA), whereas unstimulated microglia produced little or immeasurable amounts (Fig. 7). All values in Fig. 7 were normalized to those in cells treated with normal medium and no LPS. Microglia treated with LPS plus PGE2 showed a significantly reduced IL-1β production compared with microglia treated with LPS alone (p < 0.0005). Microglia treated with LPS and the EP2/EP4-specific agonists 11dx and 190H also resulted in significantly reduced IL-1β production (p < 0.0005). The respective EP1, EP3, and EP4 agonists 17PT, sulprostone, and PGE-OH showed no reduction in IL-1β production (Fig. 7). IL-1β production was also measured from cultures treated with LPS and FSK or LPS and dibutyryl cAMP (Fig. 7). Both FSK and dibutyryl cAMP resulted in significant reductions in IL-1β production when compared with cells treated with LPS alone (p < 0.0005).
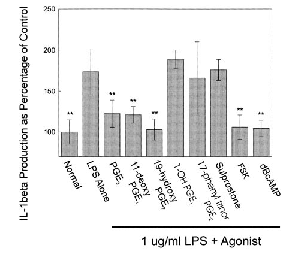
Histogram of IL-1β production from microglia following exposure to LPS. Microglial cultures were incubated in medium containing 1 μg/ml LPS and the indicated agonists for 24 h. Data from each trial were normalized to the mean IL-1β values from cultures treated with normal medium and no LPS. PGE2 and the EP2 agonists 11dx and 190H significantly reduced the IL-1β production. The EP1, EP3, and EP4 agonists 17PT, sulprostone, and PGE-OH were ineffective at reducing the LPS-induced IL-1β production. Forskolin and dibutyryl cAMP (dBcAMP) also significantly reduced the IL-Iβ production. Data are group mean ± SE (bars) values and were compared with IL-1β production from cells treated with LPS alone. **p < 0.005.
DISCUSSION
We investigated the expression of PGE2 receptor subtypes and specific mechanisms by which the common prostanoid PGE2 acts on cultured rat microglia. Microglia were shown to express the EP1 and EP2 receptor subtypes but not the EP3 or EP4 subtypes. Microglia responded to PGE2 application with [Ca2+]i and [cAMP] increases. 17PT, but not sulprostone, also produced [Ca2+]i responses. 11dx and 190H resulted in cAMP production, whereas PGE-OH and sulprostone resulted in no, or extremely small, changes in cAMP production. PGE2, 11dx, 190H, FSK, and dibutyryl cAMP reduced IL-1β production induced by 24 h of LPS exposure. These results show that EP1 and EP2 receptor subtypes are expressed and functional in microglia. Furthermore, EP2 stimulation and concomitant cAMP production can reproduce the effects of PGE2 on LPS-induced IL-1β production.
Microglia are known for their ability to produce prostanoids in vitro (for review, see Minghetti and Levi, 1998), but the modulatory effects of prostanoids on microglial activation have only recently begun to be investigated (Théry et al., 1994 ; Caggiano and Kraig, 1996, 1998 ; Minghetti et al., 1997). It is surprising that these recent reports show that PGE2 reduces microglial activation. Although a reduction in microglial activation by PGE2 might seem counterintuitive, it is now supported both by measurements made in vivo (Caggiano and Kraig, 1996) and by measurements made in vitro (Théry et al., 1994 ; Caggiano and Kraig,1996, 1998 ; Minghetti et al., 1997). Knowledge of the specific receptor subtypes and secondary messenger signaling mechanisms responsible for reduced microglial activation by PGE2 will enhance our understanding of how prostanoids influence brain inflammation. Furthermore, such information will begin to define the molecular mechanisms that control microglial activation.
The EP receptor subtypes are stimulated by various synthetic prostanoids. The specificity of these EP receptor subtype agonists is not entirely defined. PGE2 activates all EP receptor subtypes. 17PT is specific for EP1 (Lawrence and Jones, 1992 ; Meja et al., 1997). The synthetic prostanoid sulprostone also has some activity at EP1 (Chen and Woodward, 1992 ; Coleman and Sheldrick, 1989 ; Lawrence et al., 1989) but has much greater activity at EP3 (Meja et al., 1997). The EP2 and EP4 subtypes are difficult to distinguish. 11dx and 190H are active at EP2 and EP4, with differing specificities in different preparations (Woodward et al., 1993 ; De Vries et al., 1995 ; Meja et al., 1997). PGE-OH has been shown to be active at EP4 but not EP2 (Kiriyama et al., 1997). We therefore used a combination of RT-PCR and multiple selective agonist experiments to determine the presence and activity of the EP receptor subtypes and to determine which of these subtypes can reduce IL-1β production.
Microglial response to PGE2
Microglia responded to PGE2 application with increased [Ca2+]i and [cAMP] (Figs. 3-6Figs. 3-6Figs. 3-6Figs. 3-6). [Ca2+]i responses in microglia occur with LPS (Bader et al., 1994), prion protein fragments (Herms et al., 1997), endothelins, and complement factors (Moller et al., 1997a,b). PGE2 also induces cAMP production in microglia (Palrizio et al., 1995) ; however, the receptor subtypes responsible for these effects are unknown. The fact that the EP1 and EP2 receptor messages were amplified from microglial cDNA (Fig. 2) suggested that these receptors may be responsible for the [Ca2+]i and cAMP responses to PGE2, respectively. The EP1-specific agonist 17PT produced [Ca2+]i responses (Fig. 5 and Table 1). 17PT was slightly more effective than PGE2 and was effective at concentrations consistent with the literature (Chen and Woodward, 1992 ; Crankshaw and Gaspar, 1995). Sulprostone, an agonist with more specificity for the EP3 receptor, did not produce a fura-2 response (Fig. 5 and Table 1). This suggests that the [Ca2+]i response of microglia to PGE2 is the result of EP1 stimulation. The fact that 17PT was more potent than PGE2 may be due to the ability of PGE2 to stimulate other EP receptors, such as EP2. Perhaps EP2 stimulation can limit the Ca2+ response through a cAMP-mediated mechanism. The actual cause of this effect is unknown.
To confirm that the microglial EP1 amplified with RT-PCR and shown to be active by fura-2 imaging is similar to that described elsewhere (Okuda-Ashitaka et al., 1996), a second set of PCR primers was used that also amplified their appropriate product (EP1′ ; Fig. 2). The EP1 PCR product was sequenced and shown to be identical to this previously published sequence. Thus, microglia express EP1 that has the predicated sequence, and this receptor is functional in cultured microglia.
Sequencing the microglial EP2 product confirmed its identity with the previously published sequence (Boie et al., 1997). The EP2 agonists 11dx and 190H resulted in dose-dependent cAMP production at doses consistent with the literature (De Vries et al., 1995). 190H and 11dx can bind to both the EP2 and EP4 receptors ; however, the EP4 agonist PGE-OH has no activity at the EP2 receptor (Kirimaya et al., 1997). The absence of an EP4 PCR product and the lack of response with the EP4-selective agonist PGE-OH (Figs. 2 and 6) suggest that the cAMP productions from PGE2, 11dx, and 190H exposure are the result of EP2 stimulation.
The EP3 product was not amplified from microglia, although it has been previously found in microglial cultures (Kitanaka et al., 1996). The EP3 primers were tested on cDNAs from lung and kidney and produced the expected product size ; therefore, the EP3 primers appear functional. Differences in culture conditions may have led to differences in EP3 receptor expression, or the cultures in this previous report may have contained a few astrocytes, a common contaminant of microglial cultures. We tested whether the EP3 product could be amplified from astrocyte cDNA. Indeed, astrocyte cDNA was the strongest of the templates used for EP3 amplification (Fig. 2). These RT-PCR techniques do not show quantitative differences in expression ; rather, this method shows the presence or absence of the message. To insure our microglial cultures intended for RNA isolation were as pure as possible, the purification techniques of Giulian and Baker (1986) were repeated three times for a total of nine purification steps. To test further if EP3 was present in our cultures, we tested microglia for their ability to respond to EP3 agonists with [Ca2+]i increases or cAMP production increases or decreases, as each of these properties has been attributed to EP3 (Narumiya, 1996). Application of the EP3 agonist sulprostone resulted in very little fura-2 response (Fig. 5 and Table 1). The extremely small cAMP enhancement at 10 μM and its absence at 100 μM (Fig. 6), in addition to the lack of a Ca2+ response and no RT-PCR product, strongly suggest that EP3 is not expressed (or expressed very weakly) in our microglial cultures.
Receptor-specific effects of PGE2
Microglial expression of complement type III receptor during brain inflammation (Caggiano and Kraig, 1996) and the neurotoxic effects of activated microglia in vitro (Théry et al., 1994) are modulated by agents that alter PGE2 production or PGE2 itself. Furthermore, PGE2 reduces nitric oxide synthase expression and activity (Minghetti et al., 1997) and IL-1β production (Caggiano and Kraig, 1998) in cultured microglia. One characteristic response of activated microglia is the secretion of cytokines, including IL-1β (Minghetti and Levi, 1998). PGE2 reduces this production in response to LPS stimulation (Caggiano and Kraig, 1998). The EP2 agonists 11dx and 190H also reduced this production (Fig. 7), but the relatively specific EP4 agonist PGE-OH did not (Fig. 7). The EP1-specific agonist 17PT failed to reduce LPS-induced IL-1β production (Fig. 7), indicating that the EP1 receptor is not necessary for this effect. These results demonstrate that PGE2 likely acts through the EP2 receptor to prevent LPS-induced IL-1β production ; however the EP1 receptor may function in another capacity and aid in reducing microglial activation. The EP2 second messenger cAMP (Narumiya, 1996) could mimic the effects of PGE2. The adenylyl cyclase stimulant FSK was applied to cells during LPS stimulation and significantly reduced IL-1β production (Fig. 7). FSK and its common control dideoxy-FSK can block K+ currents (Tokimasa, 1995). As blocking K+ currents reduces IL-1β production (Caggiano and Kraig, 1998), the cAMP analogue dibutyryl cAMP, which does not block K+ currents (Tokimasa et al., 1991), was used to repeat the FSK observation (Fig. 7). Both FSK and dibutyryl cAMP blocked IL-1β production, indicating that the EP2 second messenger system (cAMP) reproduces the effects of PGE2, further suggesting that the inhibitory effects of PGE2 on microglia occur through EP2.
Implications in the brain
Microglia are the immune effector cells of the brain (Perry et al., 1985 ; Ling et al., 1990) and may trigger immune responses as antigen-presenting cells (Ling et al., 1991). Modulating their activation in disease, injury, and normal brain surveillance may be possible with PGs. PGE2 inhibits growth and activation of other immune functioning cells, including macrophages and lymphocytes (Herlin and Kragballe, 1982 ; Figueiredo et al., 1990 ; Roper and Phipps, 1994 ; Roper et al., 1994 ; Fedyk et al., 1996). EP2 stimulation is sufficient for mediating this effect on lymphocytes (Fedyk et al., 1996). We found that EP2 stimulation was sufficient to reduce the activation of microglia as determined by IL-1β production (Fig. 7). If this characteristic of EP2 holds true in other immunologically active cells, it will provide a target to direct the antiinflammatory properties of PGs.
In summary, microglia express both EP1 and EP2 but not EP3 and EP4 receptor subtypes. These subtypes cause a microglial [Ca2+]i and cAMP response to PGE2. The EP2 receptor subtype is sufficient to cause the PGE2 reduction in IL-1β production, and this process is likely the result of cAMP production. These findings begin to explain the cellular and molecular mechanisms by which PGE2 modulates microglial activation and increase our understanding of both microglial and prostanoid function in the brain.
Acknowledgements
R.P.K. was supported by grant NS-19108 from the National Institute of Neurological Disorders and Stroke, Zenith Award ZEN-96-031 from the Alzheimer's Association, and the Brain Research Foundation of the University of Chicago. A.O.C. was supported in part by Medical Scientist National Research Service Award T32-GM-07281 from the National Institute of General Medical Health. We thank Dr. Wei-Jen Tang for technical assistance with cAMP assays (supported by grant TN-53459 from the National Institutes of Health), Dr. D. J. Nelson for assistance with RT-PCR work, and Dr. P. E. Kunkler for a critical reading of this article. We also thank Marcia Kraig for assistance with culture preparation and Dr. C. D. Lascola and Raymond Hulse for technical assistance.


