Complexity and temporal dynamics of frequency coding in the awake rat auditory cortex
Abstract
Auditory cortical neurons are elements of a neuronal network that decomposes sounds into spectral and temporal information. In particular, their frequency selectivity has been investigated in great detail. Most studies used anaesthetized preparations and found mainly simple V-shaped tuning. The few data available from awake animals indicate that more complex forms of spectral receptive fields, i.e. frequency response areas, can be found there. We investigated frequency response areas in the awake rat primary auditory cortex using statistical evaluation and found complex forms of frequency response areas with several separate subregions in many neurons, besides classical V-shaped tuning. Response areas, as determined with narrow band noise, were very similar to those measured with pure tones. Their width was well correlated to the response strength to white noise stimulation. These results suggest that the excitatory subregions of frequency response areas were the neurons' predominant characteristic, relevant also for the processing of more complex types of stimuli. Investigating the spectrotemporal dynamics of frequency response areas revealed that approximately one-third of the neurons showed long-lasting excitatory or inhibitory components in addition to the typical ON-response. Inhibition was usually of longer duration and occurred mainly in frequency ranges outside the range of initial excitatory responses. These results indicate that auditory cortical neurons in awake animals can represent spectrotemporal information of rather different complexity.
Introduction
Characterizing the stimulus selectivity of sensory neurons is a prerequisite for understanding how the world is represented in the brain. In addition, this is an important step in identifying the contribution of a brain area to a specific perceptual task. For the auditory system, stimulus encoding is only characterized in detail in brain areas of species with well understood auditory behaviour, such as the forebrain of song-birds (Doupe & Kuhl, 1999), or the bat auditory cortex (Suga, 1992; Fitzpatrick et al., 1998). Fundamental feature-processing characteristics are less completely resolved in mammalian species besides bats. The vast majority of information on encoding in the auditory cortex comes from studies in anaesthetized animals. Auditory cortical neurons were found to be tuned for a number of independent features of simple stimuli including frequency, intensity, amplitude modulation, frequency modulation, and binaural structure (de Ribaupierre, 1997). On the other hand, auditory cortical neurons can also exhibit complex acoustic processing and show, e.g. high selectivity for complex stimulus patterns such as species-specific vocalizations (Glass & Wollberg, 1979; King, 1995; Wang et al., 1995).
The most prominent feature of central auditory neurons is the tuning to sound frequency. Neurons mainly respond to spectral energy in a narrow frequency band, exhibiting excitatory responses to stimulation in a V-shaped receptive field in the frequency/intensity plane, also called the frequency response area. Such simple spectral receptive fields were found in the primary auditory cortex of the rat (Sally & Kelly, 1988; Gaese & Ostwald, 1995), as well as in anaesthetized preparations of other mammalian species (Brugge & Merzenich, 1973; Merzenich et al., 1973; McMullen & Glaser, 1982; Aitkin et al., 1986; Redies et al., 1989; Shamma et al., 1993). More complex forms of frequency response areas, on the other hand, were found in awake preparations (Abeles & Goldstein, 1972; Funkenstein & Winter, 1973; Manley & Müller-Preuß, 1978). However, recordings in some of the earlier studies might have come partially from secondary fields (Recanzone et al., 2000). A higher percentage of more complex tuning came from the awake primate auditory cortex, where spectrotemporal receptive fields were determined using the reverse correlation technique (deCharms et al., 1998). Still, spectrotemporal receptive fields that include both, inhibitory and excitatory components have been described also in anaesthetized preparations (Depireux et al., 2001; Schnupp et al., 2001; Miller et al., 2002).
This somewhat confusing pattern seems to be caused to some extent by the effects of anaesthesia. We recently demonstrated a strong effect of anaesthesia on spectral receptive fields in the rat auditory cortex, resulting in a strong reduction of the percentage of neurons exhibiting tuned frequency response areas under anaesthesia. The remaining neurons showed only narrow excitatory response areas, thereby probably hiding more complex receptive field structures (Gaese & Ostwald, 2001). Thus, it seemed necessary to investigate auditory processing systematically in awake animals in order to describe the full complexity of spectral receptive fields, and we started to investigate frequency response areas and frequency-intensity tuning in the awake rat primary auditory cortex. In addition, temporal dynamics of spectral selectivity was investigated for a range of intensities, covering a major part of the intensity range relevant for acoustic communication. Thereby we were able to extend the data already available on spectrotemporal receptive fields in the auditory cortex (e.g. Kowalski et al., 1996; deCharms et al., 1998) that were usually determined for one given intensity.
Materials and methods
Six female albino rats (Sprague–Dawley, 250–350 g) were used in this study. Multiple recording electrodes were chronically implanted in the primary auditory cortex of one hemisphere. Starting one week after surgery, several recording sessions were performed where responses to acoustic stimulation of several single neurons were acquired simultaneously.
Surgical and histological procedures
Chronic recording was performed using either standard tungsten electrodes (F. Haer, 7–12 MOhm) or stereotrodes, a type of two-channel electrodes (McNaughton et al., 1983). Stereotrodes were constructed from two strands of fine nichrome wire (25 µm) insulated to the tips, and twisted together. They were glued to a 100-µm-diameter tungsten rod for stabilization and their tips were sharpened using an electrode beveller. Each electrode was mounted in a separate miniature microdrive (Wilson et al., 1991), which was adjustable with a precision of approximately 20 µm.
To implant electrodes mounted in microdrives, animals were anaesthetized with chloral hydrate (0.35 g/kg). A craniotomy was performed in one hemisphere dorsal to the auditory fields. Usually three electrodes were lowered under stereotaxic control into the cortex at an angle of approximately 20° to the side (frontal plane) in order to penetrate the primary auditory cortex tangentially in cortical layers II to IV (Paxinos & Watson, 1986). A silver wire (250 µm) was placed in the corpus callosum and served as a reference electrode. Afterwards the exposed cortical tissue was covered with sterilized bone wax and the implants were fixed in position together with a connector plug using dental acrylic. Electrodes were connected to the plug via small copper wires. Surgery and animal handling was carried out in accordance with the European Communities Council Directive of 24 November 1986 (86/609/EEC) and followed German federal regulations.
After recording, each electrode track was marked with two or three electrolytic lesions. The animal was then transcardially perfused under deep anaesthesia. The brain was sectioned and the 40-µm sections were stained in two series: Nissl and myelin staining (Schmued, 1990). Recording tracks were reconstructed from the lesions and it was determined whether recording sites were located in area Te 1, the presumed primary auditory cortex (Zilles, 1985).
Electrophysiology
Neural signals were sampled with a miniature eight-channel preamplifier (modified after Buzsàki et al., 1989), that was connected to the implanted plug and on the output side to a flexible cable. Signals were then passed through a set of four custom-built two-channel filter-amplifier modules (10 000×, 500 Hz−5 kHz) and fed into digital oscilloscopes and a computer for further inspection and recording. Action potentials were digitized at 32 kHz per channel and stored on a computer using the Discovery acquisition software (Datawave Technologies). Single units were detected using a spike-sorting algorithm based on spike waveforms. Several parameters as peak height, spike width, peak-to-peak amplitude, etc. were calculated from the waveform and were inspected for clustering. In the case of stereotrodes the recording principle uses the relative amplitudes of unit signals on the two channels to aid unit isolation. Activity of small clusters of cells (multiunit activity) was determined in addition to isolated single units at all recording sites. Frequency response areas (see below) were determined also for this type of activity. However, data from these multiunits were used only to examine the tonotopic organization of the primary auditory cortex (see Fig. 7).
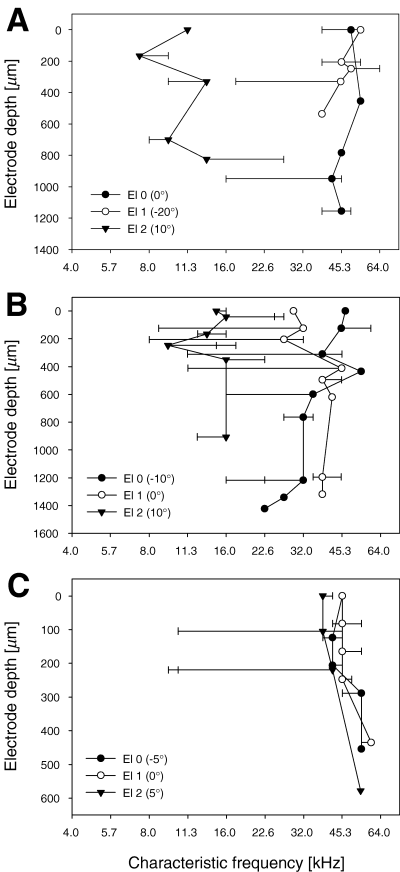
Changes of characteristic frequency along dorsoventral electrode tracks through the primary auditory cortex. Depicted are the CFs at recording sites along different electrode tracks in three animals (A–C). Electrode depth of recording sites along the more or less dorsoventrally orientated tracks are given relative to the depth of the first recording site in the primary auditory field. The ‘dominant frequency’ of a recording site (marked with symbols) was defined as the CF of the neuron that was closest to the CF of the additionally recorded multiunit activity. CFs of other neurons recorded at this site that differed from this are indicated by horizontal bars. Many symbols stand for more than one neuron, as up to three neurons were recorded simultaneously at a given recording site. Three different electrode tracks (El 0, El 1, El 2) are shown for each animal with the orientation of the track relative to the frontal plane given in parenthesis. Positive values indicate an angle towards more rostral sites, negative values indicate an angle towards more caudal sites with increasing electrode depth.
Acoustic stimulation
Stimuli were generated by a computer-controlled digital function generator (Hortmann UFS). Stimulus intensity (dB SPL re 20 µPa) was regulated by a computer-controlled attenuator and a passive Hewlett-Packard attenuator. Signals were amplified (Conrad WPA 600 Pro) and transmitted by a loudspeaker (Technics EAS 10 TH 400 A). The frequency response of the stimulus-generating system was determined using a 1/4′′ condenser microphone (Brüel and Kjaer 4135 together with 2804 preamplifier). Sound pressure level of noise band stimuli was individually measured using a Brüel and Kjaer 2610 sound pressure meter. The frequency response of the system was flat (±3 dB) between 1.5 and 50 kHz and rolled off above that at 10 dB/octave.
For stimulation we used pure tones (100 ms duration, 5 ms rise/decay time), white noise bursts (100 ms duration, 5 ms rise/decay time), and clicks (0.5 ms duration, 0.1 ms rise/decay time). To determine frequency response areas we used sets of pure tones with 88 different frequency/intensity combinations. These pure tones with intensities of 30, 50, 60, or 70 dB SPL and 22 different frequencies between 2 kHz and 76 kHz (0.25-octave spacing) were delivered in a random sequence for each repetition. After each repetition of all combinations, randomization was recalculated for the next repetition. Repetition rate of stimuli was around 1 Hz (randomly varied up to 40%). Usually 20 repetitions of each stimulus were delivered. Because unrestrained animals cooperate for only a limited amount of time, the testing at additional sound pressure levels or of frequencies at higher resolution was not possible. Therefore we tested the sound pressure range of normal communication and additionally 30 dB SPL, as the minimal threshold of a majority of neurons under anaesthesia was at this level (Sally & Kelly, 1988).
Frequency response areas were additionally determined using narrow-band noise stimuli of 20, 40, 50 and 60 dB SPL. These stimuli were calculated beforehand from gaussian noise, filtered with an IIR-filter (Butterworth, 12th order) and multiplied with a centre frequency between 2 and 64 kHz (0.5-octave spacing, additionally at 38.0 kHz). The width of the noise bands was 0.5 kHz for centre frequencies up to 16 kHz and bandwidth was 1 kHz above that. Again, stimuli of different centre frequency/intensity combinations were delivered in random order.
Experimental procedures
Rats were trained to sit quietly during recordings on a post in a shielded, sound-attenuating room. The animal was sitting in a half-cut plastic tube (diameter 5 cm) covered with woollen felt that was attached to a holder at the far end. The animal's head protruded from the tube. Acoustic stimuli were delivered in a free-field situation by a loudspeaker located in the horizontal plane 0.8 m from the pinna and 30° contralateral to the exposed hemisphere. After adapting to the situation rats were trained to keep their head in a forward position (±10°). They usually relaxed in that position. Trained animals kept quiet for periods up to several minutes (no head movements), after which they needed a short break and were rewarded with sugar water. Electrophysiological recording was paused during the break and was resumed when the animal was again in its desired position. Trials were discarded and recording was paused if head movements of more than 10° deviation occurred. Pinna movements occurred almost only in conjunction with head movements. No loud stimuli were applied to avoid reflectory pinna movements (Preyer reflex). Behaviour was closely monitored by a video camera located in frontal direction. The desired head position of the animal was marked on the monitor.
When the rat was seated on the post in the soundproof chamber at the beginning of a recording session, each electrode was lowered in small steps until action potentials could be clearly discriminated from background noise and the spike sorting system detected one or more stable single units. Electrodes were advanced up to 400 µm per day. Click stimuli and white noise bursts were delivered to test if the unit could be acoustically driven. Spontaneous activity was then recorded for 150 s and finally the frequency response area of the unit was determined with the stimulus combinations as described above. The recording technique used allows for very stable recording over several hours even in moving animals (Wilson & McNaughton, 1993). Stability of neuron recordings was checked carefully by inspecting spike waveforms throughout the experiment and again off-line in the dataset. Only very few units had to be removed from the dataset due to unstable recordings.
Data analysis
The process of spike sorting was performed again off-line by inspecting spike waveforms and determining the clustering of waveform parameters. If the clustering was not clear using the parameters noted above we also inspected separation according to first and second principal component. Clusters that disappeared during the course of the experiment or that showed no clear, stable waveform were removed from the data set.
Stimulus-induced activity was analysed using dot-displays and peri-stimulus-time histograms (PSTHs). As responses were sometimes rather variable we used statistical methods to quantify the effects of stimulation (Gaese & Ostwald, 2001). Frequency response areas for pure tone and noise band stimulation were determined by evaluating the stimulus-evoked activity on a trial-by-trial basis using Wilcoxon's matched-pairs signed–rank (MPSR) test (Siegel & Castellan, 1988). It was tested whether an increase (for excitation) or decrease (for inhibition) of activity had occurred in a significant number of trials during stimulation (i.e. first 20 ms after stimulus onset) compared to spontaneous activity (i.e. 20 ms before stimulus onset of the same trial). This measure is based on the trial-by-trial behaviour of neurons, ensuring that no singular strong responses in one or a few trials can occlude the general pattern. The 20-ms time window during stimulation was chosen as on one hand the phasic excitatory ON-response fell well into this window, on the other hand the interfering effect of the sometimes occurring inhibition right after the ON-response should be kept to a minimum. Minimal neuronal latency was always taken into account, and during analysis it was checked if the ON-response was indeed inside the analysis window.
All results for a neuron were combined into one plot with the level of significance coded in dot size (P < 0.05, P < 0.01 and P < 0.001; Fig. 1). Excitatory responses (filled circles, Fig. 1) or inhibitory responses (open circles) could be detected. Significant frequency response areas were defined by additional criteria. Minimal size of a response area or a separated subregion was at least one large dot (P < 0.001), two neighbouring dots with at least one medium (P < 0.01), or three neighbouring small dots (P < 0.05). Single, isolated points were therefore regarded as outlayers, as would be the case using smoothing procedures (see for example Sutter & Schreiner, 1991). For further analysis we determined the response areas' size (number of dots), minimal threshold, and characteristic frequency (CF). CF was determined as the frequency with a significant response at minimal threshold. In case of broad tuning with significant responses to several frequencies at lowest stimulus level, CF was determined as the frequency with the most significant response at minimal threshold or, in case of several responses with the same level of significance at minimal threshold, their mean frequency. The latter was the case in approximately 9% of the neurons with mostly significant responses at two adjacent frequencies. Response latency of a neuron was determined for tonal stimulation with best frequency (BF) at 70 dB SPL. BF was again determined as the frequency eliciting the most significant response at that SPL (additional rules as for CF).
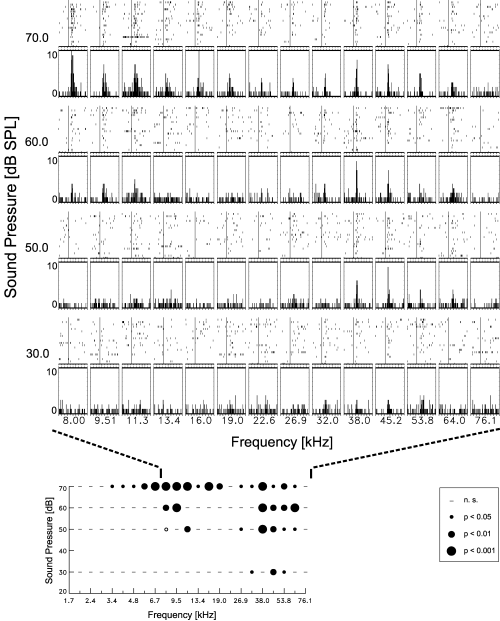
Determination of the frequency response area of a single neuron in the rat auditory cortex: neuronal activity data (upper part) and statistical evaluation (lower part). Response areas where determined by pure tone stimulation at four different sound intensities and 22 different stimulus frequencies between 2 and 76 kHz (depicted only 8 kHz to 76 kHz). Top: dot displays (first trial at top) and PSTHs (binwidth 2 ms) for each frequency/intensity – combination show activity 50 ms before stimulus onset (vertical bar in dot display) and 100 ms during the stimulus. Dot displays indicate the typical degree of variability in responses of neurons in the awake rat auditory cortex. Bottom: statistical evaluation of responses as shown in the top part of the figure, but for the whole range of frequencies tested. Using Wilcoxon's MPSR-test we could detect either stimulus-induced increases (filled circles) or decreases (open circles) of activity at three different levels of significance that are coded in dot size. Large dots indicate highly significant responses.
This method for determining frequency response areas based on statistical evaluation (MPSR-test) was also compared to the frequently used methods based on average firing rate (e.g. Davis et al., 1995; Recanzone et al., 2000). Contour plots were created showing the distribution of mean responses in the tested frequency/intensity range at 25%, 50%, and 75% of maximum firing rate. Frequency response areas based on average firing rate were determined as areas where mean response activity was above the mean plus 1 SD (standard deviation) of the spontaneous activity level. Spontaneous activity was the same as that used for statistical evaluation noted above, however, data from five frequency/intensity-combinations were averaged for mean and SD for better reliability.
To investigate the spectrotemporal dynamics of frequency tuning we determined frequency response areas as noted above for the whole stimulus duration (100 ms) in 20-ms time windows. The size of the time window was set, again, to be long enough for an estimate of activity in single trials, and to be short enough to still catch the temporal dynamics of stimulus-induced activity.
Results
A total of 150 single neurons were recorded from 77 recording sites in six animals. Much care was taken to include only stable neurons, as determined by careful inspection of spike waveforms (Gaese & Ostwald, 2001). All cells were from middle cortical layers (II–IV) of area Te 1, the presumed primary auditory cortex (Sally & Kelly, 1988). Most neurons were recorded in cortical layers II/III. Neurons from all recording sites were responsive to click and/or white noise stimulation. Spontaneous activity of the cells covered a wide range between 0.3 Hz and 63 Hz. The distribution of spontaneous rates decayed exponentially towards higher rates (Fig. 2).
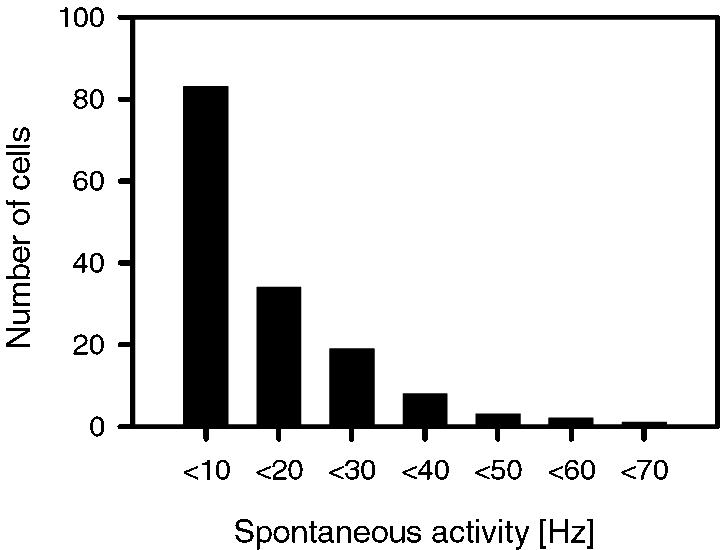
Distribution of spontaneous activity rates of 150 neurons in rat primary auditory cortex.
Response characteristics of awake cortical neurons
Neurons showed usually ON-phasic responses to pure tone stimulation (113 out of 150). An additional tonic response of excitation occurred in the remaining neurons, sometimes after stimulation with very different sound frequencies. Prominent tonic inhibition could be seen as well (see below). Response latencies to tonal stimulation of 70 dB SPL and BF were between 5 and 20 ms with most latencies around 10 ms (Fig. 3).
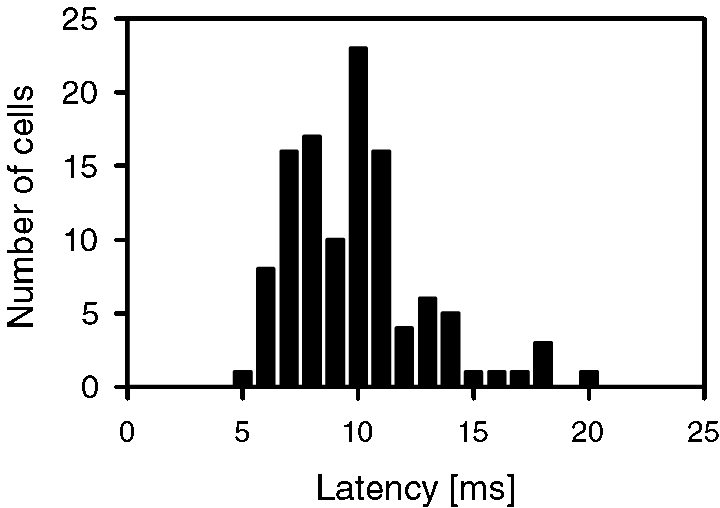
Distribution of response latency in awake rat auditory cortex after pure tone stimulation at 70 dB SPL and BF (n = 113).
Frequency response areas
Frequency response areas were determined from the ON-responses at frequencies between 2 and 76 kHz (0.25-octave spacing) and four different stimulus intensities. Testing other stimuli was not feasible due to experimental limitations (see Material and methods). Significant excitation or inhibition was determined using nonparametric statistics. Characteristics of frequency response areas covered a broad range. Figure 4 shows different types of response areas from seven different cells recorded simultaneously using three electrodes. Different neurons recorded from one electrode had response areas roughly in the same frequency range but often with remarkably different forms. Many cells had more or less classical V-shaped tuned response areas of different width. However, up to three separate subregions could sometimes be seen in cells with more complex tuning (e.g. Fig. 4, electrode 2, upper cell). Close to highly significant responses, response areas could have unresponsive points (Fig. 4, electrode 1, middle cell and bottom cell) or unresponsive areas were surrounded by highly significant responses (Fig. 4, electrode 3, bottom cell).
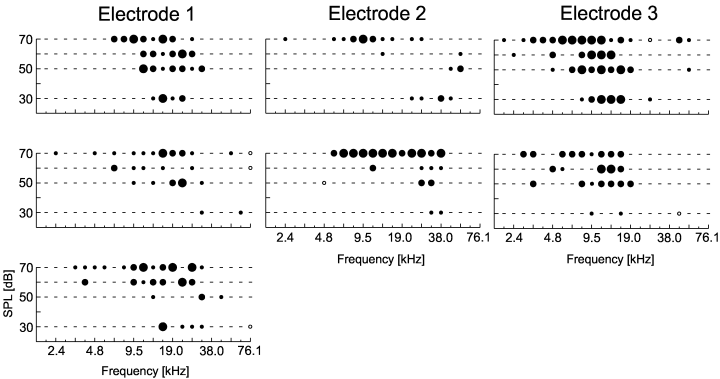
Typical frequency response areas of cells in the primary auditory cortex. Activity of seven neurons was recorded simultaneously from three electrodes. The level of significance of cell responses, as coded in dot size, was determined using nonparametric statistics (see Fig. 1 for details). Distance between electrodes: 1–2, 400 µm; 1–3, 1050 µm; 2–3, 850 µm. Response areas did not only show classical V-shaped tuning, but could also consist of two or three separate subregions (e.g. upper plot electrode 2).
Frequency response areas were considered significant if they met additional criteria that required a minimum number of adjacent points with a certain level of significance. Out of 150 cells 110 (74%) showed significant tuning that allowed us to measure characteristic frequency, minimum threshold, and the size of response area. The number of significant points in a response areas varied between two and 48 (median = 9). Minimal thresholds and CFs covered the whole range tested.
The method to determine frequency response areas, as described above, is different from previous approaches, as it evaluates response variability rather than average firing rate elicited by a given number of stimulus repetitions. Frequency response areas were determined using both approaches in order to test the comparability to data from the literature (Fig. 5). Response areas based on average firing rate were determined as the areas where responses were above the level of mean spontaneous firing rate plus 1 SD. Response areas according to this criterion matched the ones based on MPSR-evaluation in many cases very well. Even small notches in the response areas, as the one shown in Fig. 5D around 8 kHz/60 dB SPL, occurred very often in both types of response areas. This criterion was therefore chosen as the criterion for comparison and not the frequently used ‘mean firing rate plus 2 SD’ criterion, which turned out to be too conservative for this dataset. Overall, response areas were comparable (i.e. less than 15% of stimulus combination inside the response area were classified differently) in the majority of neurons (66%). This, however, depended strongly on the level of spontaneous activity with better match for low activity neurons (neurons with spontaneous rates <10 spikes/s, 81%; 10–25 spikes/s, 61%; >25 spikes/s, 50%). When response areas were not comparable, then the response area according to statistical evaluation was the larger one in most cases (75%), as indicated by the examples in Fig. 5B and D. Larger response areas according to the average firing rate criterion rather than according to MPSR-evaluation were only seen in neurons with low spontaneous activity. In summary, the methods gave well agreeing results for the majority of neurons (approximately 70% of the neurons in this study). Response areas, however, differ for the minority of neurons with high spontaneous activity, as they are mostly found in awake preparations (Gaese & Ostwald, 2001). In these neurons, the coherent regions of elevated activity (as indicated in the top panels of Fig. 5A–D) were more consistently represented in the response areas evaluated using MPSR-statistics (bottom panels in Fig. 5A–D).
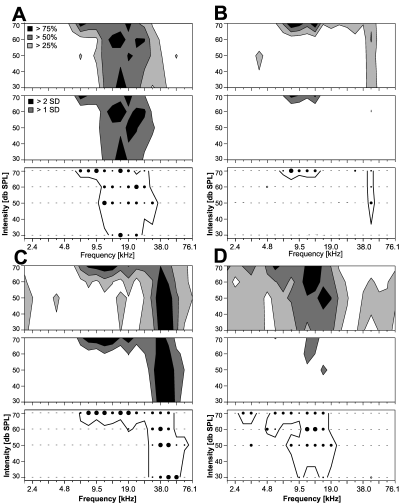
Comparison of different methods to determine frequency response areas. Responses of four neurons (A–D) were analysed in three ways, resulting in three panels for each neuron. Top panel: contour plots of average firing rate normalized to the neuron's maximum response (open regions, <25% of the maximum response; light grey regions, 25–49%; dark grey regions, 50–74%; black regions, >75%). Middle panel: contour plots showing response areas based on average firing rate. The criterion was related to the level of spontaneous activity (dark grey region, > mean plus 1 SD of spontaneous activity; black region, > mean plus 2 SD of spontaneous activity). Bottom panel: plot of response area using statistical evaluation (Wilcoxon's MPSR-test as described in Fig. 1). The different methods were evaluated by comparing the ‘mean plus 1 SD’-response areas (middle panel, dark grey plus black area) with the response areas indicated by the thick line (lower panel). Response areas according to these different criteria could be consistent (examples in A and C) or inconsistent (B and D). Neurons in A and B had low spontaneous rates (A, 5 spikes/s; B, 6 spikes/s), neurons in C and D had high spontaneous rates (C, 30 spikes/s; D, 23.9 spikes/s).
These results indicated possible differences in response strength to tonal stimulation between neurons, depending on their level of spontaneous activity. This was quantified by calculating the ratio between maximum response firing rate and the level of spontaneous activity for neurons showing different levels of spontaneous activity (Fig. 6). This ratio decreased for neurons with increasing levels of spontaneous activity, indicating a reduction in gain for tonal stimulation in these neurons. Taken together, this indicates that the important difference between the two methods for response area evaluation was not between measuring ‘response reliability’ and average firing rate, but between a parametric and a nonparametric evaluation. Factors determining neuronal firing rates vary over a very broad range in neurons in the awake auditory cortex, making it difficult to find a parametric criterion for evaluation of the different neurons at a comparable level. The effect of nonparametric evaluation was most obvious in highly active neurons where stimulation resulted in relatively small increases in firing rate compared to baseline activity.
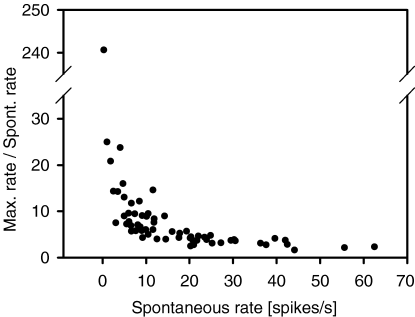
Dependence of the ratio between maximum firing rate to tonal stimulation and spontaneous firing rate on the level of spontaneous activity in rat auditory cortical neurons (n = 63). The ratio is decreasing with increasing spontaneous rate.
Tonotopic organization and local differences in response characteristics
Anatomical data for the rat auditory cortex reveal a topographical organization of thalamic afferents as for most primary cortical areas in sensory systems (Roger & Arnault, 1989). CFs of primary auditory cortical neurons in the anaesthetized rat are represented tonotopically along the cortical surface with an axis of high to low frequencies along the rostrocaudal direction (Sally & Kelly, 1988). Neighbouring cells are therefore expected to have similar response characteristics, at least similar CFs. In the awake rat, however, we noticed that frequency response areas recorded from one electrode sometimes covered rather different frequency ranges (Fig. 4).
As the tonotopic representation of sound frequency is the most prominent principle of organization in primary auditory cortex, one would still expect some systematic change of CFs along tangential electrode tracks. Tracks in this study were penetrating the area roughly in the dorsoventral direction (±20°), thereby going more or less parallel to the iso-frequency lines in the tonotopic arrangement as described in Sally & Kelly (1988). Arrangements of CFs along electrode tracks are shown in Fig. 7 for the three animals with the greatest number of recording sites along a given electrode track. As several neurons with often differing CFs were recorded at most recording sites, a ‘dominant’ frequency for a given recording site was defined as the CF of the neuron (single unit) that was closest to the CF of the simultaneously recorded multiunit activity (background) at this site. The CF of the multiunit and the CF of one single-unit matched closely in most cases. CFs of additional neurons are shown as well (horizontal lines, Fig. 7). The general pattern observed was that the dominant frequencies of recording sites stayed in a restricted frequency range along a track over up to 1500 µm. A general trend towards lower frequencies with increasing electrode depth could be observed for slightly tilted tracks with more and more caudally located recording sites with increasing depth. Vice versa, a tendency towards higher frequencies was observed in tilted tracks with increasingly rostral recording sites. Variation of dominant frequencies in a given electrode track up to one octave occurred in a few cases, which was still small compared to the sometimes observed local differences in CF.
To determine the degree of local variability we calculated the ranges of CF, latency, and spontaneous activity covered by pairs of neurons recorded from one electrode (n = 36 pairs, i.e. recording sites, Fig. 8). CFs differed in 50% of the recording positions by more than 0.25 octave (factor >1.19) and strong differences (factor >2, >1 octave) could be seen in more than 15% of the CF data from one electrode (Fig. 8A). CFs differed maximally by a factor of 4.4. Differences in response latency were usually small (less than 4 ms: 61%). Differences of more than 10 ms occurred only at 8% of the recording sites (range: 17 ms for the whole dataset, Fig. 8B). Spontaneous rates could cover a much broader range at a given recording position. In approximately 27% of the recording positions, spontaneous rates differed by more than a factor of 5 (Fig. 8C, maximum factor 63 for whole dataset).
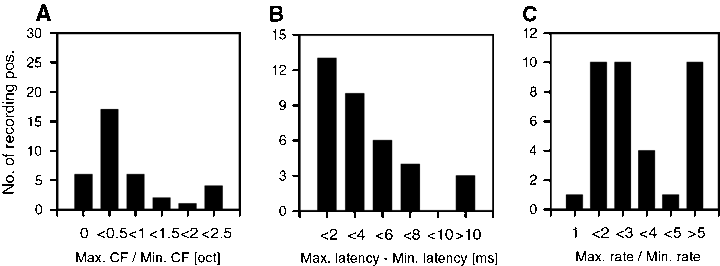
Variation of responses of neighbouring cells in the primary auditory cortex recorded simultaneously from one electrode. The figure shows the distributions of ratio values (max./min. value) or difference ranges of minimal to maximal values of three response parameters from a population of 36 recording sites. (A) CF (characteristic frequency, ratio of max. to min. CF given in octaves); (B) response latency (range between min. and max. latency given in ms); (C) spontaneous activity (ratio of min. to max. firing rate).
Frequency response areas determined using noise stimuli
Frequency response areas are usually determined, as shown above, using pure tone stimuli. Naturally occurring signals, however, are complex in their spectral and temporal structure. It is still unclear to what degree the described response characteristics of central auditory neurons are relevant for the processing of more natural, complex stimuli.
We compared frequency response areas as determined using pure tones to response areas determined using narrow band noise. Both stimulus types have comparable spectral components of only a narrow frequency range, but their psychophysical quality is rather different. As the auditory cortex can be assumed to participate in high-level processes of pattern recognition, one could expect differences in the neuronal representation of these two different stimulus types that would shed some light on the underlying mechanisms of information processing.
Qualitatively, tuning to pure tones and narrow band noise was rather comparable. This was true for small and large response areas (Fig. 9). The data acquired allowed for only limited quantitative comparison, as stimulation parameters differed between pure tone and noise band stimulation (number of test frequencies, different sound pressure levels). CFs of frequency response areas were not significantly different for the two stimulus types (Wilcoxon test: n = 78, S = 171, P = 0.21). The examples shown in Fig. 9 indicate that cells often responded to noise bands at a given SPL with the same level of significance as to pure tone stimulation 10 dB louder. Neurons might be more sensitive to noise band stimulation in general than to pure tones. In spite of the differences noted above, the size of the response areas for a given neuron, as determined by the two different stimulus types, correlated rather well (n = 58, r = 0.70, P < 0.0001). This indicated again, that response areas and frequency tuning were strongly comparable for the two stimulus types. Thus, at this level of investigation, the spectral content rather than psychophysical quality was the prevalent parameter for neuronal activity.
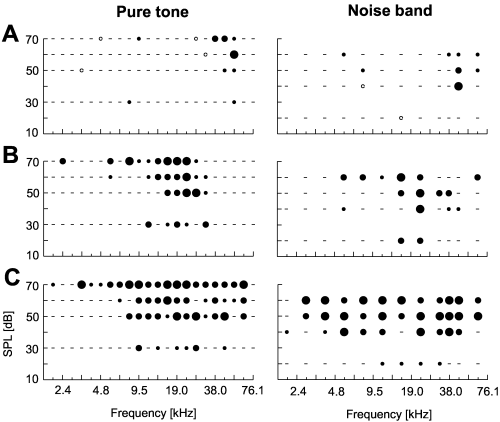
Frequency response areas of three auditory cortical neurons as determined with pure tones (left) and narrow band noise (right). Noise bands of 12 different centre frequencies and four different intensities were applied. ON-responses of the neurons were evaluated using nonparametric statistics. The level of significance is coded in dot size (small, P < 0.05; medium, P < 0.01; large, P < 0.001; for details see Fig. 1). Pure tones and noise band stimulation reveal roughly the same tuning as shown for small (A) or larger (B and C) response areas.
In a second approach we investigated to what extent the frequency response area, as it was quantified here, is relevant for the response behaviour to broadband stimuli. To this end we studied the correlation between the pure tone frequency characteristic at a given SPL, the so called iso-intensity curve, and the response to white noise. If frequency response areas were of importance for the processing of more complex stimuli, neurons that respond to pure tones in a broad frequency range should be strongly excited by white noise. The width of the tuning curve was related to the response to white noise at the same SPL in 137 neurons (70 dB SPL, responses evaluated with Wilcoxon's MPSR-test). Different levels of excitation at different frequencies and the rarely occurring inhibitory responses at this level were not taken into account. The highly significant correlation (Pearson Moment Correlation, n = 137, r = 0.42, P = 0.0001) indicated the importance of the excitatory frequency response area for the processing of more complex signals. Those parts of the response area (e.g. inhibitory responses) that were not included in the analysis seem to play a less important role in the response to broadband stimuli.
Spectrotemporal dynamics of response areas
The frequency response areas described above were only based on the neurons' ON-response, i.e. only activity during the first 20 ms of stimulus presentation was taken into account. In addition, we looked at the spectrotemporal dynamics of responses during stimulus duration, as it is not clear which temporal window is important for cortical information processing, and whether late response components can contribute additional information about the stimulus. Temporal dynamics were analysed in five time windows over a total duration of 100 ms. Activity in each window of 20 ms was quantified, again using Wilcoxon's MPSR-test.
Out of 127 neurons (98 of those with significant tuning) analysed from the awake rat cortex 28 neurons (29% of the tuned ones) showed late excitatory response components (10, 11). In most cases, the frequency response area was strongly reduced in size during stimulus duration. In 17 neurons a frequency response area could only be seen until 40 ms after stimulus onset. This was the case for small (Fig. 10A) or large response areas (Fig. 10B). Interestingly, in some neurons activity around the CF at low but not high stimulus intensity could be seen for a longer time (Fig. 10B).
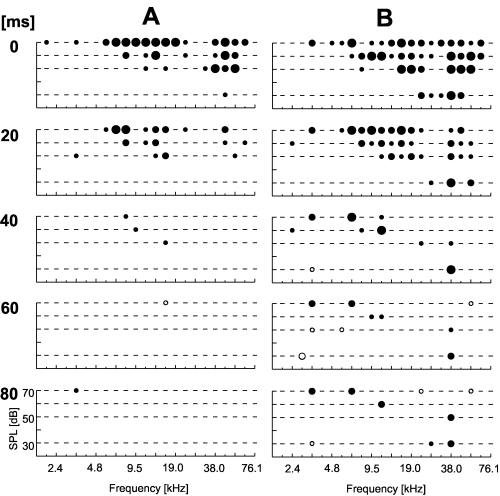
Spectrotemporal dynamics of frequency response areas of neurons in the awake rat primary auditory cortex: short excitatory components. The two examples (A and B) show decreasing response areas over time with consistent response areas only during the first 40 ms of stimulus presentation. Stimulus-induced activity was analysed in five time windows for the whole stimulus duration (0–20 ms, 20–40 ms, etc.). Numbers to the left indicate the start of the window relative to stimulus onset. Each plot comprises the statistical evaluation of stimulus-induced activity as described in Fig. 1. Plots in the first row in this figure are comparable to 1, 4, 9. The level of significance of stimulus-induced excitation (filled circles) or inhibition (open circles) is coded in dot size with highly significant responses marked as larger dots.
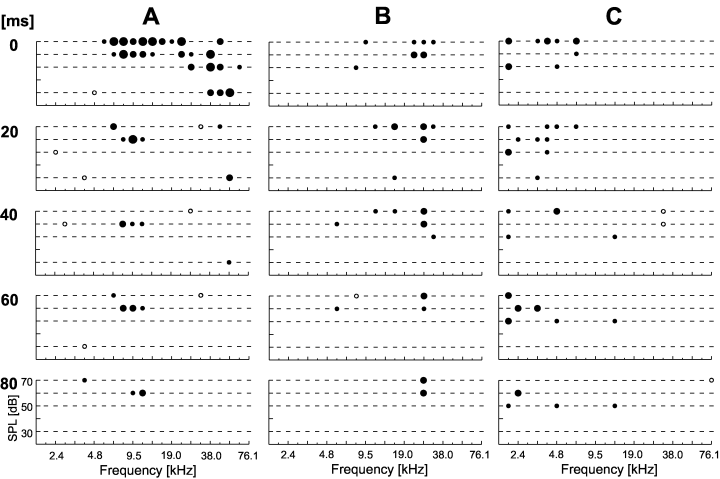
Spectrotemporal dynamics of frequency response areas of neurons in the awake rat primary auditory cortex: long-lasting excitatory components. These could stay in the range around the initial CF (B) or evolve to one side of this initially dominant response area (A). An example of a response area that goes on and off during the stimulus is depicted in (C). Stimulus-induced activity was analysed in five time windows for the whole stimulus duration (0–20 ms, 20–40 ms, etc.). Numbers to the left indicate the start of the window relative to stimulus onset. Each plot comprises the statistical evaluation of stimulus-induced activity as described in Fig. 1. The level of significance of stimulus-induced excitation (filled circles) or inhibition (open circles) is coded in dot size with highly significant responses marked as larger dots.
Neurons with long-lasting excitatory response components are depicted in Fig. 11. The response area was mostly reduced and stayed in the frequency range around initial CF (Fig. 11B), which would roughly correspond to a tonic response characteristic, or in another frequency range that was also dominant in the initial response (Fig. 11A). Figure 11C shows a neuron with a highly dynamic response area. Underlying PSTHs showed indeed a complicated response pattern with tonic responses only at specific frequency/intensity-combination.
Comparing all neurons with dynamic changes in the excitatory frequency response areas revealed that dynamic changes in CF occurred in the range of approximately −4 to +1.5 octaves (Fig. 12A). The larger percentage of decreasing CFs is probably related to the fact that more neurons with high-frequency CFs were included in the dataset. The dramatic dynamics that occurred (change of CF of more than 2.5 octaves towards lower frequencies) were only observed in high-frequency neurons (initial CF above 32 kHz; white bars in Fig. 12A).

Overview of spectrotemporal dynamics of neurons and dependence on parameters derived from the (onset-based) frequency response area. (A) Distribution of neurons that express changes in CF over time (bin width 0.25 octave) during a 100-ms stimulus. Change is given in octaves relative to initial CF. Neurons with CFs above 32 kHz are plotted as a separate class (white bars) to indicate the changes in CF that came from high frequency neurons. (B) Distance of the late (final) CF from the BF of a secondary peak in the initial frequency response area (given in octaves) as a function of the change in CF over time. Note that CF stayed in most cases either around initial CF (i.e. change in CF around 0) or around the BF of a secondary peak (i.e. late CF re second peak around 0). (C) Best frequency of an inhibitory response area (relative to initial CF) as a function of CF. As a tendency, inhibitory response areas are located at the high frequency side from CF for low CFs and are located at the low frequency side for high CFs.
The observed changes in CF over time were not always continuous for a given frequency response area, as secondary peaks beside the prominent one in the initial response area could suddenly become dominant during stimulus presentation (as, e.g. in 11, 10). Especially the larger changes in CF over time are to a large extent related to the existence of such secondary peaks. The secondary peaks (besides the frequency range around CF) in the initial frequency response areas were mainly observed at the low frequency side of CF. Their importance for CF-dynamics was investigated in neurons with secondary peaks and observed CF-dynamics by comparing the change in CF over time to the BF of the secondary peak (Fig. 12B). CF did not change much (stayed around initial CF) in half of the neurons investigated (i.e. along vertical dotted line in Fig 12B, seven of 14 neurons). However, if CF changed more than two octaves during stimulus duration, it changed in most cases to values close to the initial BF of the secondary peak (i.e. along the horizontal dotted line in Fig. 12B, five of 14 neurons). Only two out of 14 neurons did not fit into these general patterns. This indicates that late excitatory components preferably developed from secondary peaks, in the cases where the excitatory component around initial CF had only short duration (i.e. was phasic).
We found late inhibitory components in 23 neurons (23% of the tuned ones), mainly after an initial excitatory response. These inhibitory subregions lasted mostly for a longer time (more than 40 ms) and covered a larger area than long-lasting excitation. They could occur in the frequency range around CF (according to the ON-response; Fig. 13A) or in neighbouring frequency ranges (Fig. 13B and C). They occurred more often on the low frequency than on the high frequency side of the neuron's CF (Fig. 12C). Only few cases showed both excitatory and inhibitory components after the ON-response (Fig. 13C).
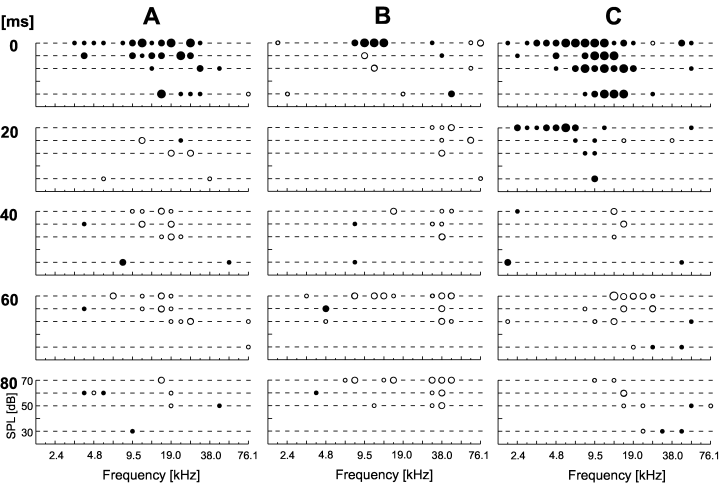
Spectrotemporal dynamics of frequency response areas of neurons in the awake rat primary auditory cortex: inhibitory components. Inhibitory subregions could develop in the frequency range around initial CF (A) or beside this range (B), sometimes together with an excitatory subregion (C). Stimulus-induced activity was analysed in five time windows for the whole stimulus duration (0–20 ms, 20–40 ms, etc.). Numbers to the left indicate the start of the window relative to stimulus onset. Each plot comprises the statistical evaluation of stimulus-induced activity as described in Fig. 1. The level of significance of stimulus-induced excitation (filled circles) or inhibition (open circles) is coded in dot size with highly significant responses marked as larger dots.
As a general pattern, inhibitory components developed rather independent of longlasting excitation. BF of inhibition was mainly located around or slightly below CF (Fig. 12C). This, however, depended on the CF of the neurons: inhibitory components were located preferably on the high frequency side from CF for low CFs and at the low frequency side for high CFs. The BF of the inhibitory component was located between the CF and the BF of a secondary peak in around 30% of the neurons.
Discussion
Representation of sound frequency in the awake rat primary auditory cortex seems to form a more complicated pattern than suggested by previous investigations studying the mechanisms of information processing in the mammalian auditory cortex. In spite of the clear indication for a tonotopic organization, responses of different neurons at the same recording site showed strong differences in frequency response characteristics in several respects. Complex forms of frequency response areas were found in many neurons. Only some neurons exhibited the classical V-shaped tuning mostly found in anaesthetized preparations. Response latencies of neurons found in the awake rat auditory cortex were short, in the range already seen in evoked potential recordings (Shaw, 1987; Shaw, 1990). Comparing the frequency response characteristics of neighbouring neurons sheds new light on the precision of tonotopic organization of the rat auditory cortex.
Tonotopy and differences among neighbouring neurons
The idea of a cortical columnar organization and a clear tonotopical representation of stimulus frequency requires that neighbouring neurons show very similar response characteristics. By separating several neurons recorded in parallel from the same electrode and thereby located in close vicinity we were able to compare their response characteristics.
The tangential penetrations through the auditory cortex in this study were orientated more or less dorsoventrally. They revealed roughly an iso-frequency organization in this direction when multiunit background activity was taken into account besides the single-unit characteristics. The general pattern therefore fit the tonotopic organization as revealed in previous studies (Sally & Kelly, 1988; Kilgard & Merzenich, 1998). On the other hand, neighbouring neurons showed a high degree of variation in their response characteristics and best frequencies. In half of the recording positions, maximum and minimum CFs differed by more than 0.25 octave and CFs differing by more than one octave could be seen in approximately 15% of the recording positions. Data from the awake guinea pig auditory cortex revealed approximately the same degree of local variability (South & Weinberger, 1995). In addition, significant variability was found for minimal threshold and two different measures for tuning width in more than half of the recordings, indicating that the columnar organization of these cortical areas is not as strict as is often assumed. This is consistent with the fact that local groups of auditory neurons are functionally coupled only to some degree (Frostig et al., 1983). As described for the visual system (Arieli et al., 1995), neighbouring neurons in the auditory cortex may be involved in different processing tasks or participate in different ways in stimulus representation.
Methods for response area determination and response variability
We observed some trial-to-trial response variability in the awake auditory cortex, which was different from the situation seen in the rat under anaesthesia (Sally & Kelly, 1988; Gaese & Ostwald, 1995), however, comparable to recordings in the awake auditory cortex of other mammalian species, mostly primates (Brugge & Merzenich, 1973; Winter & Funkenstein, 1973; Manley & Müller-Preuß, 1978). The increase in spontaneous activity in awake compared to anaesthetized preparations, as shown for the rat (Gaese & Ostwald, 2001) was formerly also described in the cat (Katsuki et al., 1959). This increase was seen as a major reason for the reduced detectability of responses to tonal stimuli in the awake animal, and therefore as an important source of response variability (Katsuki et al., 1959; Edeline et al., 1999). Comparing variability of evoked responses across different levels of ketamin/xylazine-anaesthesia in the rat auditory cortex revealed additional nonlinear influences caused by burst events in the background activity (Kisley & Gerstein, 1999).
Response variability, however, seemed not to be the prominent factor influencing determination of frequency response areas. As shown in the comparison of methods to determine response areas (nonparametric evaluation with the MPSR-test vs. increase of average firing rate), the resulting areas were in good agreement for neurons with low levels of spontaneous activity. A difference occurs in highly active neurons as they can be found in the auditory cortex in awake preparations (Recanzone et al., 2000; Gaese & Ostwald, 2001; Kadia & Wang, 2003). As shown here, increasing levels of spontaneous activity did not result in similarly increased levels of stimulus-induced activity. Response classification based on nonparametric statistics was able to detect the small (relative to the level of spontaneous activity) responses to tonal stimulation and gave comparable results over a broader range of activity levels. This is advantageous in awake preparations.
Methods for evaluation used in the auditory system were so far based on the analysis of average firing rate combined with a (parametric) threshold relative to baseline activity (in most cases 2 SD above spontaneous level) that separated stimulus-induced from spontaneous activity (e.g. Davis et al., 1995; Recanzone et al., 2000; Sutter, 2000). Smooth gradients of activity were in these cases achieved by taking into account the activity from neighbouring frequency/intensity-combinations. We did not want to include such a smoothing procedure with the used spacing of test values along stimulus frequency of 0.25 octaves that enabled us to cover also broad tuning ranges. The so far mainly used criterion for significant responses (activity above mean spontaneous activity plus 2 SD) is too conservative for neurons exhibiting higher spontaneous rates, as noted above. A less strict criterion (mean spontaneous activity plus 1 SD) was, on the other hand, well comparable for neurons with spontaneous activity below 10–15 spikes/s.
Complex tuning in the awake auditory cortex
Form and size of frequency response areas in the awake rat auditory cortex varied strongly. Many neurons responded in several separate subregions distributed over a large frequency range. Response areas in the anaesthetized rat mainly showed classic V-shaped tuning (Sally & Kelly, 1988; Phillips et al., 1994). Several former investigations in awake animals, however, gave examples of more complex tuning in cats (Abeles & Goldstein, 1972; Goldstein & Abeles, 1975) and monkeys (Funkenstein & Winter, 1973; Pelleg-Toiba & Wollberg, 1989). A high proportion of neurons with more than one subregion in the frequency response area was recently described for the primate auditory cortex (deCharms et al., 1998). Besides possible differences between studies in recording techniques, unit isolation, etc., a major source for the difference, at least in the rat auditory cortex, is explained by the usage of anaesthesia itself (Gaese & Ostwald, 2001; Gaese, 2001). Response areas were shown to be narrower and simpler under the influence of anaesthesia.
To ensure a reliable and objective determination of response areas in spite of complex tuning and response variability, we used computer-controlled, randomized stimulus presentation and statistical evaluation of neuronal responses. Our approach, however, was limited by the number of different stimulus frequencies (resolution 0.25 octave) and intensities used to determine response areas. We were still able to gather the major form of response areas in most cases. Only a few neurons had response areas that extended to lower stimulus intensities than used in the present study. However, because of this and the missing data at 40 dB SPL we did not include any analysis of minimal threshold in the investigation.
Although we observed some variability in the trial-to-trial response behaviour of neurons, the general pattern of the tuning characteristics was similar when tuning was redetermined using stimuli with comparable spectral composition (pure tones vs. narrow band noise). In general, noise band stimuli evoked slightly stronger neural responses, which might be due to the broader spectral content of noise band stimuli. Noise bands, however, were recently found to be very effective stimuli in several nonprimary auditory cortical areas in anaesthetized monkeys (Rauschecker et al., 1995; Romanski et al., 1999; Tian et al., 2001). Responses to pure tones were almost lacking in these studies.
Responses to white noise stimulation, finally, were well correlated to the width of the excitatory subregions of frequency response areas at the same sound pressure level. These results indicate that the excitatory response area, as determined here, was the neuron's predominant characteristic, relevant also for the processing of other types of acoustic stimuli. Inhibitory subregions are harder to detect and were probably underestimated, at least for neurons with low spontaneous rates. Still, they seem to be only of restricted importance.
Temporal dynamics of tuning
In spite of the relative importance of time as a stimulus-encoding parameter, temporal dynamics of frequency response areas to pure tones has not been much investigated so far in the mammalian central auditory cortex. Early studies already showed several examples for the existence of different components of excitation and inhibition in pure tone responses of primary auditory cortical neurons (Abeles & Goldstein, 1972; Pelleg-Toiba & Wollberg, 1989). Approximately one-third of rat auditory cortical neurons continued to exhibit tuned response areas after the typical ON-response. Most excitatory components did not last for the full stimulus duration (100 ms). Inhibition was usually of longer duration and occurred mainly in frequency ranges outside the range of initial excitatory responses. The general pattern of these dynamics (i.e. duration, number of subregions) is compatible to the only other data provided so far for the awake auditory cortex, where spectrotemporal receptive fields (Aertsen & Johannesma, 1981) were determined using the reverse correlation technique (deCharms et al., 1998). The pattern of discontinuous behaviour, mainly related to persistent secondary peaks in the frequency response area, as it was seen in the awake rat auditory cortex, was not described so far. This is probably due to the fact that analysis of temporal dynamics was usually restricted to the frequency range around CF.
The functional relevance of these dynamics for the analysis of simple stimuli is not obvious (Eggermont et al., 1981). A straight forward mechanism of ‘dynamic sharpening’ was proposed for the encoding of spatial cues in the barn owl, which involves fast narrowing of the response area (Wagner, 1990). However, only a small portion of neurons in the rat auditory cortex is compatible with this interpretation. The general idea that these spectrotemporal dynamics are the basis of neuronal specificity for complex acoustic stimuli was tested by deCharms et al. (1998). Stimuli were applied that followed exactly the spectrotemporal changes of the individual response areas. In many cases these ‘optimized’ stimuli could excite the specific neuron much stronger than simple stimuli, such as pure tones or noise bands without changes in frequency over time (Rauschecker et al., 1995).
Generalization of the spectrotemporal receptive field (usually determined using simple stimuli) to the processing of complex stimuli is limited by the assumption of a linear response behaviour of cortical neurons (Nelken et al., 1997; deCharms et al., 1998). Indeed, linear models were able to explain largely the response behaviour in several cases for either spectrotemporal (Depireux et al., 2001; Miller et al., 2002) or spatiotemporal dynamics (Schnupp et al., 2001). Response behaviour of central auditory neurons was also found to be only partially described by a linear model (Theunissen et al., 2000). Based on the assumption of linearity often only one stimulus intensity (in the case of deCharms et al. (1998) 50 or 70 dB SPL) was used to determine the response characteristic. The data presented here, however, show, e.g. examples of neurons that are responsive to low, but not such high stimulus intensities, indicating that the inventory of complex response behaviour of auditory cortical neurons is far from complete.
Acknowledgements
We are grateful to M. Rosenauer and R. Oberrath for excellent help with computer programming and data analysis, and to H. Luksch for comments on previous versions of the manuscript. This work was supported by the DFG.
Abbreviations
-
- BF
-
- best frequency
-
- CF
-
- characteristic frequency
-
- PSTH
-
- peristimulus time histogram.


