Type III intermittency in human partial epilepsy
Abstract
A rigorous characterization of the dynamic regimes underlying human seizures is needed to understand, and possibly control, the transition to seizure. Intra- or extracranial brain electrical activity was recorded in five patients with partial epilepsy, and the interictal and ictal activity analysed to determine the dynamics of seizures. We constructed first-return one-dimensional maps by fitting the scatter plots of interpeak intervals. The features of the mapping indicated that type III intermittency is the dynamic charateristic of the ictal events. This was confirmed using histograms of the durations of the regular phases during seizures. The intermittent regime explains the abrupt transitions observed during ictal events in terms of transient stabilization of the unstable steady state.
Introduction
Abnormal hypersynchrony of the spike firing of neurons in large assemblies is a major characteristic of seizures. The transition to seizure, in particular the sudden start and end of the ictal events without external triggers, a feature of most human epilepsies, has not been addressed so far in a rigorous manner. While specific molecular mechanisms that could participate in seizures are being intensively investigated in both in vivo and in vitro seizure models ( Dichter 1989; McNamara 1994), the global dynamics of the transition to seizure have been little studied. The development of the theory of nonlinear dynamics offers new avenues to address the dynamics of the activity of very complex sytems, such as the neuronal networks of the mammalian brain. This theory provides powerful tools to gain insight into the dynamic behaviour of dissipative, nonlinear systems, which have been extensively used to analyse rigorously dynamic transitions in a variety of physical systems, from turbulence in hydrodynamics ( Lorenz 1963; Pomeau & Manneville 1980) to biochemical processes ( Moran & Goldbeter 1984; Decroly & Goldbeter 1987). Application of the most traditional techniques, such as Fourier decomposition, to the description of the evolution of the brain dynamics rely on the paradigm that temporal variations are decomposable into periodic components, and in general these methods do not offer an adequate portrayal of dynamic transitions in systems exhibiting complex, possibly chaotic, dynamics. Thus, it is not surprising that there is an increasing interest in the application of analytical methods taken from nonlinear dynamic theory to the study of brain function ( Rapp et al. 1985 ; Babloyantz & Destexhe 1986; Pijn et al. 1991 ; Schiff et al. 1994 ; Iasemidis & Sackellares 1996; Braun et al. 1997 ; Elger & Lehnertz 1998) These studies have generated an enormous amount of data, sometimes very controversial ( Theiler & Rapp 1996; for an excellent review see Rapp 1994), and have provided an interesting interpretation of the global dynamics of specific brain functions ( Skarda & Freeman 1987).
The abrupt transitions observed during ictal events recorded in most cases of human epilepsies suggest a particular dynamic mechanism, namely intermittency, underlying the dynamics of seizures. Intermittency is present in nonlinear systems and is characterized by periods of regular, almost periodic, behaviour of variable duration, interrupted by chaotic bursts ( Pomeau & Manneville 1980; Berge et al. 1984 ). Intermittency has been demonstrated in EEG burst suppression based on histograms of the duration of the regular phases ( Rae-Grant & Kim 1994) and has been proposed as a possible mechanism for seizures ( Iasemidis & Sackellares 1996). Most dynamic studies of human EEG activity have involved time series analyses to extract correlation dimension or Lyapunov exponents, methods that have many limitations when applied to biological data ( Theiler 1986; Rapp 1994; Theiler & Rapp 1996). Our study aimed at identifying the dynamics of human seizures in a rigorous manner, based on quantitative mathematical analyses that do not have data requirements as stringent as the methods mentioned above. We studied 24 seizures in five patients suffering from intractable partial epilepsy. The approach we followed was the construction of one-dimensional first-return maps by approximating the scatter plots for interpeak intervals (IPI) during ictal and interictal epochs with a nonlinear equation. The results indicate that type III intermittency underlies the dynamics of seizures.
Materials and methods
EEG recordings
Intracranial EEG recordings were performed with subdural or depth electrodes in four patients, one with epilepsia partialis continua of the postcentral gyrus (five seizures), two with mesial temporal lobe epilepsy (12 seizures), and one with symptomatic secondary generalized epilepsy (one seizure with the recording depth electrodes located in the thalamus in this case). In addition, extracranial EEG recordings were taken from another patient with post-traumatic secondary generalized epilepsy (seven seizures). The recordings analysed were taken from within the epileptogenic focus and adjacent areas. The continuous EEG signals were digitized at 200 Hz (Stellate Systems, Montreal, Canada).
Analysis of data and construction of one-dimensional maps
Analysis of power spectra and curve fitting were performed using SANTIS (Biomedical Systems Analysis, Inst. Physiology, RWTH, Aachen, Germany) and Origin (Microcal Software Inc., Northampton, MA, USA) software packages. When needed, seizures were divided into several episodes of variable duration (3–30 s). IPIs were obtained from the digitized recordings using a peak-detection algorithm that selects peaks based on amplitude and width criteria determined from the characteristic of the specific recording. Scatter plots of the IPI values were constructed by plotting one IPI against the next [IPI(n) versus IPI(n + 1)], a first-return mapping function was obtained by approximating the scatter plot to a one-dimensional nonlinear equation. Histograms of the duration of the regular, or almost periodic, phases during ictal events were constructed by counting the number of occurrences with a given duration (within a certain time window depending on the seizure). Phase differences between two channels within the epileptic focus were obtained from the ratio (T2 – T1)/T2, where T2 and T1 are the periods between two peaks in channels 2 and 1, respectively ( Rinzel & Ermentrout 1989; see also our Fig. 4 below).
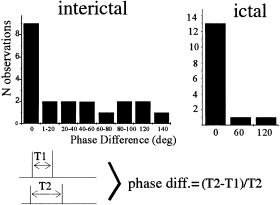
Histograms of the phase differences between the peaks recorded in two channels within the epileptogenic focus. Left, histogram corresponding to the interictal period 5 min before the seizure. Phase-locking (zero phase difference) occurrences were the most abundant, but there is a spread distribution indicating relative coordination. Right, 10 s within the ictal event the phase-locked modes are predominant, suggesting the stabilization of the entrained mode or fixed point in the return map. Sketch at the bottom depicts the estimation of the phase difference between peaks recorded in two channels, T1 and T2 are the periods. To obtain the final values in degrees used for the histograms, 360 ° was multiplied by the ratio (T2 – T1)/T2.
Results
Type III intermittency during partial seizures
The abrupt start and end of most seizures, like the different durations of periodic activity during the ictal events, suggests a dynamic regime characterized by intermittency. A common method to determine the presence of intermittency is the study of the distribution of the durations of the regular, or almost periodic, phases ( Berge et al. 1984 ; Kelso & Ding 1993; Rae-Grant & Kim 1994). Two histograms of the duration of the regular phases during ictal events, from one patient with neocortical and one with hippocampal seizures, are shown in Fig. 1. There is a large number of short-duration periodic phases with infrequent long duration events, characteristic of type III intermittency ( Berge et al. 1984 ; Rae-Grant & Kim 1994). Similar histograms were obtained for all 24 seizures from the five patients.
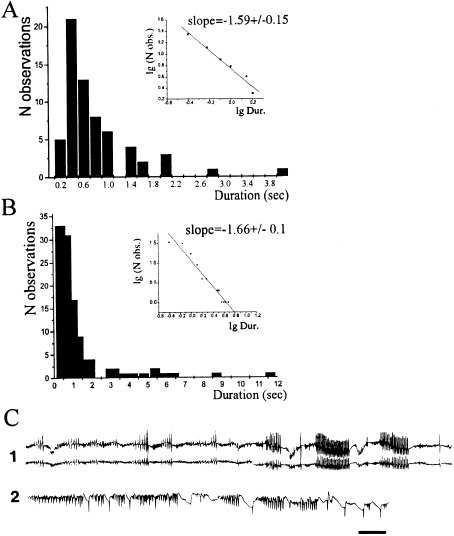
Histograms of the duration of the regular phases during ictal events reveal type III intermittency. (A) Histogram corresponding to four seizures from a patient with epilepsia partialis continua. (B) Histogram constructed using six seizures from a patient with mesial temporal (anterior hippocampal) epilepsy. A significant feature of both histograms is the long tail for increasing time lengths, characteristic of type III intermittency. The insets show the logarithmic plots for the histograms, to determine the power law exponent from the slope value; exponents near –1.5 are characteristic of type III intermittency. (C) Two representative ictal recordings are shown to illustrate the pattern observed in the histograms, a large number of short, almost periodic, phases and a few of long duration. Two channels are shown for traces labelled as 1, corresponding to bipolar extracranial recordings from a patient with post-traumatic secondary generalized epilepsy, and 2, corresponding to a single channel of intracranial EEG from the patient with epilepsia partialis continua. Scale bar, 1 s.
Another indication of this type of phenomenon is that the distribution function of the regular periods decays for increasing duration with a power-law dependence on duration, with a short-time duration power-law exponent of –3/2 ( Berge et al. 1984 ; Rae-Grant & Kim 1994). To determine the exponent of the decay of the distribution shown in the histograms, we created logarithmic plots for each histogram plot (n = 24 seizures). Two examples are shown in the insets of Fig. 1. The average exponent for 24 seizures for five patients was –1.46 ± 0.42, within the experimental range of the theoretically predicted –1.5, again indicative of type III intermittency.
One-dimensional first-return maps of interpeak interval plots reveal type III intermittency
While we found evidence for type III intermittency from the histograms of the lengths of the almost periodic phases, as shown above, we sought to assess the presence of this type of phenomenon quantitatively using the theory of intermittent transitions ( Pomeau & Manneville 1980).
The data used in this study are in the form of time series, i.e. intervals between peaks (EEG spikes) encountered in the EEG recording. Interictal periods and seizures were divided into several episodes of variable duration (3–60 s), and IPIs were determined for each episode. Then, first-return maps were constructed by plotting one IPI against the next (see Methods for details). The resulting IPI scatter plots showed different geometries before and during seizure progression, correlating with power spectral analyses and indicating a transition from aperiodic or quasiperiodic to simpler dynamics ( Fig. 2). We approximated the scatter IPI plot with a nonlinear equation, as shown in Fig. 3, and studied the properties of the first-return one-dimensional map obtained. We chose the plot in Fig. 2(B) (from the recording 1 min before the transition to generalized seizure in a patient with epilepsia partialis continua) for the curve fitting procedure, because it closely resembles a continuous function, suggesting that the points are distributed along an underlying curve that can be approximated by a one-dimensional return map F: IPI(n + 1) = F{IPI(n)}. The three parameters of the mapping, a, b and c ( Fig. 3), are linked to the frequencies of the peaks. However, a more specific interpretation of these parameters is difficult because we do not have a model that simulates the system.
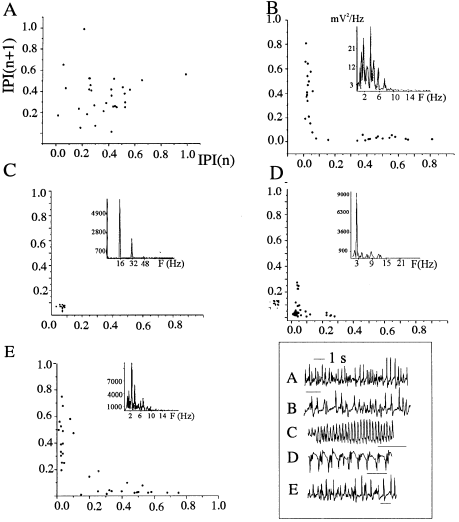
First-return interpeak interval (IPI) scatter plots during interictal and ictal activity in a patient with epilepsia partialis continua. Each IPI (in seconds) was plotted against the next (see Methods) for 50 s during interictal activity 24 h before the seizure (A), 1 min before the seizure (B), the first 4 s of the seizure (C), 8 s at the end of the seizure (D) and 15 min after the ictus (E). The insets in B, C, D and E represent the power spectra. The panel at the bottom right shows part of the EEG recordings used for the creation of the respective plots.
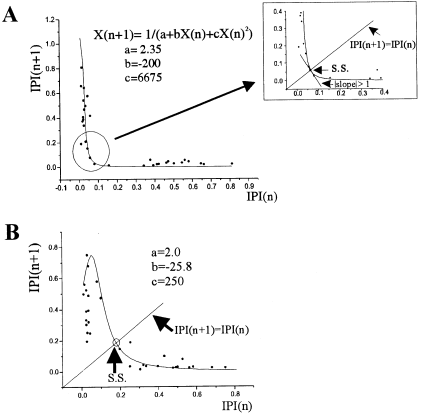
One-dimensional first-return maps for the IPI scatter plots for the interictal activity 1 min before the seizure (A) and 15 min after the seizure (B). The scatter plots were approximated by the equation shown. Top inset in A shows a magnification of the graph (circle) to illustrate the steady state (s.s.) at 0.063 s, at the intersection of the map with the diagonal (the identity map: IPI(n + 1) = IPI(n)), and the value of the slope at that point, absolute value > 1 (see Results for quantitative details). (B) Approximation of the scatter plot for the interictal activity 15 min after the seizure, the steady state was in this case ≈ 0.18 s (5.5 Hz).
Some features of this map can be noted, as they represent the transition to the seizure. Application of the tools for the analysis of one-dimensional maps ( Collet & Eckmann 1980; Guckenheimer et al. 1983 ) reveals that there is one fixed point, or steady state (simple periodic behaviour), at the intersection of the map and the identity map, the 45 ° line (bisectrix), where IPI(n + 1) = IPI(n). This fixed point can also be obtained by solving analytically the equation of the map for IPI(n + 1) = IPI(n), which yields the value 0.063 s for the IPI (16 Hz). The slope of the map at the fixed or singular point determines its stability: in our case it can be analytically determined by solving dF/dx at the fixed point x = 0.063, the value being –2.4. Since, in absolute value, the slope is > 1, the fixed point is unstable. Close to the fixed point the slope is –1, the precise point is determined by solving dF/dx = –1, which yields the value for IPI(n) of 0.0805 (12.5 Hz). A slope of –1 is associated with a flip bifurcation ( Guckenheimer & Holmes 1983; Berge et al. 1984 ) also referred to as subharmonic bifurcations, which can give rise to two types of phenomena: the period-doubling route to chaos, or type III intermittency.
Intermittency takes place in the neighbourhood of a fixed point, in this case the singular point was determined at 0.063 s as mentioned above, corresponding to a frequency of 16 Hz. Interestingly, the power spectral density of the first 15 s of the ictal event reveals a main peak at 15–17 Hz ( Fig. 2C), suggesting that the unstable fixed point becomes stable for a short time at the beginning of the seizure.
The IPI scatter plot for the interictal activity 15 min after the seizure ( Fig. 2E) was also approximated by our one-dimensional first-return mapping, and the properties of this map ( Fig. 3B) were similar to the mapping discussed above. The slope at the fixed point, in this case at 0.18 s (5.5 Hz), is –2.1, i.e. > 1 in absolute value, thus indicating an unstable point. Close to this point there is another at which the slope equals –1, which indicates a bifurcation via type III intermittency ( Berge et al. 1984 ). This IPI is solved for dF/dx = –1, and yields two real roots, 0.055 and 0.23 s, the latter corresponding to 4.3 Hz. We find that the main frequency for the activity during the last 8 s of the ictal event, 3–4 Hz (power spectrum in Fig. 2D), is close to the point at which the slope is –1 (4.3 Hz), indicating the transient stabilization of the saddle-node for the mapping. Thus, we find a phenomenon similar to that which occurred at the beginning of the seizure.
Intermittency and phase-locked modes: the progression of the seizure
The intermittent theory of relative coordination, proposed by Kelso (1995; Kelso & Ding 1993), predicts that the phase differences in the coordination dynamics will be spread out, with a larger number around phase-locked modes (no phase difference) in systems exhibiting intermittency. To determine phase relations during the interictal and ictal periods, we compared the phases between two EEG channels located within the epileptic focus of the patient with epilepsia partialis continua, and the phase differences were determined as specified in the Methods section (see also Fig. 4). Clear brief periods of phase-locked modes (absolute coordination) can be seen by comparing the recordings from two channels within the epileptogenic focus. However, the spread-out distribution of the phase differences shows relative coordination, as depicted in Fig. 4, most clearly during interictal periods.
The first-return IPI plots provide insight into the dynamic evolution of the seizure within the framework of intermittency and relative coordination. The phenomenological interpretation of the analyses performed provides the general picture for the transition to secondarily generalized seizure in the patient with epilepsia partialis continua: some time before the seizure ( Fig. 2A) the dynamics may be quasiperiodic or possibly chaotic. A bifurcation via type III intermittency heralds the beginning of the seizure, the saddle-node or unstable fixed point at ≈ 0.063 s (16 Hz) becomes stable for 15 s at the beginning of the ictal event ( Fig. 2C, the duration of the seizure was 43 s). As the seizure progresses the steady state loses stability and other frequency components emerge, as indicated by the presence of three clusters of points in Fig. 2(D) and the power spectrum, towards the end of the ictus. Finally, the fixed point loses stability and vanishes, the seizure ends and the activity becomes apparently irregular ( Fig. 2E).
Discussion
The data gathered in this study demonstrate quantitatively, for the first time, a particular dynamic regime, type III intermittency, during human epileptic seizures. The approach we followed, constructing a first-return one-dimensional map for IPI scatter plots, represents a novel approach to human EEG recordings, and it helped us to elucidate the underlying dynamics of the transition to seizure in epilepsia partialis continua, as well as the transitions observed during a variety of human seizures recorded from neocortical, hippocampal and subcortical structures.
Intermittent regimes are characterized by regular, or almost periodic, behaviour which is present for varying periods of time ( Pomeau & Manneville 1980), these regular phases being interrupted by phases of turbulence, possibly chaotic. Intermittency is present only in nonlinear systems, where the transitions between periodic, quasiperiodic, or chaotic regimes occur without external triggers, even though very small (undetectable) perturbations may be needed for the stabilization of particular dynamic regimes, which is the basis for the hypothesis that seizures can be controlled ( Schiff et al. 1994 ). Hence, intermittency may explain the nature of most human epilepsies, where the ictal events start and end abruptly without external influences. We obtained evidence for a type III intermittent regime from the mathematical properties of the first-return one-dimensional map as well as from histograms of the duration of the regular phases during seizures and the exponential decay of the distribution of these durations.
Because intermittency takes place near a steady state, or fixed point, we were interested to determine the presence of a steady state in the system’s activity, which represents a phase-locked mode or periodic oscillation, by constructing a first-return one-dimensional map. The dissipative nature of brain activity justifies the use of one-dimensional maps, which represent the essential dynamic properties of the system that can be found by approximating the plot to an equation (mapping) and then iterating this map F according to X(n + 1) = F{X(n)} ( Berge et al. 1984 ). These maps, pioneered by Poincare and Lorenz in physical systems and subsequently used to rigorously determine the dynamics in other systems ( Pomeau & Manneville 1980; Berge et al. 1984 ; Decroly & Goldbeter 1987) allow for a discrete representation of the original system that simplifies mathematical study, since difference equations are easier to handle than differential equations ( Collet & Eckmann 1980). In this study, the first-return IPI plot just before the seizure in a patient with epilepsia partialis continua was approximated by a nonlinear one-dimensional mapping and an unstable steady state was found at 16 Hz, coinciding with the frequency of the activity at the beginning of the seizure which we interpret to be the manifestation of the transient stabilization of the entrained phase-locked mode that results in the ictal event.
The classification of intermittency into types I, II and III is based on criteria about linear stabilities of periodic trajectories ( Berge et al. 1984 ). An important characteristic of the type III with regards to brain dynamics, is that the nonlinearities present in the system tend to augment the instability of the successive iterates for a mapping in the neighbourhood of the steady state. This can be interpreted as an intermittent stabilization (within the seizure) and destabilization of a particular phase-locked state represented by the fixed point (steady state) in the first-return mapping as discussed above.
Intermittency has been found in human perception ( Kelso & Ding 1993; Kelso 1995), and type III in particular in EEG burst suppression ( Rae-Grant & Kim 1994). Such systems occupy a position near phase-locked states, manifestations of the saddle-node point in the mapping, which, in general terms, represents a stable-unstable state. When the saddle-node vanishes there is loss of entrainment and the coordination dynamics stays near the previously stable fixed point, a phenomenon described as relative coordination. This is what we see in the histograms of Fig. 4, which contain all possible phase difference values but concentrate around the fixed point. Intermittency and relative coordination afford greater flexibility for the system’s activity.
An idea that emerges from these results and concepts is that the activity of neuronal networks may possess several saddle-nodes or unstable steady states, and that transient stabilization of these states manifests as synchronous oscillations in brain rhythms, sometimes with pathological consequences as occurs in epilepsy. Because intermittency involves chaotic bursting which interrupts regular periods, these results add some evidence that instances of chaotic regimes may occur, at least during seizures ( Babloyantz & Destexhe 1986; Iasemidis & Sackellares 1996). In summary, this type of analysis, combined with other nonlinear analyses for seizure prediction ( Lehnertz & Elger 1995; Scott & Schiff 1995; Elger & Lehnertz 1998), provides important insights into the intricacies of brain dynamics and the transition to seizure. This approach will improve techniques to control the transition to seizure.
Abbreviation
-
- IPI
-
- inter peak interval


