Quantifying observer heterogeneity in bird counts
Abstract
An essential pilot study was designed to quantify observer heterogeneity and to compare observation methods for the detectability of forest birds in stands of Eucalyptus and Pinus radiata forest as a basis for a major research project on habitat fragmentation near Tumut, southern New South Wales. Twelve experienced observers participated in the investigation. Point interval counts, zig-zag walks and strip transects were used to count birds in both eucalypt and pine forests. The 65 species of birds recorded in the study were assigned to one of nine groups classified by a set of attributes that characterized bird detection by field observers (e.g. body size, colour and calling patterns). Observer heterogeneity varied between groups of birds and was most apparent for small birds foraging in low shrubs (species such as the white-browed scrub wren, assigned to group 2), frequent calling, active birds (species such as the golden whistler, assigned to group 7), and midstorey, undercanopy foragers with distinctive behaviour (species such as the grey fantail assigned to group 4). For bird groups 2, 4 and 7, additional variability due to observer differences resulted in an average increase of ~ 40% in the width of a 95% confidence interval for the logarithm of bird abundance generated from a 20 minute count. Our analysis shows that taking the average of counts obtained by two or more observers would negate the increase in variance of counts due to observer heterogeneity. Few differences between methods of field observation were found. However, for frequent calling, active birds (group 7) there was evidence that more birds were heard using the point interval count method. Our study clearly demonstrated a need to either control for observer differences or to assign at least two observers to individual sites when designing bird surveys for comparative studies. Failure to do so will result in a decrease in precision of bird counts.
INTRODUCTION
A substantial literature shows that counts of birds can vary considerably as a result of the observation methods employed (e.g. Loyn 1980; Recher 1984, 1988; Ralph et al. 1997) as well as variations in the area and/or time searched using a given method (Er et al. 1995). It is also well known that counts of birds can be strongly affected by levels of observer skill (e.g. Morin & Conant 1994; van der Meer & Camphuysen 1996). For example, sea-bird surveys in the North Sea that did and did not account for observer effects resulted in estimated population sizes of fulmars (Fulmarus glacialis) of 3.5 million and 1.8 million, respectively (van der Meer & Camphuysen 1996). Failure to quantify and incorporate observer effects can lead to controversy over the interpretation of data gathered by multiple observers (Link & Saur 1997 cf. McCulloch et al. 1997) and potentially important findings can be masked by increased variance. This can limit the value of such data (Link & Sauer 1997). For example, ignoring observer effects may lead to questionable conclusions about the magnitude of changes in populations of birds (James et al. 1996; Link & Sauer 1997) resulting in poor management decisions and the inappropriate allocation of scarce conservation resources.
In studies where multiple observers are required, it is often not possible to account for observer differences by statistical modelling. This introduces an additional source of variability into observations. It follows that knowledge of the magnitude of observer effects is important. It provides a basis for designing field studies so that a reduction in error, and hence an increase in power, can be achieved. Indeed, such work may become increasingly important as contributions from multiple observers (e.g. various atlases of distribution records: Blakers et al. 1984; Saunders & Ingram 1995) are being used more frequently in assessing large-scale effects and long-term trends in bird populations (e.g. James et al. 1996).
Relatively few Australian studies have attempted to quantify the magnitude of observer effects (but see Kavanagh & Recher 1983; Pyke & Recher 1985). In this study we present the findings of a field-based experiment designed to quantify observer effects on bird counts in native eucalypt and exotic softwood forests of southeastern Australia. Rather than examine particular species, our focus is on broad groups of birds that share similar attributes relating to detectability (e.g. size, colour and voice characteristics). Thus, we identify those groups for which observer heterogeneity is important and the extent of such effects. In addition, we contrast counts using different observation methods [point interval count (sensuPyke & Recher 1983), zig-zag walk and straight transect] in stands of Eucalyptus and Pinus radiata forest. Some implications of our findings for bird surveys are briefly discussed.
METHODS
Study area
The field experiment was completed in late October 1996 in the Buccleuch State Forest near Tumut, southern New South Wales (148°40′E, 35°10′S). Twelve sites were selected; six in a radiata pine (Pinus radiata) plantation and six in Eucalyptus forest dominated by 30–40 m tall manna gum (Eucalyptus viminalis) and narrow-leaved peppermint (Eucalyptus radiata). The areas of eucalypt forest were typically a mixture of large old trees and younger (30–50 years old) regrowth stems with an understorey comprised of Bedfordia arborescens, Acacia spp. trees, Cassinia spp., and a range of other shrub species. The six sites in P. radiata forest were 10–15 years old and had yet to be thinned. The dominant trees in these stands were ∼20 m tall and supported little or no ground or shrub-storey cover except for occasional Cassinia spp. stems. Detailed vegetation surveys completed as part of another major investigation in the study area (Lindenmayer et al. 1999) indicated there was considerable similarity in vegetation structure and plant species composition across the different eucalypt sites, and across the six P. radiata sites. Relatively uniform vegetation on the P. radiata and eucalypt sites, respectively, helped reduce between-site variations in the range of bird species likely to occur in the two forest types. Logistics dictated that all 12 sites used in our experiments be located within an area of ∼9 km2. This facilitated the movement of observers between study sites and minimized asynchrony of sampling times.
Site preparation and field counting protocol
Each of the 12 sites commenced at the edge of a gravel road and followed a set compass bearing into the forest. The sites were prepared for counting by setting out a 400 m line of coloured flagging tape which guided observers along the strip transect. A total of four transect counts of equal length was completed during each counting event; 0–100 m, 100–200 m, 200–300 m, and 300–400 m. Five minutes were allocated for counting birds along each of the four 100 m segments. Flagging tape of a different colour was used to mark the 50 m, 100 m, 150 m, 200 m, 250 m, 300 m, 350 m and 400 m points along each flagged transect. The 100 m, 200 m, 300 m and 400 m stations were the locations for the point interval counts. Birds were counted for five minutes at each location for the point interval counts. Two additional 400 m long lines of flagging tape were set out 50 m either side of the 400 m long main transect line. These additional flagged lines marked the boundaries of each survey site and the limits of the area within which the zig-zag walk was employed. A total of four counts using the zig-zag walk method was used to record birds on a given site. These were of equal length and took place around the 0–100 m, 100– 200 m, 200–300 m, and 300–400 m sections of the flagged line. For each 100 m segment of the zig-zag walk, observers tracked a 100 m long path from the 0 m point on one of the flagged boundary lines to the 100 m point on the opposite boundary line passing through the marked 50 m station on the main transect. This procedure was repeated as observers passed through the 150 m point on the main transect as they traversed from the 100 m point to the 200 m point on the opposite boundary line. Five minutes was allocated to count birds within each 100 m segment of the zig-zag walk. Thus, the time spent counting birds (20 min) was identical for the strip transect, point interval count and the zig-zag walk.
Experimental design
Twelve experienced observers from the Canberra Ornithologists Group participated in this study. Each observer surveyed three of the six sites in P. radiata forest and three of the six sites in Eucalyptus forest. A given observer completed three surveys in a given forest type before switching to the other type of vegetation. Each observer used a different observation method for each of the three P. radiata sites and each of the three Eucalyptus sites. Thus, each observer employed each bird observation method twice; once in P. radiata forest and once in Eucalyptus forest. Each observer completed a survey of one site on any given day, requiring six days to complete data collection. Assignment of observers to sites, day and method was achieved by use of a series of Graeco–Latin squares (Cochran & Cox 1956). This ensured that within the groups of three observers and three sites over three days, all effects were balanced with respect to each other. All surveys were completed between 1430 and 1600 h and were restricted to warm, humid afternoons characterized by sunshine and intermittent cloud cover. Afternoons with similar climate conditions were surveyed to reduce random effects between sampling days due to large differences in weather conditions (Slater 1994). Bad weather forced cancellation of fieldwork scheduled for Day 5. Because the same group of observers were available for a limited time, this meant the design was incomplete resulting in some confounding between observers, sites and method effects. However, this incomplete design still has high statistical efficiency and confounding between fixed and random factors was low (< 10%). Statistical efficiency is measured by comparing the variance of the incomplete design with that of the full design (Mead 1988).
Observers recorded the numbers of each species of bird detected by sight and/or hearing for their assigned site and method.
Preliminary data analysis and statistical methods
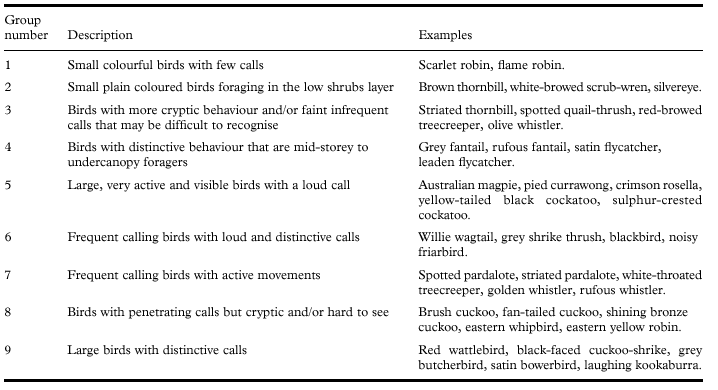
A total of 65 species of birds was recorded in the experiment. In this study we focused on the ‘detectability’ of birds, rather than the more traditional functional or guild-type attributes. The seven attributes that we considered likely to influence the chances of a bird being detected by sight or sound were: body size, the quality and distinctiveness of calling, loudness of calling, frequency of calling, colour of plumage, behavioural patterns, and foraging height. Expert assessment rated each of these detectability attributes on a scale 1, 2 or 3. A final classification comprized of nine groups of birds was produced by examination of the two-dimensional configuration of points representing the 65 species derived by a Principal Component Analysis of the seven detectability scores together with expert opinion. General attributes of each of these groups, as well as a few of the taxa representative of each one, are set out in Table 1.
As multiplicative effects seem more plausible than additive effects in our experiment, the response variable for statistical analyses was the logarithm of the aggregate abundance of birds counted in each of the nine groups. Observer effects were considered to have been randomly drawn from a pool of expert observers. That is, observer differences were treated as contributing to the variance of counts rather than as a bias in the mean count. Assessment of the significance or otherwise of observer random effects involved estimating the observer component of variance and calculating a likelihood-ratio-based test statistic (Robinson 1991). An analysis of variance table showing the structure of variance decomposition (i.e. the model) for group 7 birds detected by hearing is given in Table 2. Inferences relating to forest type effects are based on estimates of site variation within the two broad types of forest in our experiment so caution is needed in interpreting the results. However, this lack of effective replication is not so important here because an assessment of these effects is incidental in this study. Estimates of variance components and fixed and random effects were obtained by a general method of estimation known as restricted maximum likelihood (REML) (Robinson 1991). Patterns of observer variability across groups were explored by Principal Components Analysis of observer effects.
Examination of residuals following an initial analysis provided a check of the compatibility of the model and data. Counts were low for some bird groups, and in these cases the results have not been reported as the usual distributional assumptions necessary for valid statistical inference are unlikely to be met.
RESULTS
Hearing data
Considerable information was gathered for detections of birds by call but sight records were substantially more limited. Therefore, most of the results outlined below relate to detection by call.
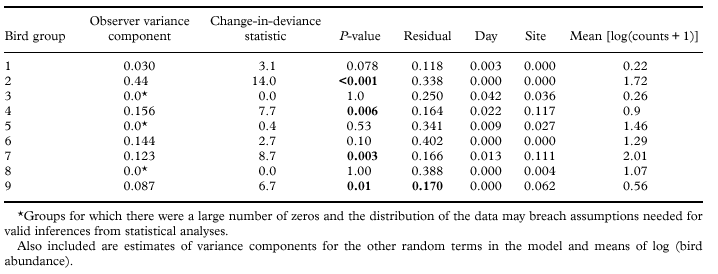
Observer components of variance (a measure of heterogeneity) were significantly (P < 0.05) different from zero for groups 2, 4, 7 and 9, but not for groups 3, 5 and 8. For groups 1 and 6, there was some evidence of observer heterogeneity although this was not statistically significant (P < 0.10). Variance components and associated change-in-deviance statistics are given in Table 3.
For a given site on a given day the variance of the logarithm of the count of the number of birds heard in 20 min is: s2 + s20, where s2 and s20 are estimates of the residual ‘observation’ variance and the observer variance, respectively. Under the assumed model that observer effects are Normal with variance s20, an approximate 95% confidence interval (CI) is given by: ± 2 ×√ (s2 + s20).
With the exception of group 9, for bird groups for which there was significant observer heterogeneity, the observer component of variance was approximately the same magnitude as the inherent observation variance (Table 3). Thus, observer heterogeneity increased the width of the confidence interval of the logarithm of the number of birds heard by ∼40%. For group 9 this will be conservative. It follows that if two observers were to count birds on a given site, the variance of the average of the log counts of the two observers will be roughly equivalent to that obtained by a single observer, if there were no observer differences.
It should be noted that observation error is ∼45% of the mean for groups 1, 4 and 7 and around 85% of the mean for groups 2, 5, 6 and 8 (Table 3). Thus, relative error remains reasonably large even if two observers are used. To increase the precision of counts, more than two observers are required. Day and site components of variance are consistently small relative to observation variance (Table 3).
A scatterplot matrix in Fig. 1 contains pairwise graphs of observer effects for all groups except groups 3, 5 and 8 for which observer heterogeneity was not statistically significant. A high value indicated that a given observer heard more birds than the average, while a low value corresponded to a lower than average count by an observer for a given group. These graphs facilitate an analysis of our sample of observers. For example, observer 6 produced low counts for all groups, but particularly bird groups 6, 7 and 9. Conversely, observer 9 produced high counts for all groups. However, such consistent patterns were not obtained for all observers; 11 typically recorded average counts for group 9 birds but low ones for group 7. Observers 1, 3 and 7 produced consistently similar counts for all groups (Fig. 1).
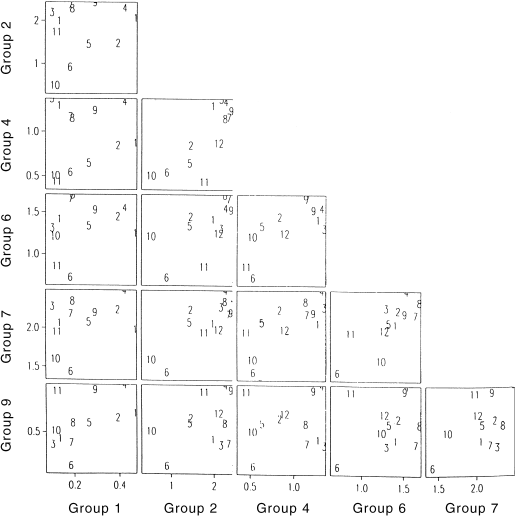
. Pair-wise plots of observer effects for 6 groups of taxa detected by hearing. The numbers in each square correspond to individual observers in the experiment.
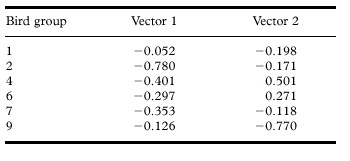
The above analysis allows assessment of pairwise patterns only. Given this, observer effects were subject to Principal Components Analysis of observer effects. This examined patterns of observer heterogeneity by considering all groups simultaneously. The first principal component accounted for 78.1% of the variation between the observers and the second 9.3%. The bird groups contributing most to the first vector were 2, 4, 6 and 7. A contrast between a high count on group 4 (and to a lesser extent group 6) and a low count on group 9 vs a high count on group 9 and low count on group 4 dominated the second vector. Table 4 shows the loadings on the first two vectors. Scores of the first two principal components are graphed in Fig. 2; point labels are the observer identities. An inspection of Fig. 2 shows some evidence of clustering for our sample of observers; possible clusters being: (1, 3, 7, 8), (12, 2, 5, 4, 9) and (6, 10). Results obtained from observer 11 did not cluster with any other observer.
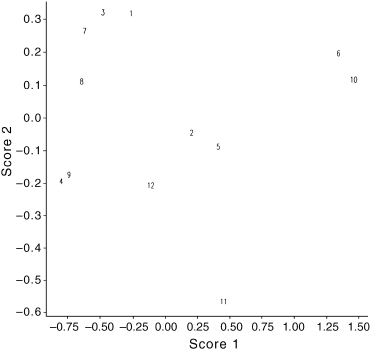
. Plot of the first two principal components scores of the observer effects for six groups of taxa detected by hearing. The numbers in the plot correspond to the identities of field observers.
Sight data
Sufficient information was available to complete statistical analyses of detections by sight for only two categories of birds; group 2 and group 5. For group 2 birds, there was a significant (P = 0.01) method effect and significant (0.159, χ2 = 6.6, P = 0.01) observer heterogeneity. The mean number of group 2 birds detected per zig-zag walk was 1.27 which was almost twice as many as the strip transect (0.65) and the point count (0.86) [SE of the difference between two means (SED) = 0.19]. A plot of observer effects for group 2 versus group 5 birds, showed observer 6 recorded very high counts for both groups (Fig. 3). This finding provided an interesting contrast with the results of analyses of the call data in which observer 6 returned low counts for all birds groups, including group 2.
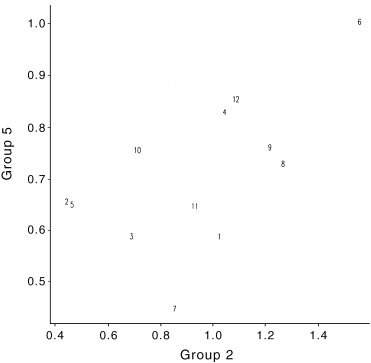
. Scatter plot of observer effects for Group 5 birds vs Group 2 birds detected by sight.
Other effects
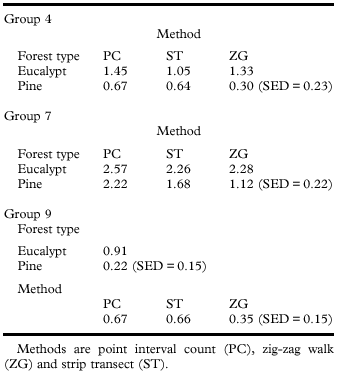
There was evidence of forest type by method interaction effects for group 4 birds (P = 0.04) and group 7 birds (P = 0.02). There also was a method (P = 0.04) and forest type effect (P = 0.01) for group 9 birds. Mean values are given in Table 5. More group 7 birds were recorded using point interval counts than either the zig-zag walk or the strip transect. These effects were more pronounced in stands of P. radiata trees than in Eucalyptus forest, and fewer birds were recorded in P. radiata. (Table 5). More group 4 birds were detected using point interval counts in sites located in Eucalyptus forest. However, this pattern was not the same in P. radiata forest (Table 5). Interpretation of the results for group 9 birds requires caution as these birds were uncommon and there were many zero observations.
DISCUSSION
Our investigation was a carefully designed experimental study of the detectability of forest birds by different observers using different observation methods in two forest types. An important outcome of our work is that we have been able to quantify observer heterogeneity for the detection of forest birds (e.g. see Table 3) and to measure its effect on the precision of counts. Our data support a recommendation that the mean count of at least two observers be used as an estimate of abundance. This will essentially eliminate the effect of observer variability on the precision of the count. However, our data show that observation error remains reasonable large for all groups, in particular for groups 2 and 6. Clearly, using mean counts obtained by more than two observers can reduce this.
Observer heterogeneity was found for many groups of birds, both for detection by call and by sight. For example, large observer differences in birds heard were recorded for groups 2, 4 and 7 but not for groups 5 and 6. Our data showed an interaction between observer and bird group, i.e. inconsistency among observers in the ordering of groups of birds heard most and least. For example, observer 11 typically recorded average counts for group 9 birds but low ones for group 7 (Fig. 2). Similarly, although observers 1, 3 and 7 produced similar counts for all groups, they ranged from above average for group 7 to below average for group 9 (Fig. 2).
Differences between observers were more pronounced for some groups of birds than others. Variation in experience among observers could have contributed to these findings. Greater observer differences would be likely to occur among taxa not particularly familiar to all observers. In addition, active birds that call often (e.g. group 7 taxa) or species that appear to follow observers (such as some taxa belonging to group 2 and group 4) might be prone to being double or triple-counted by some less experienced observers. These groups (2 and 4) were characterized by substantial observer heterogeneity (P < 0.006 or smaller) (Table 3). Inter-relationships between the behaviour of birds and the way observers attempt to detect them also may contribute to substantial observer heterogeneity. For example, the largely visual search approach employed by observer 6 resulted in him seeing more small common birds (e.g. those assigned to group 2) than other observers.
Point interval counts usually generated higher mean values for numbers of birds detected by call (e.g. groups 4, 6, 7 and 9), but other methods gave higher values for abundance from sight data (groups 2 and 5). Walking and counting birds involves two foci of concentration that can result in some birds being missed. In addition, the noise associated with constant observer movement (and the movement itself) can cause some birds to stop calling and/or prevent some calls being heard (Pyke & Recher 1985). More group 2 birds were detected by sight using the zig-zag walk. In the case of group 2 birds, there were several taxa that respond to disturbance with agitated movements and alarm calls (e.g. white-browed scrub wren and brown thornbill). The zig-zag walk may have traversed more territories and disturbed more birds, leading to higher counts than other methods. Method effects were not consistent for other groups. For example, no method effect was identified for sight data for group 5. As in the case with observers, our data do not allow us to determine which method produces ‘better’ results than others. Notably, high counts may not necessarily equate to the best counts.
Counts of birds were considerably higher for detection by calls than for detection by sight, a result consistent with other studies of bird counting methods in the forests of southeastern Australia (Pyke & Recher 1985). For groups 2 and 5, the set of factors found to influence detectability by sight were different from those identified from call data. For example, we recorded significant observer differences for call data gathered for group 2 birds. However, there were both observer and method effects for sight data. This outcome was not surprising as different cues are obviously used by observers to detect birds by sight compared with hearing. This is illustrated by the fact that the only two groups of birds for which sight data could be analyzed were the small, common ones that were active close to observers (group 2) and large, active and highly visible birds (group 5). The attributes that characterized the other groups typically resulted in them being detected by hearing rather than by sight.
At present, considerable effort is dedicated to surveying populations of vertebrate fauna throughout Australia. Data collected in these surveys are frequently subjected to sophisticated analyses. Much less effort has been allocated to a critical examination of sampling design and survey methods, although there are some valuable studies of survey methodologies for birds (e.g. Davies 1984; Recher 1984, 1988; Bell & Ferrier 1985; Pyke & Recher 1985; Ralph et al. 1997). In much of the recent upsurge in survey activity, the validity and effectiveness of field methods is rarely questioned or assessed. It is clear that more critical appraisal of field techniques and observation methods is necessary given the increasing number of surveys being undertaken to underpin key decisions on land use allocation and land management (e.g. environmental impact statements and comprehensive regional assessments). Appraisals of field methods will be very important for projects that require input from many different observers. In designing field surveys for birds, the counting method employed, the types of forest being studied, and the relative emphasis given to sight vs call data need careful consideration (Pyke & Recher 1985).
Few other studies on Australian forest birds involving multiple observers have attempted to quantify observer effects (but see Kavanagh & Recher 1983; Pyke & Recher 1985). Given the wide range of bird surveys being carried out in Australia (e.g. the commencement of the new Atlas of Australian Birds, Birds Australia, Melbourne) there is a need for a more rigorous approach to the study of effects such as observer heterogeneity on the precision of counts. This study is an example as to how this may be done. Our findings also provide some general guidelines on how much sampling is needed to reduce the effects of observer variability on counts.
Acknowledgements
Matthew Pope, Ryan Incoll, Chris McGregor and Sandra McKenzie assisted in aspects of the field work at Tumut. This study was made possible by the dedicated support of volunteers from Canberra Ornithologists Group (COG), particularly Malcolm Fyfe, Terry Munro, Mary Ormay, Anthony Overs, Barrie Pennefather, Alan Scrymgeour, Lyn Scrymgeour, Graham Stephinson, Nicki Taws, Philip Veerman, and Alan Wright. RBC would like to thank Nick Nicholls for reviewing our work and encouraging us to communicate our results in a more effective way. DBL would like to thank Carla Catterall, Barry Baker and Richard Loyn for informative discussions on bird observation methods. Richard Loyn, Graham Pyke, Belinda Dettman and several anonymous referees made useful comments on earlier drafts of the manuscript.


