Nutrition studies on protein and energy in domestic cats
Summary
The effects of three diets varying in their protein, fat and carbohydrate contents and of physical activity on energy and protein metabolism were investigated in eight domestic cats. The diets were based on canned food with addition either of minced cattle heart, melted swine fat or polenta. The activity-induced heat production was measured in a respiration chamber using the Doppler effect of radio-waves reflected from moving bodies. In the group receiving the high-protein diet, urinary nitrogen concentration was higher which was reflected in higher urinary loss of energy without affecting the amount of energy retained. Nitrogen utilization was not significantly influenced by nitrogen intake. Mean daily total heat production ranged between 163 and 187 kJ/kg BW/day or 215 and 270 kJ/kg BW0.75/day. The daily crude protein requirement of adult cats was determined to be 2.7 g/kg BW/day. The daily requirement of metabolizable energy for maintenance was estimated to be 153 kJ/kg BW/day or 226 kJ/kg BW0.75/day. The activity-induced heat production was 25.1 kJ/kg BW/day which corresponded to 13.5% of the total daily heat production. The daily requirement for metabolizable energy was thus reduced by 20.9 kJ/kg BW/day or 13.7%. The activity pattern of the cats was not characterized by a circadian rhythm.
Introduction
Cats are obligate carnivores characterized by an evolutionary adaptation of their metabolism which implies a dependency on a supply of at least some animal-derived materials in their diet (Morris and Rogers, 1983, 1991; Legrand-Defretin, 1994) . It has been suggested on the basis of earlier experimental work that the protein requirement for maintenance of the adult cat is four to five times higher than that of the an adult human, rat or dog, because hepatic enzymes do not adapt to low and high levels of dietary protein (Rogers et al., 1977; Rogers and Morris, 1982). Another particularity of the cat is the relatively lower requirement for energy in comparison with other mammalian species (Kleiber, 1961; Männer et al., 1993). Behavioural studies have demonstrated that, with free access to an abundant source of an acceptable food, domestic cats eat many small meals throughout the 24-h period with no diurnal cycle and that food availability directly affects the pattern of feeding of free-living cats (Mugford and Thorne, 1980; Kane et al., 1981).
The requirement of metabolizable energy (ME) and crude protein (CP) for maintenance were estimated in numerous previous studies which is the base for the current recommendations (National Research Council (NRC), 1986; AAFCO, 1999). This experiment was conducted to investigate the effects of three diets varying in their protein, fat and carbohydrate content on protein and energy balances. The activity pattern of the cats was determined using radio-waves and the activity-induced heat production (δQ) was calculated. The influence of activity on the estimation of the daily maintenance requirement for ME under restricted conditions was then estimated.
Animals, materials and methods
The test subjects were eight 2–15-year-old (median: 3 years) domestic cats with a mean body weight (BW) of 4.41 ± 0.56 (SD) kg which originated from private households. The seven European short-haired cats and one pure-bred Chartreux cat (five gonadectomized males, one sexually intact male and two ovarioectomized females) were used in a cross-over design which included three periods described in Table 1. In each period, each cat received one of three diets varying either in its protein, fat or carbohydrate content. Cats were kept separately during the whole trial which included an adaptation period of 16.5 days at home. During the trial period I in the metabolic cage (95 × 140 × 200 cm) and the trial period II in the respiration chamber (25 × 95 × 130 cm), the room temperature was maintained at 20.0 ± 1.3 °C near the upper critical temperature of cats of 22.5 °C (Hauschild, 1993) and the artificial light cycle was set at 16-h light/8-h dark.
| Period | Day | Duration (days) | Location |
|---|---|---|---|
| Adaptation | 1–16 | 16.5 | At home |
| Trial period I | 17–19 | 2.5 | Metabolic cage |
| Trial period II | 19–21 | 3 | Respiration chamber |
The diets consisted of canned cat food (terrine with beef or rabbit, Whiskas®, Effems AG, Zug, Switzerland) mixed with either minced cattle heart as protein source (HP), melted swine fat as fat source (HF) or polenta as starch source (HC). The distribution was made using the following proportions: 400-g canned food, 95-g minced cattle heart, 23.2-g melted swine fat and 61.8-g polenta. Portions of the feedstuffs containing approximately the daily-required amounts either of protein, fat or carbohydrate were weighted and frozen. After each daily-mixing of the diet, food samples were collected and frozen at −20 °C for later analysis. The cats were fed three times daily between 08.00 and 08.30, 14.00 and 14.30 and 17.30 and 18.00 hours. The amount of food not ingested was recorded in order to determine the daily food intake. Water was provided ad libitum.
The calculation of the utilization of the feed energy was based on the following definitions (Meyer and Zentek, 2001): The gross energy (GE) of the food is the amount of energy contained in the food. The total energy intake is the amount of ingested GE. The digestible energy (DE) is obtained by subtracting the energy contained in the faeces from GE. DE less the energy content of urine and that of the voided combustible waste gases (negligible in monogastric species) leaves the metabolizable energy (ME). The heat dissipated as waste is the heat increment. Subtracting the heat increment from ME gives the net energy (NE) for maintenance and activity in the case of this study. The recommendation for the energy requirement of cats is usually that of metabolizable energy which is made of four components: the basal metabolic rate, an activity factor, an environmental factor and a heat increment factor. The basal metabolic rate, which is the basal energy expenditure following sleep, several hours after food consumption and under thermoneutral conditions, practically cannot be determined in animals. For that reason, the energy requirement of animals for maintenance is determined at a low level of activity just sufficient to preserve life.


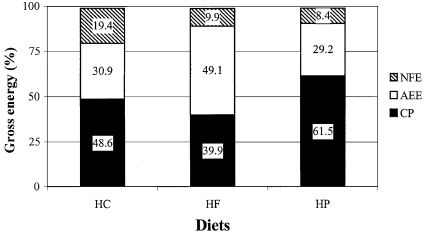
Percentage of gross energy obtained by use of an equation from crude protein (CP), acid ether extract (AEE) and nitrogen-free extracts (NFE) in the three tested diets with a high content of either carbohydrate (HC), fat (HF) or protein (HP).
Faeces and urine were collected using a construction with two customary litter trays (11 × 37 × 47 cm) which allowed the cooling of urine (Stiefel, 1999). A raised grating with wire gauze in the inner litter box was covered with a layer of approximately 0.5–1.5-cm polypropylene litter grains (3 × 3 mm, antistatic, Finapro®; WEZ, Kunststoffwerke, Oberentfelden, Switzerland) and allowed the separation of urine and faeces. Urine was only minimally (1–2%) retained in the litter grains. Urine and faeces samples were collected daily between 11.30 and 13.00 hours, weighed and immediately frozen. All food, faeces and urine samples of each experimental period were mixed together before analysis.
Nitrogen (N) concentrations of the food and faeces samples and carbon (C) and N concentrations of the urine samples were quantitated by use of a CN-Analyzer (CHN-600; Leco Corporation, St Joseph, MI, USA). GE of faeces was determined by bomb calorimetry (System C 700 T; IKA Analysetechnik GmbH, Heitersheim, Germany). GE of the urine was estimated with the regression equation of Hoffmann and Klein (1980) using the regression coefficients of 33 kJ/g C and 9 kJ/g N.


The activity of the eight cats was measured for 46 of the 72 days of the trial by transmitting radio-waves of constant wavelength and amplitude in the respiration chambers (Wenk and Van Es, 1976). Movements of the animals induced a change of wavelength of the reflected radio-waves because of the Doppler effect. These changes were counted as impulses per unit of time. The total heat production at rest (Qrest) was calculated using the gas exchange data when no activity was measured (O2/rest and CO2/rest). The activity-related heat production δQ was obtained by subtraction of Qrest from Qactivity.
The ME and CP requirements were estimated by regression analysis of the data of Eretained plotted against those of ME intake and the data of Nretained plotted against those of N intake (Nfood), assuming no energy and N retention. For the balances, differences among groups were investigated by a Kruskal–Wallis test followed by Wilcoxon tests. Differences in activities were compared with Student's t-tests. The level of significance was fixed at 0.05.
Results
Data of two cats were eliminated in the HC group because both animals ingested only small amounts of feed and were consequently characterized by negative Nretained and Eretained values. Mean body weight differences during the three trial periods were slightly positive (Table 2). Results for the N balance are presented in Table 3. Mean Nfood, Nurine and Nretained of the HP group were significantly higher than those of the two other groups. The ratio Nurine/Nfood and k(N) did not differ significantly among groups.
| Body weight | Diet | ||
|---|---|---|---|
| HF (n = 8) | HC (n = 6) | HP (n = 8) | |
| At day 17 | 4.35 ± 0.74 | 4.24 ± 0.44 | 4.39 ± 0.60 |
| At day 21 | 4.36 ± 0.58 | 4.27 ± 0.41 | 4.47 ± 0.49 |
| Difference | +0.01 ± 0.16 | +0.03 ± 0.09 | +0.08 ± 0.12 |
| Parameter (Unit) | Diet | ||
|---|---|---|---|
| HF (n = 8) | HC (n = 6) | HP (n = 8) | |
| Nfood (g/kg BW/day) | 1.038 ± 0.22a | 1.180 ± 0.14a | 1.603 ± 0.30b |
| Nfaeces (g/kg BW/day) | 0.168 ± 0.06 | 0.231 ± 0.06 | 0.160 ± 0.06 |
| Nurine (g/kg BW/day) | 0.592 ± 0.12a | 0.661 ± 0.11a | 0.911 ± 0.22b |
| Nretained (g/kg BW/day) | 0.279 ± 0.15a | 0.288 ± 0.11a | 0.533 ± 0.15b |
| k(N) (g/g) | 0.263 ± 0.12 | 0.245 ± 0.09 | 0.332 ± 0.08 |
| Nurine/Nfood (g/g) | 0.578 ± 0.11 | 0.560 ± 0.06 | 0.569 ± 0.07 |
- k(N) = Nretained/Nfood = N utilization
The activity during the light period was associated with 179 ± 90 impulses/h whereas 161 ± 128 impulses/h (not statistically significant) were registered during the dark period. Results of the energy balance are shown in Table 4. Mean Eurine in the group with the HP diet was significantly higher as a result of the higher mean Nurine. However, mean Eretained values were not significantly different between groups. Mean daily total heat production calculated with the RQ-method (QRQ-method) values did not differ significantly among groups. After adjustment for BW0.75, mean QRQ-method values were 215.4 ± 26.5, 269.7 ± 44.3 and 246.6 ± 22.0 kJ/kg BW0.75/day for the HC, HF and HP groups, respectively, with no significant differences. δQ was 25.1 kJ/kg BW/day which corresponded to 13.5% of the total daily heat production (Table 5).
| Parameter | Diet | ||
|---|---|---|---|
| HF (n = 8) | HC (n = 6) | HP (n = 8) | |
| Efood | 416.3 ± 90.6 | 379.0 ± 49.6 | 409.1 ± 79.4 |
| Efaeces | 45.2 ± 15.4 | 57.8 ± 12.4 | 42.0 ± 15.4 |
| Eurine | 19.1 ± 3.64a | 20.8 ± 3.48a | 26.6 ± 6.23b |
| QRQ-method | 187.3 ± 31.5 | 163.0 ± 18.1 | 170.0 ± 17.0 |
| Eretained | 164.7 ± 50.8 | 137.3 ± 32.2 | 170.5 ± 55.9 |
- For all values the unit is kJ/kg BW/day. QRQ-method = daily total heat production calculated by use of the respiratory quotient (RQ)
| Parameter (Unit) | Value |
|---|---|
| Qactivity (kJ/kg BW/day) | 183.6 ± 27.8 |
| Qrest (kJ/kg BW/day) | 158.4 ± 22.2 |
| δQ (kJ/kg BW/day) | 25.1 ± 7.5 |
| δQ (%) | 13.5 ± 2.8 |
- The measurement were performed during 46 days
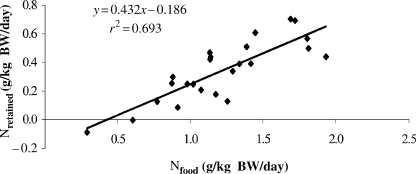
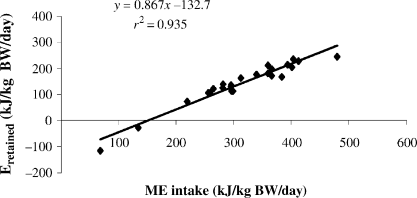
The daily CP requirement amounted to 2.7 g/kg BW/day (Fig. 2) and the daily ME requirement to 153 kJ ME/kg BW/day (Fig. 3). Taking account of δQ, the estimation of the daily ME requirement was reduced by 20.9 kJ ME/kg BW/day or by 13.7% (Table 6).

Estimation of the crude protein requirement for maintenance by use of linear regression on the data of Nretained plotted against Nfood (X-intercept · 6.25 = crude protein requirement for maintenance).

Estimation of the requirement for maintenance of metabolizable energy (ME) by use of linear regression on the data of Eretained plotted against ME intake (X-intercept = ME requirement for maintenance).
| Parameter (Unit) | Value |
|---|---|
| ME requirement for active cats (kJ/kg BW/day) | 152.5 |
| ME requirement at rest (kJ/kg BW/day) | 131.7 |
| δ ME requirement (kJ/kg BW/day) | 20.9 |
| δ ME requirement (%) | 13.7 |
- The daily metabolizable energy (ME) requirement for active cats and for cats at rest was calculated by linear regression on the Eretained data calculated with Qactivity and Qrest, respectively, plotted against those of ME intake. The measurements were performed during 46 days
Discussion
In the present study, more N was retained in the body and urinary N loss increased in proportion with high dietary N whereas k(N) did not differ significantly among the three groups. This might be explained by the very limited capacity of feline enzymes involved in protein catabolism to adapt to a lower protein intake (Rogers et al., 1977; Morris and Rogers, 1991). Indeed, if the cat could adapt to a lower protein intake, less protein would be metabolized in the liver and consequently less urea would be excreted in urine and more protein would be retained if, as observed in this study, the apparent absorption of N remains constant. In an earlier study, k(N) decreased with increased Nfood (Greaves and Scott, 1960). More recently, a work supported by data of the literature was in agreement with our observation that k(N) is not influenced by Nfood (Dekeyzer, 1997). The controversy may be explained by a putative reservoir function of liver and muscle and the degree of filling of this reservoir. The higher urinary energy loss of the HP group which is related to the increased N urinary loss was not reflected in a lower Eretained because of the relative low contribution of urine to the total energy loss. Nretained values may be spuriously high because of an incomplete collection of faeces and urine.
The lack of diurnal cycle in the activity observed in our study is in agreement with previous observations (Mugford and Thorne, 1980; Kane et al., 1981). The mean Qrest and Qactivity values determined in our study are within the range of the values reported earlier for healthy resting cats by use of the RQ and carbon and nitrogen balance techniques (142–233 kJ/kg BW/day; Radicke, 1995; Tennant, 1998). After adjustment for BW0.75, the values of this study corresponded to those published earlier (224–269 kJ/kg BW0.75/day; Männer et al., 1993). In fasted mammals, the daily total heat production (Q) adjusted for BW0.75 was 293 kJ/kg BW0.75/day (Kleiber, 1961) which is higher than the values obtained for cats in this study. Higher values were also determined for dogs (Männer et al., 1993). The relatively low values observed in cats may be explained by the high efficiency of their protein metabolism associated with a smaller Q (Hauschild, 1993).
The CP requirement calculated for the cats of our study was 2.7 g/kg BW/day. This agrees with most data of the literature which range between 1.3 and 3.1 g/kg BW/day (Miller and Allison, 1958; Scott, 1981; Burger et al., 1984; Radicke, 1995; Zentek et al., 1998). According to these results, the CP requirement of adult cats is not higher than that of other species. Indeed, adult cats may live with 1 g/kg BW/day protein with a high biological value (Dekeyzer, 1997). Higher values for the CP requirement of cats (4.6 and 5.0 g/kg BW/day) were obtained in two other studies (Greaves and Scott, 1960; Figge, 1989). The minimum requirement for digestible energy of dogs lays between 0.9 g/kg BW/day for small-sized adult dogs and 1.7 g/kg BW/day for larger-sized adult dogs (Meyer and Zentek, 2001). Recommendations for the maintenance of adult dogs with digestible energy are between 1.8 and 3.3 g/kg BW/day. The present NRC recommendation for a minimum requirement for maintenance of adult cats is 240 g/kg DM of a food containing 20.93 kJ/g DM (NRC, 1986) whereas the minimum recommendation of the Canine and Feline Nutrition Expert Subcommittees of the Association of American Feed Control Officials (AAFCO) is 260 g/kg DM of a food containing 16.7 kJ/g DM or 16 g/MJ (AAFCO, 1999).
The ME requirement calculated in our study was 153 kJ ME/kg BW/day. A wide range of values was obtained from previous studies which may be explained by the different experimental methods and conditions used (Stiefel, 1999). Factors such as energy expenditure related to food intake, digestion, slight muscular activity and body heat regulation may carry a high degree of variability. The NRC recommendations from 1986 for cats at rest (293 kJ ME/kg BW/day) and during activity (334 kJ ME/kg BW/day) are higher than the values determined in this study and in other recent investigations (Hauschild, 1993; Männer et al., 1993; Ballevre et al., 1994; Radicke, 1995; Flynn et al., 1996), suggesting that the current official recommendations are too high. The discrepancies in the literature for the ME requirement may be partly explained by the influence of δQ. Indeed, under free-living conditions high values for δQ may be assumed.
References
Author's address: Prof. M. Wanner, Institute of Animal Nutrition, University of Zurich, Winterthurerstrasse 260, CH-8057 Zurich, Switzerland. Tel.: 41-1-635 8801; Fax: 41-1-635 8932; E-mail: mwanner@vetphys. unizh.ch


