Differential post-transcriptional regulation of yeast mRNAs in response to high and low glucose concentrations
Abstract
Glucose regulates yeast gene expression at both transcriptional and post-transcriptional levels. Glucose strongly represses the transcription of the gluconeogenic genes, FBP1 and PCK1, and accelerates the degradation of their mRNAs. Together these mechanisms are responsible for the rapid decrease in gluconeogenic enzyme synthesis when yeast cells switch to glycolytic metabolism. In this study, we show that accelerated gluconeogenic mRNA degradation can be triggered by low concentrations of glucose (<0.02%). This sets the FBP1 and PCK1 mRNAs apart from other glucose-sensitive mRNAs, such as the Ip mRNA, which only responds to high glucose concentrations (>1%). We also show that accelerated gluconeogenic mRNA degradation is co-ordinated with transcriptional repression by common signalling components that include sugar kinases and Ras-cAMP signalling. Furthermore, the ability of the low glucose signal to trigger accelerated gluconeogenic mRNA degradation depends upon the low glucose sensor, Snf3p, but not on the high glucose sensor, Rgt2p. Also, this response is influenced by reg1 and ume5 mutations, but not by grr1 or rgt1 mutations. Our data suggest that several signalling pathways co-ordinate differential post-transcriptional and transcriptional responses in yeast, depending upon the amount of glucose available in the medium.
Introduction
Saccharomyces cerevisiae is an excellent model for the analysis of nutrient signalling and gene regulation. Glucose exerts profound effects on the yeast cell, activating a range of metabolic responses that are co-ordinated by a complex array of signal transduction pathways (for reviews see Johnston and Carlson, 1992; Trumbly, 1992; Ronne, 1995; Gancedo, 1998; Johnston, 1999). In response to glucose, the glycolytic pathway is activated, respiratory activity decreases, ribosome biogenesis increases and pathways for the assimilation of alternative carbon sources are repressed. Components of these glucose signalling pathways are conserved in mammalian cells (reviewed in Johnston, 1999).
The gluconeogenic pathway is especially sensitive to inhibition by glucose. Most glycolytic reactions are reversible and are also used for gluconeogenesis. However, phosphofructokinase and pyruvate kinase catalyse essentially irreversible glycolytic reactions, which must be circumvented by the gluconeogenic-specific enzymes, fructose-1,6-bisphosphatase and phosphoenolpyruvate carboxykinase. Upon glucose addition, these gluconeogenic enzymes are subject to allosteric inhibition, covalent modification and protein degradation (Funayama et al., 1980; Mazon et al., 1982a, b). In addition, their synthesis is repressed by a combination of transcriptional repression and accelerated mRNA degradation (Mercado et al., 1994; Yin et al., 1996). Hence, glucose repression in yeast represents an attractive system in which to study the co-ordination of gene responses at transcriptional and post-transcriptional levels.
Transcription of the gluconeogenic genes PCK1 and FBP1 is strongly repressed, even in response to low glucose concentrations (less than 0.01%). This is in contrast to other glucose repressed genes, which remain unaffected by these low glucose concentrations (Yin et al., 1996; Meijer et al., 1998). Distinct signal transduction pathways appear to mediate transcriptional repression in response to different glucose concentrations. The classical Mig1p-dependent pathway triggers repression in response to high glucose signals (about 1%; Özcan and Johnston, 1995), the Ras-cAMP pathway can be activated by medium glucose signals (about 0.1%; Beullens et al., 1988), and a third, Mig1p-independent pathway, represses PCK1 and FBP1 in response to low glucose signals (<0.02%; Yin et al., 1996).
The degradation of a number of yeast mRNAs is accelerated in response to high glucose signals (>1% glucose). These include the SDH2 mRNA, which encodes the iron-protein subunit (Ip) of succinate dehydrogenase (Lombardo et al., 1992), the SUC2 mRNA encoding invertase (Cereghino and Scheffler, 1996), meiotic mRNAs such as SPO13 (Surosky et al., 1994) and the PCK1 and FBP1 mRNAs (Mercado et al., 1994). Presumably the glucose signalling pathways that trigger these post-transcriptional responses share common components with those that elicit transcriptional responses to glucose. Indeed, accelerated Ip mRNA degradation does appear to depend upon Reg1p (Cereghino and Scheffler, 1996), a component of the Mig1p-dependent glucose repression pathway (Johnston and Carlson, 1992; Gancedo, 1998; Johnston, 1999). In this study, we have examined the signalling pathways that accelerate gluconeogenic mRNA degradation in response to glucose. We show that accelerated gluconeogenic mRNA degradation is sensitive low glucose signals in contrast to the Ip mRNA, which only responds to high glucose signals. We also confirm that some common signalling components trigger the transcriptional and post-transcriptional responses of the PCK1 and FBP1 genes.
Results
Yeast mRNAs respond differentially to low glucose signals
Previously, we demonstrated that the degradation of the gluconeogenic mRNAs accelerates about twofold upon the addition of 2% glucose to yeast cells growing on non-fermentable carbon sources (Mercado et al., 1994). As gluconeogenic gene transcription is sensitive to low glucose concentrations (<0.02%; Yin et al., 1996), our first aim was to test whether gluconeogenic mRNAs also respond to low glucose signals at the post-transcriptional level. The Ip mRNA was also analysed because the response of this glucose-sensitive mRNA to low glucose signals has not been tested. As expected (Lombardo et al., 1992; Mercado et al., 1994), the FBP1, PCK1 and Ip mRNAs were cleared rapidly from the cytoplasm after the addition of 2% glucose to mid-exponential gluconeogenic cultures (Fig. 1). However, whereas the FBP1 and PCK1 mRNAs responded to the addition of 0.02% glucose, Ip mRNA levels remained unaffected.
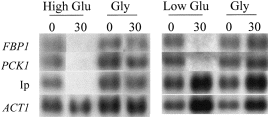
Gluconeogenic and Ip mRNAs respond differentially to a low glucose signal. Northern analysis of the FBP1, PCK1 and Ip mRNAs and the ACT1 mRNA control was performed 0 and 30 min after the addition of glucose or glycerol to mid-exponential W303-1A cells growing on YPGlycerol: 2% glucose (High Glu); 0.02% glucose (Low Glu); 3% glycerol (Gly). All autoradiographic signals shown were generated by reprobing the same membrane. Intermediate timepoints for the high glucose experiments are not shown because these timepoints were not examined in the low glucose experiment.
The effect of a low glucose signal upon gluconeogenic and Ip mRNA degradation was tested further. We measured relative decay rates for each mRNA in the presence and absence of glucose (Experimental procedures). Yeast gluconeogenic mRNAs are affected by a mild heat-shock, and mRNA half-live measurements based on the transcriptional inhibitor 1,10-phenanthroline yield similar gluconeogenic mRNA half-lives to pulse-chase methods (Mercado et al., 1994). Hence, 1,10-phenanthroline was used in this study (Experimental procedures), rather than the temperature-sensitive RNA polymerase B mutant, rpb1 (Parker et al., 1991). The addition of 0.02% glucose to mid-exponential cells growing on lactate increased the rate of FBP1 and PCK1 mRNA degradation (Fig. 2A). However, this low glucose signal did not trigger the rapid Ip mRNA degradation that has been associated with high glucose signals (Lombardo et al., 1992).
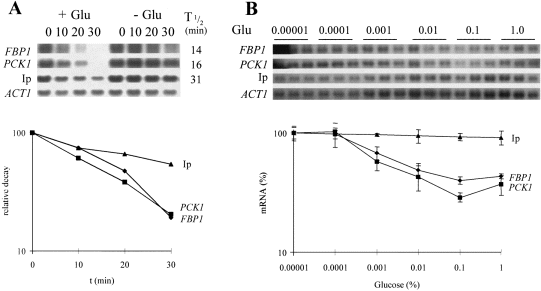
The gluconeogenic mRNAs are exquisitely sensitive to glucose.
A. FBP1 (♦), PCK1 (▪) and Ip (▴) mRNA levels were measured relative to the ACT1 mRNA, using quantitative Northern analysis at various times (min) after the addition of 1,10-phenanthroline and 0.02% glucose ( + Glu) or H2O (– Glu) to mid-exponential W303-1A cells growing on YPL. Signals were quantified using phosphorimaging and relative decay in the presence of glucose, presented for each mRNA in a semilog plot. Relative mRNA half-life measurements in the presence of glucose are presented alongside the Northern blots (Experimental procedures).
B. FBP1 (♦), PCK1 (▪) and Ip (▴) mRNA levels were measured relative to the ACT1 mRNA 15 min after the addition of 1,10-phenanthroline and glucoseand presented as a percentage of their level after H2O addition in a semilog plot. Glucose was added at various concentrations ranging from 1% to 0.00001% (55 mM to 0.55 (μM). Errors from triplicate measurements are presented.
The dose-dependent responses of the gluconeogenic and Ip mRNAs were then analysed. Different amounts of glucose were added to mid-exponential yeast cultures growing on lactate, and the effects upon mRNA degradation were tested by measuring mRNA levels after 15 min (Fig. 2B). The FBP1 and PCK1 mRNAs responded reproducibly to glucose concentrations as low as 0.001%, whereas the Ip mRNA was only slightly affected by 1% glucose under these conditions. 1,10-Phenanthroline did not inhibit the degradation of the Ip mRNA stimulated by the addition of glucose to gluconeogenically growing cells. Hence, the Ip mRNA responds only to high glucose signals, whereas gluconeogenic mRNA degradation accelerates in response to low and high glucose signals. These data show clearly that yeast mRNAs display differential sensitivities to glucose at the post-transcriptional level.
The FBP1 and PCK1 mRNAs displayed similar responses under all the conditions tested, and hence only PCK1 data are presented for subsequent experiments on low glucose signalling. Also, further data for the Ip mRNA are not presented because this mRNA did not respond to these low glucose signals.
A common signal(s) triggers transcriptional and post-transcriptional regulation in response to low glucose
We reasoned that a common signal(s) might activate both accelerated gluconeogenic mRNA degradation and transcriptional repression after the addition of low glucose concentrations. To test this, we first compared the effects of different carbon sources upon both of these responses. The effects upon transcriptional repression were determined by monitoring PCK1 and FBP1 mRNA levels after the addition of low concentrations of each carbon source (0.02%) to mid-exponential cultures growing on lactate (not shown). We examined their effects upon mRNA degradation by analysing gluconeogenic mRNA decay rates after the addition of 1,10-phenanthroline to parallel cultures (Fig. 3A). The fermentable carbon sources, glucose and fructose triggered both transcriptional repression and accelerated gluconeogenic mRNA degradation. In contrast, non-fermentable carbon sources, such as glycerol and lactate, did not activate either response, and this was also the case for the sugar galactose. Galactose is not an efficient carbon source and GAL genes are not induced in gluconeogenically growing cells (Johnston and Carlson, 1992; Gancedo, 1998). Hence, it is not surprising that galactose did not trigger the gluconeogenic responses when added at such low concentrations (0.02%). Significantly, both the transcriptional and post-transcriptional responses were activated by the same carbon sources.
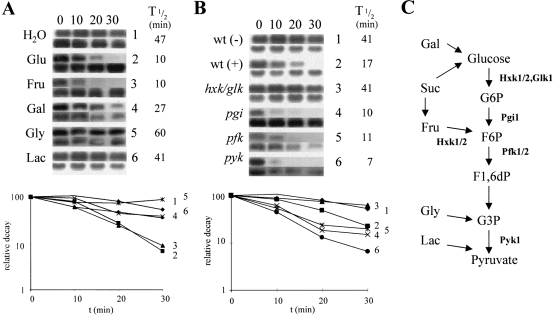
The internal metabolic signal for accelerated gluconeogenic mRNA degradation involves sugar phosphorylation.
A. 1,10-phenanthroline was added along with various carbon sources (0.02%) to mid-exponential W303-1A cells growing on YPL. At various times thereafter (min), PCK1 mRNA levels were measured relative to the ACT1 mRNA using quantitative Northern analysis. Relative PCK1 mRNA decay in the presence of each carbon source is presented (Experimental procedures). H2O, control, 1 (♦); glucose, Glu, 2 (▪); fructose, Fru, 3 (▴); galactose, Gal, 4 (×); glycerol, Gly, 5 (*); lactate, Lac, 6 (●). Control ACT1 measurements were made for all cultures, and these blots are shown immediately below each PCK1 Northern. Relative PCK1 mRNA half-lives are shown to the right of the Northerns.
B. Relative PCK1 mRNA decay in the presence of glucose was analysed in various glycolytic mutants after the addition of 0.02% glucose to YPL cultures. Control cultures (H2O addition) were used as controls for each mutant. A representative blot for the wild-type parent is shown: W303-1A H2O control, wt (–), 1 (♦); W303-1A plus glucose, wt ( + ), 2 (▪). Mutant cultures plus glucose: D308-3 (hxk1, hxk2, glk1), 3 (▴); 9520T4C (pgi1), 4 (×); YKC24 (pfk1, pfk2), 5 (*); YKC21 (pyk1), 6 (●). Full genotypes of all strains are provided in Table 1. The ACT1 blot for each strain is shown immediately below the corresponding PCK1 Northern and relative PCK1 mRNA half-lives are given.
C. Summary of glycolysis showing the entry points for the carbon sources analysed in (A) and highlighting the mutations analysed in (B).
We then tested the effects of different glycolytic mutations upon the transduction of low glucose signals. Mutations in three genes are required to block glucose phosphorylation in yeast: HXK1, HXK2, and GLK1. No accelerated gluconeogenic mRNA degradation was observed in the triple hxk1,hxk2,glk1 mutant in response to 0.02% glucose (Fig. 3B), or when the non-phosphorylatable analogue 6-deoxyglucose was added at 0.02% to wild-type cells growing on lactate (not shown). However, glycolytic blocks caused by mutations in the phosphoglucoisomerase, phosphofructokinase or pyruvate kinase genes did not inhibit the response (Fig. 3). This suggested that glucose phosphorylation is required, but that further glycolytic metabolism is not necessary for low glucose signal transduction.
We demonstrated, however, that glucose-6-phosphate synthesis is not an absolute requirement for low glucose signal transduction. Fructose (0.02%) triggered accelerated FBP1 and PCK1 degradation in the pgi1 and pfk1,pfk2 mutants, but not in the triple hxk1,hxk2,glk1 mutant. Hence, fructose phosphorylation was sufficient to trigger the response in the absence of glucose-6-phosphate synthesis or further fructose-6-phosphate catabolism (not shown). Therefore the ability to phosphorylate glucose or fructose is required for accelerated gluconeogenic mRNA degradation in response to a low sugar signal. We have shown previously that sugar phosphorylation is required for the transcriptional repression of FBP1 and PCK1 by a low glucose signal (Yin et al., 1996). Therefore, a common signal(s) appears to trigger both transcriptional and post-transcriptional responses to low glucose signals.
Some subtle differences were observed between the transcriptional and post-transcriptional responses to low glucose signals. The phosphorylatable analogue 2-deoxyglucose reproducibly triggered transcriptional repression (Yin et al., 1996), but it did not activate accelerated gluconeogenic mRNA degradation (not shown). Although the explanation for this is not clear, our data are consistent with those of Cereghino and Scheffler (1996), who reported that 2-deoxyglucose does not activate Ip mRNA degradation.
Trehalose 6-phosphate synthase influences gluconeogenic mRNA degradation
Trehalose 6-phosphate is thought to play an important role in the activation of glycolytic flux by acting as a feedback inhibitor of hexokinase (Blázquez et al., 1993), thereby preventing the hyperaccumulation of sugar phosphates (François et al., 1984; Londesborough and Vuorio, 1993; Thevelein, 1994; Gonçalves and Planta, 1998). Sugar phosphorylation, but not glycolytic metabolism, was required to trigger accelerated gluconeogenic mRNA degradation in response to a low glucose signal (Fig. 3). Therefore, we predicted that this response would not be affected by mutations in the TPS1 gene, which encodes trehalose 6-phosphate synthase. (TPS1 also is called FDP1, BYP1, CIF1 and GGS1: Van de Poll and Schamhart, 1974; Breitenbach-Schmitt et al., 1984; Bell et al., 1992; Gonzalez et al., 1992; Van Aelst et al., 1993). We tested this using two types of TPS1 allele: tps1Δ (a null mutant: Bell et al., 1992), and fdp1 (a point mutant: Banuelos and Fraenkel, 1982; Van Aelst et al., 1993). As expected, accelerated gluconeogenic mRNA degradation was still triggered by 0.02% glucose in the fdp1 mutant (Fig. 4). However, this response was blocked in tps1 mutants, and this difference between the tps1 and fdp1 strains was reproducible. Fdp1 is a leaky mutant, whereas the tps1 allele is a null mutation. Hence the fdp1 mutant might retain sufficient activity (trehalose levels < 6% of wild type: Van Aelst et al., 1993) to trigger accelerated gluconeogenic mRNA degradation upon addition of 0.02% glucose. Alternatively, as the response was lost in the null allele (tps1), but not in the point mutant (fdp1), the response might require the Tps1 protein, even if it does not retain full metabolic activity. This explanation is consistent with the idea that Tps1p plays both enzymatic and regulatory roles in yeast metabolism and signalling (Van Aelst et al., 1993).
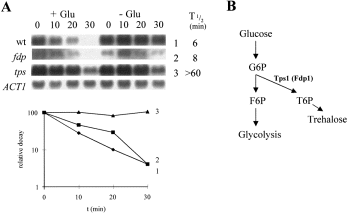
Some tps1 alleles block the acceleration of gluconeogenic mRNA degradation in response to a low glucose signal.
A. Relative PCK1 mRNA decay was measured using Northern analysis in mid-exponential cultures growing on YPL (Experimental procedures): 0.02% glucose ( + Glu); H2O control (–Glu). W303-1A (wild-type), 1 (♦); DFY334 (fdp1), 2 (▪); BKp11-12A (tps1), 3 (▴). Full genotypes of the strains are provided in Table 1. Representative ACT1 blots for the W303-1A cultures are shown. Relative PCK1 mRNA half-lives in the presence of glucose are shown.
B. Relationship between glycolysis and trehalose biosynthesis, highlighting the mutations analysed in (A).
The low glucose response is dependent upon the low glucose sensor, Snf3p
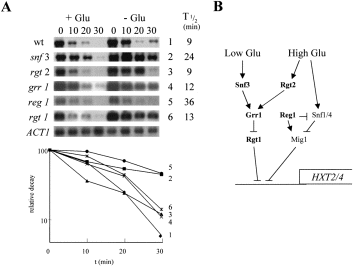
Johnston and co-workers have suggested that distinct pathways mediate the effects of low or high (4%) glucose signals upon yeast HXT gene transcription (Özcan and Johnston, 1995, 1996; Özcan et al., 1996a). (Their low and high glucose signals were experimentally defined as 0.1% and 4% glucose respectively.) According to this model (Johnston, 1999), Rgt2p and Snf3p act as glucose sensors (Fig. 5). Both are glucose transporter-like proteins, but both carry unusual carboxy-terminal extensions that are important for signalling (Özcan et al., 1996b; Özcan and Johnston, 1998). Consistent with this model, dominant mutations in SNF3 and RGT2 activate HXT2, even in the absence of glucose (Özcan et al., 1996b). Rgt2p and Snf3p are thought to sense high and low glucose signals respectively (Johnston, 1999), as HXT2 induction by a low glucose signal is impaired by a snf3Δ mutation, and is blocked by a rgt2Δ mutation in high glucose (Özcan et al., 1996b).
Involvement of low and high glucose signalling components in the post-transcriptional response to a low glucose signal.
A. Relative PCK1 mRNA decay was measured using Northern analysis in mid-exponential cultures growing on YPL (Experimental procedures): 0.02% glucose ( + Glu); H2O control (–Glu). YM4127 (wild-type), 1 (♦); YM4714 (snf3), 2 (▪); YM4817 (rgt2), 3 (▴); YM2955 (grr1), 4 (×); YM4552 (reg1), 5 (●); YM4509 (rgt1), 6 (*). Full genotypes of the strains are provided in Table 1. Representative ACT1 blots for the YM2955 cultures are shown. Relative PCK1 mRNA half-lives in the presence of glucose are shown.
B. Summary of the low and high glucose signalling pathways that regulate HXT2/4 transcription in response to glucose (adapted from Johnston, 1999), highlighting the mutations analysed in (A).
We reasoned that the low glucose signalling pathway that regulates HXT gene expression (Fig. 5) might also be involved in activating accelerated gluconeogenic mRNA degradation in response to (very) low glucose signals (0.02%). Hence, we tested the effects of snf3 and rgt2 mutations upon this response (Fig. 5). Rapid gluconeogenic mRNA degradation was unaffected by the rgt2 mutation, but was blocked in the snf3 strain. This suggests that the low glucose sensor Snf3p, but not the high glucose sensor Rgt2p, is required for post-transcriptional regulation of the gluconeogenic mRNAs in response to 0.02% glucose.
Reg1p influences gluconeogenic mRNA degradation, but Grr1p and Rgt1p do not
Ip mRNA degradation is inhibited by reg1 mutations, but is not affected by mutations in other genes involved in regulating transcriptional activity in response to glucose (Cereghino and Scheffler, 1996). REG1 encodes a phosphoprotein phosphatase subunit (Tu and Carlson, 1995), which is thought to be involved in the transduction of high glucose signals (Özcan and Johnston, 1996; Johnston, 1999; Fig. 5). As described above, Ip mRNA degradation only responds to high glucose signals, whereas the FPB1 and PCK1 mRNAs respond to both low and high glucose signals (Fig. 1). Therefore, we tested the influence of Reg1p upon upon gluconeogenic mRNA degradation (Fig. 5). A low glucose signal (0.02%) did not promote accelerated PCK1 mRNA degradation in the reg1 mutant, and this effect was reproducible. Hence, the transduction of this low glucose signal is dependent upon Reg1p.
We also examined the influence of Rgt1p and Grr1p upon gluconeogenic mRNA degradation. Grr1p and Rgt1p play important roles in the regulation of HXT gene expression in response to high and low glucose signals (Fig. 5). Rgt1p is a transcriptional regulator (Özcan et al., 1996a) that acts downstream in these signalling pathways (Johnston, 1999), whereas Grr1p is a component of a ubiquitin–ligase complex (Li and Johnston, 1997; Skowyra et al., 1997), that is thought to operate in glucose signalling by targeting Rgt1p for degradation (Johnston, 1999). Neither the grr1 nor the rgt1 mutation exerted detectable effects upon gluconeogenic mRNA degradation in response to a low glucose signal (Fig. 5), suggesting that Grr1p and Rgt1p do not play significant roles in this response. Hence some, but by no means all, glucose signalling components are involved in regulating gluconeogenic mRNA degradation.
The Ras-cAMP pathway can trigger accelerated gluconeogenic mRNA degradation
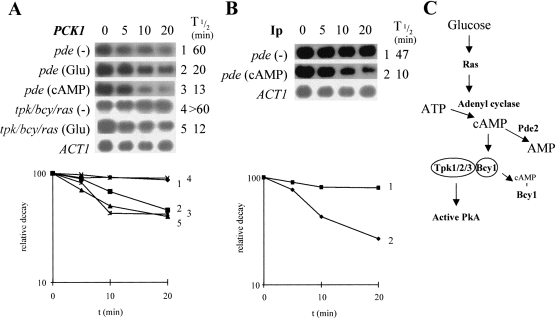
Glucose is known to activate the Ras-cAMP pathway (for reviews see Broach, 1991; Thevelein, 1992, 1994), which in turn leads to the transcriptional repression of FBP1 and PCK1 (Yin et al., 1996). Hence, we tested whether this pathway can also trigger accelerated gluconeogenic mRNA degradation. Exogenous cAMP addition has been used previously to activate the Ras-cAMP pathway (Ulaszewski et al., 1989; Baroni et al., 1994; Tokiwa et al., 1994). This is generally performed in a phosphodiesterase (pde2) mutant background that renders the yeast cell responsive to exogenous cAMP (Wilson and Tatchell, 1988). Gluconeogenic mRNA degradation was accelerated after cAMP addition to this strain, in a similar fashion to the glucose control (Fig. 6). However, AMP and cCMP did not generate the same response (not shown). Therefore, cAMP mimics glucose addition, suggesting that activation of the Ras-cAMP pathway can trigger accelerated gluconeogenic mRNA degradation. cAMP also stimulated Ip mRNA degradation (Fig. 6), yet this mRNA only responds to high glucose signals (Fig. 2). Therefore, addition of exogenous cAMP (7 mM) would appear to mimic a high glucose signal.
Accelerated gluconeogenic mRNA degradation is triggered by exogenous cAMP, but is not dependent on the Ras-cAMP pathway.
A. Relative PCK1 mRNA decay was measured using Northern analysis (Experimental procedures) in mid-exponential cultures of J104 (pde2) growing on YPL after the addition of H2O (–), 1 (♦); 0.02% glucose (Glu), 2 (▪); or 7 mM cAMP (cAMP), 3 (*). PD6595 (ras1, ras2, tpk1, tpk2w1, tpk3, bcy1) was also analysed. H2O (–), 4 (×); or 0.02% glucose (Glu), 5 (▴). Full genotypes of the strains are provided in Table 1. Data are presented in a semilog plot. A representative ACT1 blot for the J104 H2O culture is shown and relative PCK1 mRNA half-lives are given.
B. Relative Ip mRNA decay was measured by reprobing the same blots used in (A): J104 (pde2) growing on YPL after the addition of H2O (–), 1 (▪); or 7 mM cAMP (cAMP) (♦). Data are presented in a semilog plot, and relative Ip mRNA half-lives are shown.
C. Summary of the Ras-cAMP pathway highlighting mutations analysed in (A) and (B).
To test whether accelerated gluconeogenic mRNA degradation is dependent upon the Ras-cAMP pathway, we examined FBP1 and PCK1 mRNA metabolism in a yeast strain without a functional Ras-cAMP pathway (ras1, ras2, Δtpk1, tpk2wl, Δtpk3, Δbcy1). This strain does not contain either of the Ras proteins, the regulatory subunit of protein kinase A (Bcy1p) or two of the three catalytic subunits (Tpk1p and Tpk3p), but it carries a partially active TPK2 locus, which allows the strain to retain viability (Durnez et al., 1994). Gluconeogenic mRNA degradation rates increased in this mutant after the addition of 0.02% glucose (Fig. 6), showing clearly that low glucose signal transduction is not dependent upon a functional Ras-cAMP pathway. Hence, an additional pathway can trigger this response.
Gluconeogenic mRNA degradation is slower in a ume5 mutant
UME5 regulates the stability of meiotic mRNAs in response to glucose (Surosky et al., 1994). Normally SPO13 mRNA degradation accelerates about twofold in response to a high glucose signal (2%), but this response is blocked in ume5 mutants. However, Ume5p is not thought to contribute to high glucose-mediated degradation of the Ip mRNA (Cereghino and Scheffler, 1996). Hence, we examined the role of Ume5p in the transduction of a low glucose signal (0.02%). Gluconeogenic mRNA degradation did accelerate in response to this signal, even in the ume5 mutant (Fig. 7). However, PCK1 degradation rates were consistently slower in the ume5 mutant compared with its isogenic parent. Although this effect was not large, it was reproducible. Therefore, although Ume5p is not essential for accelerated gluconeogenic mRNA degradation in response to a low glucose signal, it does seem to play a positive role in this process. This further supports the existence of distinct glucose signalling pathways for the differential activation of gluconeogenic and Ip mRNA degradation in yeast.
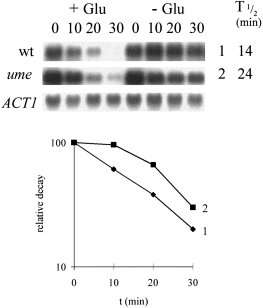
Ume5p promotes gluconeogenic mRNA degradation in response to a low glucose signal. Relative PCK1 mRNA decay was measured using Northern analysis in mid-exponential cultures growing on YPL (Experimental procedures): 0.02% glucose ( + Glu); H2O control (–Glu). W303-1B (wild-type), 1 (♦); YAB630 (ume5), 2 (▪). Full genotypes of these strains are provided in Table 1. Representative ACT1 blots for the W303–1B cultures are shown and relative PCK1 mRNA half-lives in the presence of glucose are given.
Discussion
Two regulatory phenomena mediate the rapid clearance of the FBP1 and PCK1 mRNAs from the yeast cell after the addition of glucose: transcriptional repression combined with accelerated mRNA degradation (Mercado et al., 1994). The transcription of these gluconeogenic genes is strongly repressed, even in response to a very low glucose signal (Yin et al., 1996). Ras-cAMP and Mig1p-dependent pathways are thought to impose FBP1 and PCK1 repression in response to medium and high glucose signals respectively, whereas a Mig1p-independent pathway appears to operate in response to low glucose signals (Yin et al., 1996). However, the glucose signalling pathways responsible for triggering accelerated gluconeogenic mRNA degradation had not been characterized. Therefore, in this study we compared the pathways involved in post-transcriptional regulation of the FBP1 and PCK1 mRNAs with those that are known to mediate their transcriptional regulation in response to glucose. We have confirmed our prediction that the glucose signalling pathways that regulate these post-transcriptional and transcriptional events share common components.
A similar signal(s) triggers transcriptional repression and accelerated mRNA degradation of FBP1 and PCK1 (Fig. 3). Low levels of glucose or fructose trigger both responses, but other carbon sources do not. Furthermore, both of these rapid responses require an active sugar kinase, but further glycolytic metabolism is not necessary (Yin et al., 1996; Fig. 3). This is consistent with the observation that glucose repression is not triggered by glycolytic flux, but rather by glucose availability (Meijer et al., 1998). Some long-term glucose responses appear to depend upon the generation of downstream glycolytic intermediates. For example, the increase in some glycolytic enzyme levels takes hours to elaborate, and is dependent on increasing concentrations of C3 metabolites (Boles and Zimmermann, 1993; Boles et al., 1993; Müller et al., 1995). However, it is generally believed that short-term glucose responses, such as gene regulation at the transcriptional and post-transcriptional levels, do not require glycolytic metabolism beyond sugar phosphorylation (Yin et al., 1996; Gancedo, 1998; Gonçalves and Planta, 1998; Johnston, 1999), and this view is reinforced by our data.
The nature of the glucose signal(s) has not been established. Sugar phosphates represent one potential intracellular signal. However, ATP levels also increase after the addition of glucose (Van Aelst et al., 1993). AMP is now viewed as an attractive candidate for the intracellular signal in yeast, with high AMP levels possibly activating glucose derepression (Johnston, 1999). This view is supported by the observation, in mammalian systems, that AMP and ATP concentrations regulate an AMP-activated protein kinase that controls key metabolic enzymes (Hardie and Carling, 1997). Interestingly, AMPK α-subunits are closely related to Snf1p, suggesting close links between AMP/ATP levels and catabolite repression in yeast (Hardie and Carling, 1997; Johnston, 1999). However, several of our observations are not consistent with the idea that low AMP concentrations might activate accelerated gluconeogenic mRNA degradation. First, the response was triggered by low levels of glucose (<0.01%; Fig. 2), which would not be expected to cause significant changes in AMP levels. Second, the response did not require glycolytic metabolism (Fig. 2), but this would presumably be required to raise ATP levels after glucose addition. Third, the response remained intact in one type of TPS1 mutant (fdp1;Fig. 4), yet ATP levels decrease after the addition of glucose to strains lacking a functional Tps1p (Van Aelst et al., 1993). However, these observations are consistent with a model invoking sugar phosphates as the intracellular signal. Gancedo (1998) points out that different mechanisms might operate for short- and longer-term glucose signalling. For example, sugar phosphates and AMP might provide short- and longer-term metabolic signals respectively.
The Ras-cAMP pathway not only triggers transcriptional repression of the gluconeogenic genes (Yin et al., 1996), it can activate accelerated gluconeogenic mRNA degradation (Fig. 6). Low glucose signals do not generate a significant cAMP spike (Beullens et al., 1988). Hence, as discussed before (Yin et al., 1996), the activation of the Ras-cAMP pathway by exogenous cAMP is likely to mimic a high glucose signal. Consistent with this, cAMP stimulated the degradation of the Ip mRNA (Fig. 6), an mRNA that does not respond to low glucose signals (Fig. 2). Therefore, an alternative low glucose signalling pathway must exist (Fig. 8). This view is supported by the observation that low glucose signals still triggered accelerated gluconeogenic mRNA degradation in a ras1/2, tpk1/2/3, bcy1 mutant (Fig. 6). This alternative pathway would appear to be the low glucose signalling pathway proposed by Johnston and co-workers (Özcan and Johnston, 1995, 1999; Özcan et al., 1996a; Johnston, 1999), as the effect upon gluconeogenic mRNA degradation was dependent on the low glucose sensor, Snf3p (Fig. 5). The response is blocked in a snf3 mutant, and hence Snf3p seems to define the major low glucose signalling pathway that triggers accelerated gluconeogenic mRNA degradation. Snf3p could mediate this effect either directly, by activating a signalling cascade, or indirectly, by promoting expression of the glucose transporters required for the generation of the intracellular signal (Özcan and Johnston, 1999). Our data do not distinguish between these possibilities.
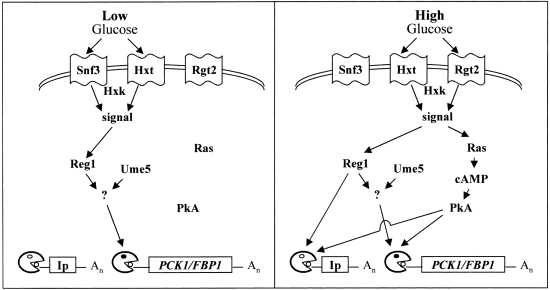
Model for the differential regulation of gluconeogenic and Ip mRNA degradation in response to high and low glucose signals. This model rationalizes the data presented in this paper with current glucose signalling models (Yin et al., 1996; Gancedo, 1998; Johnston, 1999). According to this model, high concentrations of glucose ( > 1%) are detected by the high glucose sensor, Rgt2p. The sugar is internalized (via hexose transporters; Hxt) and phosphorylated (mainly by Hxk2p) to generate an intracellular signal (sugar phosphate or AMP/ATP concentration). This high glucose signal activates Reg1p, which in turn stimulates the degradation of gluconeogenic and Ip mRNAs. The high glucose signal also activates the Ras-cAMP pathway, which affects both types on mRNA. Low (≈ 0.02%) glucose signals are detected by the low glucose sensor, Snf3p. The intracellular signal, which is dependent on a sugar kinase (Glk1p, Hxk1p or Hxk2p), activates Reg1p, which in turn stimulates gluconeogenic mRNA degradation. Activation of Reg1p by a low glucose signal is not sufficient to trigger Ip mRNA degradation. According to this model, an Ume5p-regulated factor (?) lies on a gluconeogenic-specific branch of the Snf3p-Reg1p pathway as Ume5p does not modulate Ip mRNA degradation (Cereghino and Scheffler, 1996). The Snf3p–Reg1p and Ras-cAMP signalling pathways also bifurcate to mediate the transcriptional regulation of glucose responsive genes (not shown).
Downstream components on the Snf3p pathway, such as Grr1p and Rgt1p, were not required for accelerated gluconeogenic mRNA degradation (Fig. 5). This is consistent with the existence of a common low glucose signalling pathway that bifurcates to regulate gene transcription in the nucleus and mRNA degradation in the cytoplasm. Furthermore, one would not expect components of the high glucose signalling pathway (Johnston, 1999) to be involved in activating accelerated gluconeogenic mRNA degradation in response to a low glucose signal. This idea was confirmed by the observation that the response was not dependent on the high glucose sensor, Rgt2p (Fig. 5).
Reg1p appears to be required for accelerated gluconeogenic mRNA degradation, as a low glucose signal failed to trigger this response in the reg1 mutant (Fig. 5). Hence, Reg1p probably acts downstream of the Snf3p sensor on the major low glucose signalling pathway (Fig. 8). Interestingly, a reg1 null mutation has also been reported to block Ip mRNA destabilization by a high glucose signal (Cereghino and Scheffler, 1996). Therefore, Reg1p would appear to play a role in the post-transcriptional regulation of yeast mRNAs in response to both low and high glucose signals (Fig. 8). Reg1p has been placed on the high glucose signalling pathway (Johnston, 1999; Özcan and Johnston, 1999) on the basis that (i) reg1 mutants display HXT derepression in the presence of high glucose (Özcan and Johnston, 1995), and (ii) the Glc7-Reg1p protein phosphatase negatively regulates Snf1/4p in the presence of high glucose concentrations (Tu and Carlson, 1995; Gancedo, 1998). However, this does not exclude an additional role for Reg1p in low glucose signalling.
Glucose-responsive mRNAs are differentially affected by ume5 mutations. Ip mRNA destabilization is not blocked in a ume5 strain (Cereghino and Scheffler, 1996). In contrast, both sporulation-specific (Surosky et al., 1994) and gluconeogenic mRNAs (Fig. 7) are affected by ume5 mutations. Ume5p appears to promote the degradation of these mRNAs in the presence of glucose. UME5, which also is known as SRB10, SSN3, GIG2 and NUT7, encodes a serine/threonine protein kinase of the Cdc28p family (Kuchin et al., 1995; Liao et al., 1995). Srb10 is a component of the mediator complex for the RNA polymerase II holoenzyme (Liao et al., 1995), and an srb10 null mutation partially releases Ssn6p–Tup1p repression, derepresses SUC2 and impairs activation of GAL10 (Kuchin and Carlson, 1998). Therefore, Ume5p probably acts indirectly to mediate its effects on mRNA stability. For example, Ume5p might regulate the expression of a glucose-responsive factor that modulates the degradation of gluconeogenic and sporulation-specific mRNAs. This putative Ume5p-sensitive factor presumably lies on the Snf3–Reg1p low glucose pathway (Fig. 8). The activity of this factor is not entirely dependent upon Ume5p because deletion of UME5 slows, but does not block, accelerated gluconeogenic mRNA degradation (Fig. 7).
To summarize, our data show that there are similarities in the post-transcriptional regulation of the gluconeogenic and Ip mRNAs, for example in the involvement of Reg1p and Ras-cAMP signalling. However, there are also clear differences between these mRNAs, such as their differential responses to ume5 mutations. Most significantly, the Ip mRNA responds only to high glucose signals, whereas the gluconeogenic mRNAs are also sensitive to low glucose signals. The exquisite sensitivity of the PCK1 and FBP1 mRNAs to glucose might reflect the need for tight repression of gluconeogenesis when the opposing pathway, glycolysis, is activated. In contrast, the TCA cycle is required for the provision of important metabolic precursors during both gluconeogenic and glycolytic growth. Hence, one would not expect the Ip mRNA, which encodes the iron subunit of succinate dehydrogenase, to be so sensitive to low concentrations of glucose. Our second major observation is that multiple glucose signalling pathways control yeast genes at post-transcriptional as well as transcriptional levels. These pathways provide an elegant regulatory network that allows the differential activation of genes in response to high or low glucose signals, thereby allowing the yeast cell to adapt appropriately to these different conditions.
Experimental procedures
Strains and growth conditions
Yeast strains were grown at 30°C in YPL or YPG (1% yeast extract, 2% peptone containing 3% lactate or glycerol respectively). Unless stated otherwise, glucose and other carbon sources were added to a final concentration of 0.02% (Yin et al., 1996), and cAMP was added to a final concentration of 7 mM (Wilson and Tatchell, 1988; Ulaszewski et al., 1989; Baroni et al., 1994; Tokiwa et al., 1994).
The S. cerevisiae strains used in this study are described in Table 1. All markers were tested prior to and after each experiment. The ume5 mutant, YAB630, was generated by PCR-amplifying the LEU2 gene with short flanking homologies to the 5′ and 3′ ends of the UME5 ORF, using the primers 5′-
| Strain | Genotype | Source or reference |
|---|---|---|
| 9520T4C | MAT a , ade1, trp1, his2, met14, ura3, pgi1 | Yeast Genetic Stock Centre |
| BKp11 | MAT a /MATalpha, cup1/CUP1, gal2/GAL2, leu2 LEU − 2, mal/MAL, met8/MET8, trp1/TRP1, (tps1/TPS1 | Bell et al. (1992) |
| BKp11-12Aa | (tps1 | Bell et al. (1992) |
| BKp11-12Ba | TPS1 | Bell et al. (1992) |
| BKp11-12Ca | TPS1 | Bell et al. (1992) |
| BKp11-12Da | (tps1 | Bell et al. (1992) |
| D308-3 | MATalpha, ade1, trp1, his2, met14, hxk1, hxk2, glk1 | Yeast Genetic Stock Centre |
| DFY333 | MATalpha, lys2, MAL6, FDP1 | Bañuelos and Fraenkel (1982) |
| DFY334 | MATalpha, lys2, MAL6, fdp1 | Bañuelos and Fraenkel (1982) |
| J104 | MAT a , ade8, his3, leu2, trp1, ura3, pde2::HIS3 | Nikawa et al. (1987) |
| PD6595 | MAT a , ade8, his3, leu2, trp1, ura3, tpk1::URA3, tpk2 w1 , tpk3::TRP1, bcy1::LEU2, ras1::HIS3, ras2::ADE8 | Durnez et al. (1994) |
| W303-1A | MAT a , ade2, his3, leu2, trp1, ura3 | Thomas and Rothstein (1989) |
| W303-1B | MATalpha, ade2, his3, leu2, trp1, ura3 | Thomas and Rothstein (1989) |
| YAB630 | MATalpha, ade2, his3, leu2, trp1, ura3, ume5::LEU2 | This study |
| YKC21 | MATalpha, ade2, his3, leu2, trp1, ura3, pyk1::URA3 | Crimmins (1995); A. Pearce et al. (in preparation) |
| YKC24 | MATalpha, ade2, his3, leu2, trp1, ura3, pfk1::HIS3, pfk2::TRP1 | Crimmins (1995); A. Pearce et al. (in preparation) |
| YM2955 | MATalpha, ade2, his3, leu2,lys2, ura3, grr1::LEU2 | Özcan and Johnston (1995) |
| YM4127 | MAT a , ade2, his3, leu2,lys2, trp1, tyr1, ura3 | Özcan and Johnston (1995) |
| YM4509 | MAT a , ade2, his3, leu2, lys2, trp1, tyr1, ura3, rgt1( | Özcan and Johnston (1995) |
| YM4552 | MAT a , ade2, his3, leu2, lys2, trp1, tyr1, ura3, reg1::LEU2 | Özcan and Johnston (1995) |
| YM4714 | MAT a , ade2, his3, leu2,lys2, trp1, tyr1, ura3, snf3::hisG | Özcan et al. (1996b) |
| YM4817 | MAT a , ade2, his3, leu2,lys2, trp1, tyr1, ura3, rgt2::HIS3 | Özcan et al. (1996b) |
- a . Four spores derived from the same tetrad from BKp11.
CCCAATT GgATcc AGGCCGCCTAGTTTTGACGGGAGGAGA
GAGAAATGTATAATGGCAAGG CTCGAGGAGAACTTCTAG and 5′-
GGTAAAGT AAGCTT AAAGCATGCTTGTCCCTTCCTCCCG
CGG AATGATACCATGTAGCAAGG CGACTACGTCGTAAGGCCG (UME5 sequences in italics; LEU2 sequences, underlined; BamHI and HindIII sites for cloning the cassette, in bold; mutations to introduce the BamHI site, lower case). The resultant ume5::LEU2 cassette was transformed directly into W303-1B (Baudin et al., 1993) and, in parallel, was cloned into pBS-KS− (Stratagene) for storage. Correct integration of the ume5::LEU2 cassette at the UME5 locus was confirmed using Southern analysis (not shown). The pyk1 null mutant, YKC21, was generated by integrating a pyk1::URA3 cassette at the PYK1 locus in W303-1B. Similarly, the pfk1,pfk2 double null, YKC24, was generated by the sequential integration of pfk1::HIS3 and pfk2::TRP1 cassettes into the W303-1B genome. The correct integration of these cassettes was confirmed by Southern blotting, and the lack of expression from the target loci was confirmed by Northern analysis (Crimmins, 1995; Pearce et al., 1999).
mRNA analysis
To analyse yeast mRNA decay, cells were grown in YPL or YPG to mid-exponential phase (OD600 = 0.4), whereupon 1,10-phenanthroline was added (t = 0) and cells harvested at various times thereafter (Santiago et al., 1986; Brown, 1994). Glucose or other supplements were added at t = 0. RNA was prepared (Schmitt et al., 1990), electrophoresed on formaldehyde–agarose gels (Lehrach et al., 1977), transferred to nylon membranes (Thomas, 1980), UV fixed, and hybridized with gel-purified, random-primed probes (Feinberg and Vogelstein, 1983) under conditions of probe excess (Moore et al., 1991). The FBP1 probe was a 1.9 kb HindIII–XbaI fragment from pJJ5 (de la Guerra et al., 1988; Mercado et al., 1994), the PCK1 probe was a 1.3 kb HindIII–SalI fragment from pJJ1 (Stucka et al., 1988; Mercado et al., 1994), the ACT1 probe was a 1.5 kb BamHI–HindIII fragment from pSPACT9 (Bettany et al., 1989; Moore et al., 1991), and the Ip probe was a 568 bp PstI–XbaI fragment from the SDH2 locus (Lombardo et al., 1990) that was PCR amplified and cloned into pBS-KS−. Northerns were autoradiographed and then signals quantified directly by phosphorimaging, using a Bio-Rad GS-525 Molecular Imager®. FBP1, PCK1 and Ip mRNA levels were measured relative to the ACT1 mRNA to correct for differences in RNA loading between samples (Moore et al., 1991; Yin et al., 1996). There were variations in basal mRNA degradation rates in different strain backgrounds. For example, in the absence of glucose, the absolute half-life of the PCK1 mRNA ranged from about 15 to 45 min in the strains analysed that had doubling times of between 2 and 5 h (not shown). To correct for this, ‘relative decay’ rates were analysed. At each time point, the abundance of an mRNA in the presence of glucose (or an alternative supplement) was measured relative to its abundance in the control culture to which H2O was added. The data are plotted as a percentage of t = 0 values. mRNA half-lives are presented in minutes, relative to the ACT1 mRNA loading control. Errors in mRNA half-life measurements were less than ±20%, in line with previous studies (LaGrandeur and Parker, 1999). All experiments were performed at least twice, and only reproducible observations are reported.
Acknowledgements
We thank Dan Fraenkel, Mark Johnston and Johan Thevelein, for providing strains. We thank Gregor Gilfillan for help with the construction of the ume5Δ mutant. Also, we are grateful to Alex Chacko, Johan Thevelein, Joris Winderickx, Jean François and Immo Scheffler for helpful discussions. Z.Y. was supported by a grant (1/G06078), and L.H. by a studentship (92301444) from the Biotechnology and Biological Sciences Research Council.


