
A landscape approach to examining spatial patterns of limnological variables and long-term environmental change in a southern Canadian lake district
Summary
1. We explored patterns of limnological variables (physical, chemical and biological) with relation to landscape position (expressed as lake order) in 86 study lakes located on shield bedrock in south-central Ontario, Canada.
2. Using anovas with lake order as the categorical variable, landscape position explained significant amounts of variation in major ion chemistry, physical and catchment characteristics, hypolimnetic oxygen, and community composition in algal (diatom, chrysophyte) and invertebrate (chironomid) assemblages preserved in surficial sediments. Several nutrient variables (TP, total phosphorus and TN, total nitrogen) and dissolved organic carbon did not have significant relationships with lake order.
3. The strongest relationships with lake order (as a fraction of variation explained in anovas) included silica concentrations (r2 = 0.40) and SO4 (r2 = 0.29) concentrations, surface area (r2 = 0.50) and hypolimnetic oxygen (r2 = 0.29).
4. Bedrock geology (carbonate metasedimentary versus non-carbonate bedrock) had strong influences on spatial gradients of pH and major ion chemistry. It was difficult to separate geological influences from spatial influences on limnological variables in this study, as drainage patterns in the region are highly influenced by surface features of underlying geological formations because of the very thin glacial till or exposed bedrock that exists in most catchments.
5. Patterns of limnological variables indicated that low-order, headwater lakes had the lowest concentrations of major ions, and, from algal inferences of pH change, had been most susceptible to acidic deposition. High-order, downstream lakes were larger and deeper, and had higher concentrations of hypolimnetic oxygen, indicating that optimal lake trout habitat was primarily located in high-order lakes.
6. Variance partitioning analyses indicated that lake order as a metric of landscape position explained comparable portions of community variation in algal and invertebrate assemblages compared with geographic position (latitude, longitude) and Cartesian coordinate position (e.g. x, y, x2, y2, etc.) metrics. Lake order explained more community variation in chironomid assemblages compared with other landscape metrics, possibly because of the strong relationships between lake order and lake morphometry variables.
Introduction
Ecological phenomena display spatial and temporal patterns, and numerous ecological theories and models incorporate the importance of spatial and temporal structure in ecosystems (Legendre & Fortin, 1989; Chase & Leibold, 2002). In aquatic ecological theory, there has been increasing and more sophisticated examination of spatial patterns of environmental data, ranging from micro-scale to catchment-scale analysis (Allan & Johnson, 1997; Johnson & Goedkoop, 2002), however much of the focus has been on stream systems (Soranno et al., 1999). Examination of larger-scale, regional data sets has been important in determining responses of lake systems to environmental shifts such as climate change (e.g. Benson et al., 2000; Webster et al., 2000). Only recently have limnologists focused on examining lakes connected across a landscape to analyse patterns of lake characteristics (Soranno et al., 1999).
Lakes situated along a landscape gradient can vary in characteristics such as water chemistry, for example because of phenomena such as the increasing relative importance of groundwater into a lake's hydrologic budget as one moves down a chain of lakes (Kratz et al., 1991; Webster et al., 1996). Given the range of physical and chemical characteristics of lakes that change along a landscape gradient, the importance of lake location has received relatively little attention when examining biological characteristics, such as community assemblage composition of lake populations (Lewis & Magnuson, 2000).
Kratz et al. (1997) noted that, within a lake district, lakes in close proximity to each other might be quite different. The erratic drainage patterns common to shield bedrock areas, which are overlain by thin glacial tills, makes it difficult to use spatial position as a descriptor of ‘connectedness’ between lakes. Soranno et al. (1999) also noted that the landscape position concept in limnological analyses could benefit from considering lake networks as dendritic rather than longitudinal. A resolution to this may be found in the ‘lake continuum’ concept (Kratz et al., 1997), which is an extension of the more-studied river continuum concept (Vannote et al., 1980). The lacustrine equivalent of stream order, lake order (Kratz et al., 1997; see Methods for brief description of lake order determination), provides lake researchers with a novel perspective in analysing changes in lake characteristics along a gradient of landscape position.
The purpose of this paper is to explore patterns of physical, chemical and biological characteristics of lakes located in south-central Ontario, Canada, as a function of landscape position. A number of approaches have been developed to quantitatively examine spatial patterns of ecological data (Legendre, 1990). This study followed the recent methodology of Riera et al. (2000) in using the lake order concept as a surrogate of landscape position to explore landscape patterns of limnological characteristics in the lake district of south-central Ontario, Canada. We conducted statistical analyses in a similar fashion on similar variables, where possible, to facilitate comparisons with the northern Wisconsin, U.S.A., lake district analysed in Riera et al. (2000). We possessed biological assemblage data that facilitated additional analyses where we compared the ability of lake order to explain spatially-structured variation in aquatic communities (algal and invertebrate), relative to more conventional spatial variables such as latitude and longitude, and a cubic equation of x and y Cartesian coordinates of study sites (e.g. x, y, xy, x2, y2, x2y, xy2, x3, y3; x and y values first re-scaled to range −1 to +1; sensuPinel-Alloul, Niyonsenga & Legendre, 1995).
Landscape position can influence a lake's response to environmental perturbations (e.g. drought: Webster et al., 1996; Kratz et al., 1997) because of the correlation of landscape position with lake chemical and physical characteristics (e.g. catchment size). There may also be landscape patterns to human disturbance of lakes, such as increased boat traffic in larger lakes low in the landscape (Reed-Anderson et al., 2000). With these former points in mind, our present study included additional analyses that explored landscape patterns of biological and chemical change to stressors such as acidic deposition and anthropogenic eutrophication, as inferred by subfossil assemblages of algae and invertebrates.
Methods
Study area and determination of lake order
The study region is located in south-central Ontario, Canada, in a forested (mixed deciduous-coniferous) lake district. Our 86 study lakes were previously examined in several paleoecological studies (Hall & Smol, 1996; Wilkinson, Hall & Smol, 1999; Quinlan & Smol, 2000, 2001, 2002; Paterson et al., 2001, 2002), and nearly all drain into the Muskoka Lakes and the Gull River (Fig. 1). Study lakes were originally selected to span a broad range of trophic state, lake size and depth, with pH values generally above six (Hall & Smol, 1996). Additional lakes were later added to include more lakes with anoxic hypolimnia (Quinlan & Smol, 2002). Most study lakes are circumneutral with low concentrations of humics. Major ion chemistry and lake morphometry represent typical values of most lakes accessible by road or short canoe portage (several hundred metres) in this lake district. The region is largely underlain by granitic Precambrian shield bedrock, with a generally thin surface layer of soil and glacial till (Chapman & Putnam, 1984). Most of the surface geology consists of bare rock and shallow till, with sand and clay plains originating from glacial Lake Algonquin in the Muskoka River drainage area, and thicker layers of spillway deposits associated with the Gull and Burnt rivers in the east (Chapman, 1975). Drainage patterns reflect local, small-scale surface topography and larger-scale heterogeneity in bedrock geology, including belts of carbonate metasedimentary rocks located in the Gull and Burnt river drainages (Ontario Geological Survey, 1991). In this study, 26 of the 86 lakes are peripheral to or located on these belts, including many of the furthest downstream lakes. These lakes will typically have higher pH values and higher concentrations of all major ions.
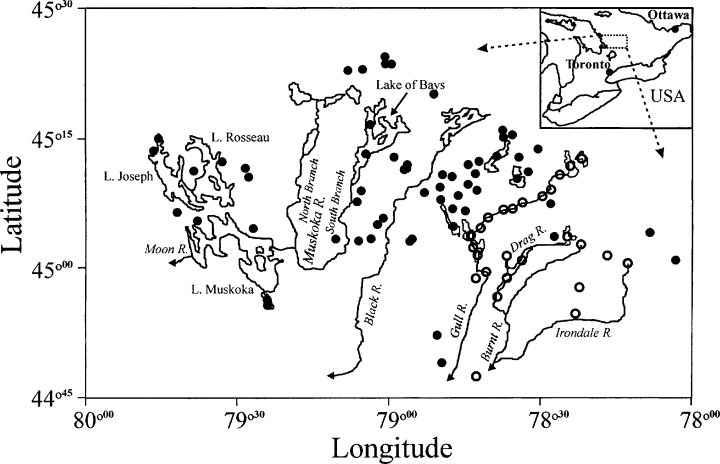
Location of the 86 study lakes in south-central Ontario, Canada. Large lakes and major watercourses within the study area are shown. Hollow symbols (for this and following figures) represent lakes whose catchments contain carbonate metasedimentary bedrock.
We used the definition of lake order as that described in Riera et al. (2000), where lake order is defined as the order of the stream that drains the lake. To give a brief example, a headwater stream is assigned an order value of one. If it joins with another headwater stream, the resultant stream has an order value of two. When two (or more) streams intersect, order values increase only when the two (or more) streams have equal order values; otherwise, the resultant stream retains the value of the highest order stream at the intersection point. For example, if an order one stream intersects with an order two stream, the resultant stream has an order of two. Consequently, in determining lake order, a lake that has two headwater streams flowing into it will have a lake order value of two, as its outlet would have a stream order value of two. Stream order was measured using 1 : 50 000 scale topographic maps (most recent edition available from Natural Resources Canada). Similar to Riera et al. (2000), a headwater lake with no streams flowing into it was differentiated from other headwater lakes by being assigned a lake order of 0. All our lakes had permanent outlets, unlike Riera et al. (2000), which included many closed-basin lakes with either absent or ephemeral inlets and outlets. Lake order in our lakeset ranged from 0 to 5 (Fig. 2). One lake, Clear Lake, does not show any outlet streams on a 1 : 50 000 map, but field sampling notes describe the presence of an outlet, so it was assigned a lake order of zero. From other studies, we know that some lakes we assigned a lake order of zero, such as Harp Lake, do have small inlet streams. However, other than the change to Clear Lake, for consistency, because extensive surveys were not undertaken at each site, we relied on details from 1 : 50 000 topographic maps. These results demonstrate that, as Riera et al. (2000) pointed out, the assignment of lake order values is sensitive to map scale and accuracy.
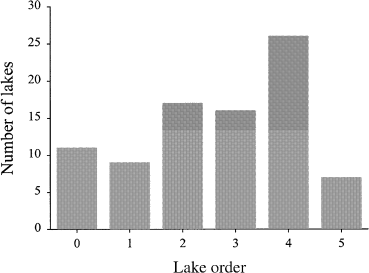
Number of lakes in the data set ranked according to lake order.
Limnological variables
The following categories of variables were analysed for landscape patterns: lake catchment and physical characteristics, major ion chemistry, nutrients and dissolved organic carbon, hypolimnetic oxygen and temperature, and biological assemblages of algae (subfossil diatoms, chrysophyte cysts, scaled chrysophytes) and invertebrates (subfossil chironomids) from surface sediments (summarised in Table 1). These surface sediments generally represent the uppermost 1 cm of sediment from a central flat area in the deepwater basin from each lake. Ranges of selected variables are given in Table 2.
| Variable | Symbols, units and comments | Source |
|---|---|---|
| Physical and catchment characteristics | ||
| Catchment area | WA; hectares (ha) | |
| Altitude Drainage area : surface area | Metres above sea level; m a.s.l. Ad : Ao; area of upstream water bodies removed from calculation of ratio | DESC* and calculated from 1 : 50 000 topographic maps (Natural Resources Canada), and bathymetric maps (Ontario Ministry of Natural Resources) |
| ‘Immediate’ drainage area : surface area | Adi : Ao; Upstream drainage areas removed from calculation of ratio | |
| Lake volume | m3 | DESC |
| Hypolimnetic volume | Top of hypolimnion calculated as in Lind & Davalos-Lind (1993); m3 | |
| Percent of lake volume as hypolimnion | Hypolimnetic vol./lake vol. × 100; % | |
| Maximum depth | Zmax; m | |
| Mean depth | Zmean; lake volume/surface area; m | |
| Surface area | SA; ha | |
| Maximum distance | MD; Longest open distance across lake surface that passes over deep basin (Molot et al., 1992); km | |
| Basin shape | Z mean/SA0.5 | Equation from Nürnberg (1995) |
| Major ion chemistry | ||
| pH | DESC | |
| Alkalinity | ALKTI; mg Ca CO3 L−1 | |
| Conductivity | COND; μS cm−1 at 25 °C | |
| Calcium | Ca; mg L−1 | |
| Magnesium | Mg; mg L−1 | |
| Sulphate | SO4; mg L−1 | |
| Nutrients, DOC and cottages | ||
| Total phosphorus | TP at spring overturn; μg L−1 | |
| Total nitrogen | TN; mg L−1 | |
| Dissolved organic carbon | DOC; mg L−1 | |
| Dissolved silica | Si; mg L−1 | |
| Si : TP | ||
| TN : TP | ||
| Cottage density | Cottages per m3 × 104 | Wilkinson et al. (1999) |
| Hypolimnion | ||
| Average bottom oxygen | One metre above bottom sediment; mg O2 L−1 | Quinlan & Smol (2001) |
| Average bottom temperature | °C | |
| Average volume-weighted oxygen | avgVWHO; mg O2 L−1 | |
| Average volume-weighted temperature | avgVWHT; °C | |
| Biological data | ||
| Subfossil surface sediment assemblages | Sample scores of first and second axes of ordinations (PCA or CA) | This study |
| Change in assemblage (ordinations) | Difference in sample score of present-day and predisturbance assemblages | |
| Change in assemblage (similarity matrix) | Bray-Curtis distance between present-day and predisturbance assemblages | |
| Inferred change in pH | Diatoms (DIAT-pH); chrysophyte cysts (CYST-pH); scaled chrysophytes (SCALE-pH) | Hall & Smol (1996); Wilkinson et al. (1999); Paterson et al. (2001) |
| Inferred change in TP | Diatoms; DIAT-TP; μg L−1 | Hall & Smol (1996) |
| Inferred change in avgVWHO | Chironomids; CHIR-avgVWHO; mg O2 L−1 | Quinlan & Smol (2002) |
- *Dorset Environmental Sciences Centre (Ontario Ministry of the Environment).
| Variable | N | Transformation | Mean (SD) | Minimum | Maximum |
|---|---|---|---|---|---|
| Physical and catchment characteristics | |||||
| Surface area | 86 | Log | 243.1 (307.9) | 5.4 | 1675.0 |
| Catchment area | 86 | Log | 14 249 (23 451) | 34 | 96 127 |
| Ad : Ao | 86 | Log | 69.8 (128.2) | 1.0 | 703.6 |
| Adi : Ao | 82 | Log | 5.8 (6.4) | 0.7 | 39.7 |
| Altitude | 86 | None | 331.7 (48.4) | 223.5 | 426.8 |
| Lake volume (×106 m3) | 86 | Log | 385.0 (744.6) | 3.7 | 4427.9 |
| Hypolimnetic volume (×106 m3) | 86 | Log(x + 1) | 194.4 (431.7) | 0 | 2329.0 |
| Percent hypolimnion | 86 | None | 32.3 (18.8) | 0.0 | 77.2 |
| Maximum distance | 86 | Log | 2.28 (1.86) | 0.17 | 11.45 |
| Zmax | 86 | Log | 30.4 (18.4) | 4.5 | 93.0 |
| Basin shape | 86 | Log | 9.44 (5.39) | 0.83 | 29.69 |
| Major ion chemistry | |||||
| pH | 84 | None | 6.69 (0.53) | 5.61 | 7.98 |
| Alkalinity | 84 | Log | 8.28 (8.90) | 0.40 | 40.30 |
| Conductivity | 84 | Log | 46.4 (21.9) | 18.4 | 119.0 |
| Ca | 84 | Log | 4.88 (3.51) | 1.52 | 15.40 |
| Mg | 84 | Log | 1.06 (0.49) | 0.47 | 2.30 |
| SO4 | 84 | Log | 7.37 (1.22) | 3.70 | 9.40 |
| Nutrients, DOC and cottages | |||||
| TP | 86 | Log | 9.5 (7.4) | 2.7 | 44.7 |
| Si | 84 | Sqrt | 0.96 (0.46) | 0.11 | 2.18 |
| Si : TP | 84 | None | 133.1 (87.2) | 10.7 | 409.7 |
| TN | 84 | Sqrt | 242.0 (72.8) | 130.0 | 541.3 |
| TN : TP | 84 | None | 31.9 (11.3) | 7.6 | 61.7 |
| DOC | 85 | Log | 3.59 (1.04) | 1.69 | 6.40 |
| Cottage density | 54 | None | 0.60 (0.38) | 0.00 | 1.87 |
| Hypolimnion | |||||
| avg. bottom oxygen | 80 | Log(x + 1) | 2.9 (3.0) | 0.0 | 10.9 |
| avg. volume-weighted hypolimnetic oxygen | 80 | None | 5.1 (3.0) | 0.0 | 10.6 |
| avg. bottom temperature | 80 | Log | 5.4 (1.6) | 4.7 | 16.0 |
| avg. volume-weighted hypolimnetic temperature | 80 | Sqrt | 6.4 (1.6) | 4.0 | 16.5 |
Most limnological data were provided from the limnological database of the Dorset Environmental Sciences Centre (DESC) of the Ontario Ministry of the Environment. Major ion chemistry represents either ice-free season averages or concentrations at spring overturn [details of water chemistry sampling are given in Hall & Smol (1996) and Quinlan & Smol (2001)]. Total phosphorus values represent concentrations at spring overturn. Hypolimnetic oxygen and temperature measurements are ’end-of-summer’ (close to 1st of September) averages, representing 1–4 years of sampling data (see Quinlan & Smol (2001) for details of hypolimnetic oxygen and temperature data).
Aquatic communities
Our biological data represent subfossil assemblages from surficial lake sediments. Details of subsampling, enumeration and identification of subfossil assemblages of diatoms, scaled chrysophytes, chrysophyte cysts and chironomids are given in Hall & Smol (1996), Wilkinson et al. (1999), Paterson et al. (2001) and Quinlan & Smol (2001). Biological assemblages were summarised from the sample scores of the first two axes of an ordination of biological data. Exploratory ordinations using detrended correspondence analysis (DCA) suggested that linear-based ordination methods (principal components analysis; PCA) were more appropriate for the chrysophyte cyst, scaled chrysophyte and chironomid data sets, while unimodal-based ordination methods (correspondence analysis; CA) were more appropriate for the diatom data set (all ordinations based on square root transformed data).
Numerical analyses
Similar to Riera et al. (2000), we used several different methods to determine the strength of the relationships between limnological variables and lake order. In this present study we attempted to perform similar statistical tests and present results in similar fashion as Riera et al. (2000) to facilitate easier comparison of results between the northern Wisconsin lake district and the south-central Ontario lake district. We produced box plots and dot plots to visually examine the distribution of values of a variable amongst different lake orders. Additionally, we performed anovas with lake order as a categorical variable to determine if there was a statistically significant difference in values of a limnological variable amongst lake orders. If an anova was statistically significant (P < 0.05), differences amongst individual lake orders were determined using Tukey post hoc tests. For both anovas and Tukey tests, we used resampling statistics with 999 bootstrap cycles to determine statistical significance (Resampling StatsTM v 3.16, Resampling Stats Inc, Arlington, VA, USA). Although resampling statistics are designed to eliminate the need for data sets to meet the assumptions of parametric statistical tests such as anovas, we nonetheless tested the difference in results using transformed and untransformed data. In any case, P-values for anovas were identical, although the statistical significance of some Tukey tests varied. An examination of a plot between q-values (from Tukey tests) and its associated P-value suggested that, for several between-group comparisons in the untransformed data set, there was some discrepancy (a test with a small q value and a highly significant P-value, or a large q value with a non-significant P-value). There were no discrepancies noted in plots using transformed variables, therefore all subsequent numerical analyses used transformed data (transformations given in Table 2).
Canonical variates analysis (CVA) is similar to multivariate analysis of variance (manova), and was used to determine which linear combination of statistically significant (as identified using anovas) limnological variables (catchment descriptors excluded) best discriminated amongst lake orders. CVA, using backward elimination procedures, was performed using CANOCO for Windows© v 4.0 (ter Braak & Šmilauer, 1998). Variables that were highly correlated with other variables were sequentially removed until variance inflation factors (VIFs) were <10. A high VIF (e.g. >20) indicates that a variable is multicollinear with other variables and has no unique contribution to a multiple regression (ter Braak & Šmilauer, 1998). Variables that represented ratios (e.g. percentage of hypolimnion, percentage of hypoxic, basin shape) and redundant physical variables that were highly correlated (e.g. Zmean, hypolimnetic thickness, maximum distance) were also excluded from the CVA. The ’global’ CVA was conducted on 78 of the 86 study lakes, as two lakes lacked full water chemistry data and six lakes were polymictic, to which no meaningful value of hypolimnetic oxygen or temperature could be assigned.
Long-term changes (comparisons between present-day and ’predisturbance’ ca. 1850 subfossil assemblages for this geographical region) in algal and invertebrate assemblages were also examined to determine if they followed any landscape patterns. Long-term changes in biological communities were quantified using three different methods. The first method involved calculating changes in ordination sample scores (ordinations centred and standardised) between present-day assemblages and predisturbance assemblages for each lake. For each indicator group, a PCA or CA ordination of present-day assemblages was performed, with predisturbance assemblages included passively in the ordinations (results nearly identical to plotting predisturbance samples actively – data not shown). The coordinate position of the predisturbance assemblage in an ordination biplot along axis one was subtracted from the coordinate position of the present-day assemblage on that axis, to calculate a net change in ordination score along that axis. This calculation was also performed for axis two ordination scores. Results are from ordinations scaled to focus on inter-sample distances; results are nearly identical to ordinations scaled to focus on inter-species correlations (data not shown). Ordinations were performed using CANOCO v 4.0 (ter Braak & Šmilauer, 1998). In the second method we calculated a Bray-Curtis distance from the comparison of predisturbance and present-day assemblages from each lake for each indicator group. The third method involved examining landscape patterns of long-term water chemistry changes as inferred using paleoecological techniques. These paleoecologically-inferred long-term changes included: change in pH and total phosphorus (TP) using diatoms (Hall & Smol, 1996); change in pH using scaled chrysophytes (Paterson et al., 2001) and chrysophyte cysts (Wilkinson et al., 1999); and change in hypolimnetic oxygen using chironomids (Quinlan & Smol, 2002).
Variance partitioning analysis (VPA) was performed to compare the lake order concept as a descriptor of biological spatial structure to more conventional spatial metrics, such as latitude-longitude and terms from an x-y coordinate polynomial (Borcard, Legendre & Drapeau, 1992; Borcard & Legendre, 1994; Pinel-Alloul et al., 1995). Ordinations (redundancy analysis (RDA) for chrysophytes and chironomids, canonical correspondence analysis (CCA) for diatoms) were performed using CANOCO for Windows v 4.0 (ter Braak & Šmilauer, 1998). Environmental and spatial variables found to explain significant (P < 0.05) amounts of variation of biological data in RDAs or CCAs constrained to a single variable at a time (lake order represented by binary dummy variables) were retained for further analyses. Ordinations were performed with all significant environmental or spatial variables, and variables were sequentially removed that were highly correlated with other variables (VIF > 10). The relative importance of environmental and spatial influences on biological assemblages, for each spatial descriptor, was determined through a series of constrained and partially constrained RDAs or CCAs (see p. 745 of Hall et al. (1999) for detailed methodology). Further analyses were performed on the reduced data set of 35 lakes for which data were available for all four indicator groups.
Further spatial analyses were performed on the biological assemblages. To determine if spatial autocorrelation existed in the four different assemblages, Mantel tests were performed using the software program Mantel Non-Parametric Test Calculator v 2.0 (Liedloff, 1999). A Bray-Curtis distance was used for the biological distance matrix. Geographical distance between sites in kilometres was used for the spatial distance matrix. Mantel tests were conducted with 1000 randomisations. Similar to variance partitioning analyses, Mantel tests were also performed on the reduced common data set of 35 lakes.
Results
Single-variable anovas
anovas indicated that there was statistically significant landscape structure for numerous chemical, physical and biological variables (Tables 3 and 4). The strongest links between landscape position and selected variables included water chemistry variables such as silica concentration (r2 = 0.40), lake morphometry descriptors such as surface area (r2 = 0.50) and hypolimnetic oxygen concentrations (r2 = 0.29) (Table 3). The major direction of variation (first axis of a PCA or CA ordination) for all four biological assemblages showed significant landscape patterns (r2 = 0.29–0.48), while a few long-term inferred changes in assemblages and lakewater pH also showed significant patterns (Table 4). For many variables, order five lakes were not significantly different from low-order lakes, reflecting low statistical power because of the small sample size for this lake order (as small as three for some biological variables).
| Variable | F-stat | r 2 | P-value (anova) |
|---|---|---|---|
| Physical and catchment characteristics | |||
| Surface area | 15.698 | 0.50 | <0.001*** |
| Catchment area | 108.620 | 0.87 | <0.001*** |
| Ad : Ao | 24.727 | 0.61 | <0.001*** |
| Adi : Ao | 1.110 | 0.06 | 0.359ns |
| Altitude | 1.925 | 0.11 | 0.090marg |
| Lake volume | 11.639 | 0.42 | <0.001*** |
| Hypolimnetic volume | 7.831 | 0.33 | <0.001*** |
| Percent hypolimnion | 2.152 | 0.12 | 0.075marg |
| Maximum distance | 5.968 | 0.27 | <0.001*** |
| Zmax | 4.271 | 0.21 | 0.002** |
| Basin shape | 4.307 | 0.21 | 0.002** |
| Major ion chemistry | |||
| pH | 3.226 | 0.17 | 0.014* |
| Alkalinity | 3.095 | 0.17 | 0.008** |
| Conductivity | 3.327 | 0.18 | 0.006** |
| Ca | 4.374 | 0.22 | <0.001*** |
| Mg | 5.678 | 0.27 | <0.001*** |
| SO4 | 6.4824 | 0.29 | <0.001*** |
| Nutrients, DOC and cottages | |||
| TP | 1.110 | 0.06 | 0.361ns |
| Si | 10.275 | 0.40 | <0.001*** |
| Si : TP | 9.699 | 0.38 | <0.001*** |
| TN | 1.703 | 0.10 | 0.158ns |
| TN : TP | 0.902 | 0.05 | 0.480ns |
| DOC | 2.051 | 0.12 | 0.081marg |
| Cottage density | 1.620 | 0.14 | 0.184ns |
| Hypolimnion | |||
| avg. bottom oxygen | 7.673 | 0.34 | <0.001*** |
| avg. volume-weighted hypolimnetic oxygen | 5.930 | 0.29 | <0.001*** |
| avg. bottom temperature | 0.451 | 0.03 | 0.825ns |
| avg. volume-weighted hypolimnetic temperature | 0.409 | 0.03 | 0.849ns |
- ns: not significant (P > 0.1); marg: marginally significant (P < 0.1); *P < 0.05; **P < 0.01; ***P < 0.001.
| Indicator group and variable | F-stat | r 2 | P-value (anova) |
|---|---|---|---|
| Diatoms | |||
| CA axis 1 score | 8.837 | 0.48 | <0.001*** |
| CA axis 2 score | 0.783 | 0.08 | 0.568ns |
| Change in CA axis 1 score | 3.450 | 0.26 | 0.009** |
| Change in CA axis 2 score | 0.289 | 0.03 | 0.932ns |
| Bray-Curtis distance | 0.400 | 0.04 | 0.859ns |
| Inferred change in TP | 1.126 | 0.11 | 0.366ns |
| Inferred change in pH | 1.761 | 0.16 | 0.118ns |
| Chrysophyte cysts | |||
| PCA axis 1 score | 3.916 | 0.29 | 0.002** |
| PCA axis 2 score | 3.315 | 0.26 | 0.005** |
| Change in PCA axis 1 score | 2.468 | 0.20 | 0.049* |
| Change in PCA axis 2 score | 1.800 | 0.16 | 0.114ns |
| Bray-Curtis distance | 0.540 | 0.05 | 0.764ns |
| Inferred change in pH | 1.598 | 0.14 | 0.176ns |
| Scaled chrysophytes | |||
| PCA axis 1 score | 4.902 | 0.34 | 0.002** |
| PCA axis 2 score | 0.534 | 0.05 | 0.771ns |
| Change in PCA axis 1 score | 2.311 | 0.22 | 0.058marg |
| Change in PCA axis 2 score | 1.019 | 0.11 | 0.415ns |
| Bray-Curtis distance | 3.263 | 0.28 | 0.012* |
| Inferred change in pH | 2.627 | 0.24 | 0.043* |
| Chironomids | |||
| PCA axis 1 score | 4.480 | 0.30 | 0.005** |
| PCA axis 2 score | 1.707 | 0.14 | 0.146ns |
| Change in PCA axis 1 score | 2.525 | 0.19 | 0.039* |
| Change in PCA axis 2 score | 0.942 | 0.08 | 0.472ns |
| Bray-Curtis distance | 0.884 | 0.08 | 0.473ns |
| Inferred change in avgVWHO | 1.037 | 0.10 | 0.401ns |
- ns: not significant (P > 0.1); marg: marginally significant (P < 0.1); *P < 0.05; **P < 0.01; ***P < 0.001.
Limnological variables
All physical and catchment characteristics (Table 1), with the exception of Adi : Ao, had significant or marginally significant relationships to lake order (Fig. 3, Table 3). Morphometric variables were also significantly related to lake order (Fig. 4, Table 3), with high order lakes generally being larger and deeper. For most morphometric variables, there was little difference in values amongst order zero to order two lakes, and little difference between order three to order five lakes.
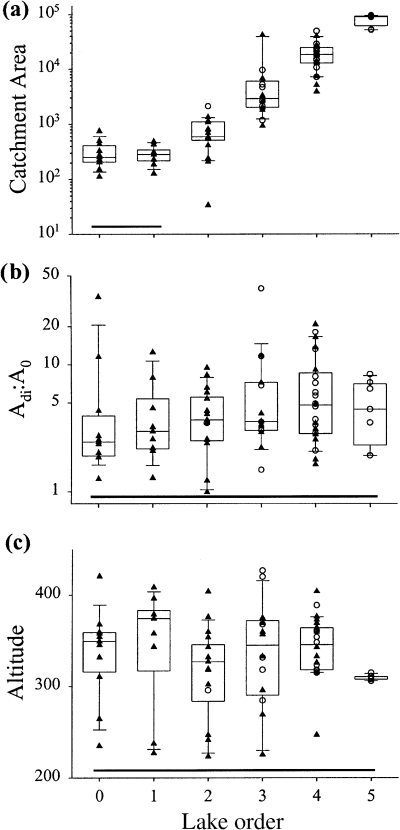
Scatter- and box-plots of selected catchment descriptors: (a) catchment area (ha); (b) immediate drainage area : lake surface area ratio (Adi : Ao); (c) lake altitude (m a.s.l). For all similar graphs, lake orders connected with a solid line (just above the x axis) are not significantly different, and dotted lines represent non-contiguous lake orders that are not significantly different.
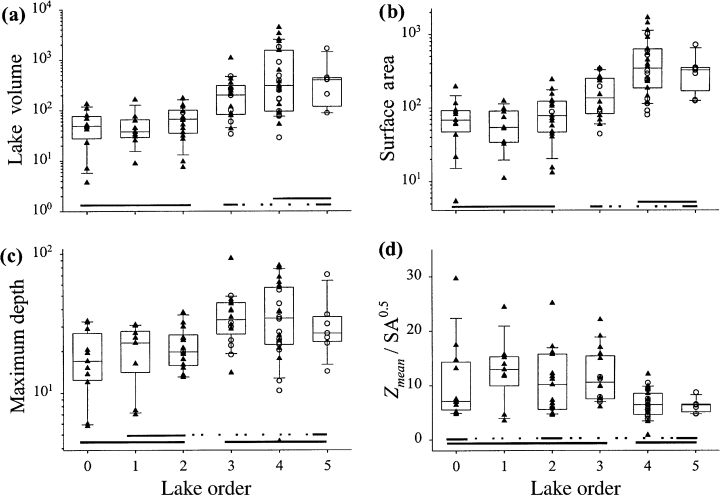
Scatter- and box-plots of selected physical descriptors: (a) lake volume (m3 × 106); (b) surface area (ha); (c) maximum depth (m); (d) basin shape (Zmean/SA0.5).
All ions had a significant relationship to lake order (Fig. 5, Table 3), and increased in downstream lakes. However, most of the largest values were associated with order three, four and five lakes located on the metasedimentary belt. Lake orders zero and one generally had the lowest average ion concentrations. Additional two-factor anovas (using SYSTAT®, Systat Software Inc.) were performed with lake order and bedrock geology (carbonate versus non-carbonate bedrock) as factors to determine if major ion variables still had a signficant relationship with lake order once the influence of bedrock geology had been partialled out. Analyses indicated that only calcium retained a significant (partial P < 0.05) relationship with lake order. All other major ion variables were non-significant (partial P > 0.05), although both pH and sulphate concentrations were marginally significant (pH partial P = 0.07, SO4 partial P = 0.08).
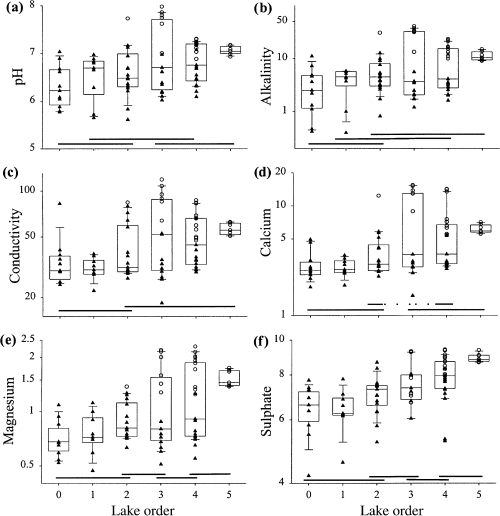
Scatter- and box-plots of selected water chemistry descriptors: (a) pH; (b) alkalinity (mg CaCO3 L−1); (c) conductivity (μS cm−1 at 25 °C); (d) calcium (mg L−1); (e) magnesium (mg L−1); (f) sulphate (mg L−1).
There were no discernible or significant landscape patterns in algal nutrients [total nitrogen (TN), TP, TN : TP; (Fig. 6, Table 3)]. Silica concentrations (Si) significantly increased in downstream lakes, consequently, the ratio of silica to phosphorus concentrations also increased in higher order lakes (Fig. 6, Table 3). Concentrations of dissolved organic carbon (DOC) were similar amongst lake orders, although there was a marginally significant (P < 0.10) landscape pattern (Fig. 6, Table 3). Intensity of anthropogenic nutrient input (estimated as the number of cottages per unit lake volume) did not increase as one moved from low- to high-order lakes (Fig. 6).
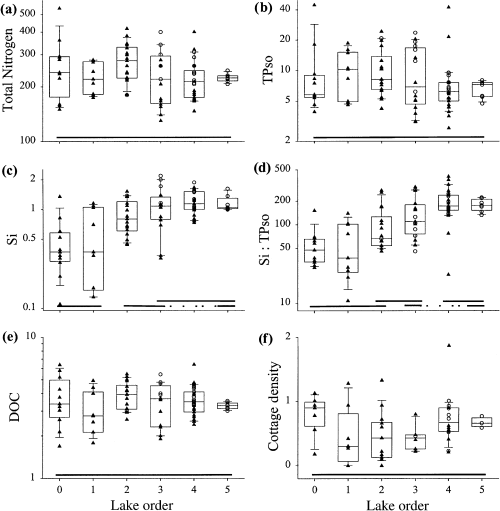
Scatter- and box-plots of selected nutrient, dissolved organic carbon (DOC) and anthropogenic impact descriptors: (a) total nitrogen (TN, mg L−1); (b) total phosphorus (TP, μg L−1); (c) silica (Si, mg L−1); (d) silica : TP ratio; (e) DOC (mg L−1); (f) cottages (m−3 × 10⁴).
Average bottom oxygen concentrations were generally <3 mg L−1 O2 in low-order lakes (zero to two), and the higher order lakes (three to five) had numerous lakes with bottom oxygen >4 mg L−1 O2 (Fig. 7, Table 3). Landscape patterns were not as strong for average volume-weighted hypolimnetic oxygen, however patterns were similar to bottom oxygen in that there was a transition from generally low to high values between lake order two and three.
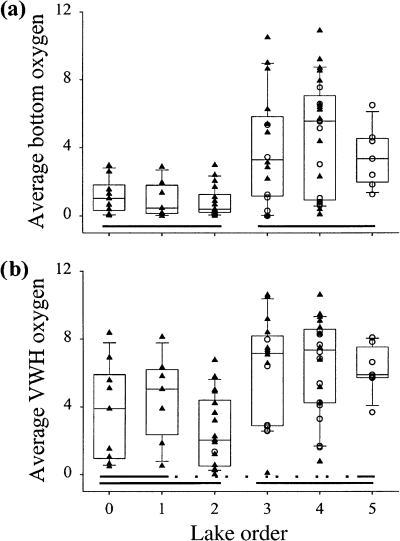
Scatter- and box-plots of hypolimnetic oxygen descriptors: (a) average bottom oxygen (mg O2 L−1); (b) average volume-weighted hypolimnetic oxygen (mg O2 L−1).
Global canonical variates analysis
Canonical variates analysis using backward elimination indicated that major ion chemistry (pH, conductivity, K, NO3, SO4), Si, lake morphometry (surface area and Zmax) and hypolimnetic oxygen concentration (average volume-weighted hypolimnetic oxygen) were the strongest variables distinguishing between lake orders. High-order lakes had higher solute concentrations, and were larger with well-oxygenated hypolimnia (Fig. 8). The position of the centroid score of each lake order indicates that order four and five lakes (left-hand portion of CVA ordination) have very similar values for limnological variables, while there is a progression to the right of the CVA ordination towards low-order lakes. Although CVAs performed using bedrock type as a co-variable excluded most water chemistry variables, results were very similar in terms of lake order grouping in the biplot (data not shown).
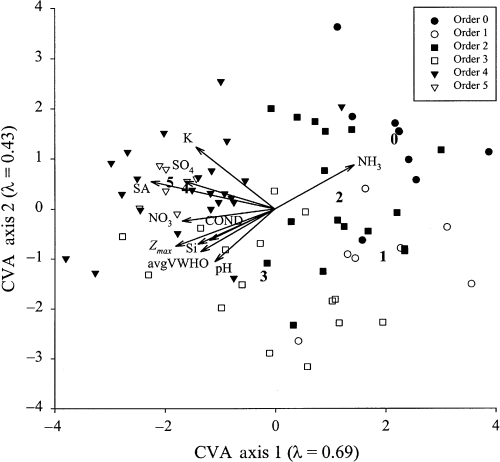
Sample scores of thermally-stratified study lakes (n = 78) in a canonical variates analysis (CVA) of environmental variables that significantly differentiate amongst lake orders. Numbers within the biplot indicate the centroid of each categorical group (lake order) in the CVA.
Biological communities
The assemblages of all indicator groups showed significant landscape patterns along primary axes of variation (first axis of a PCA or CA ordination; Table 4). These patterns were strongest for the diatoms and the scaled chrysophytes, followed by the chrysophyte cysts and the chironomids (Fig. 9). Chrysophyte cysts also had a significant landscape pattern to the second axis (Table 2), whereas the other groups did not. Examples of individual taxa that showed strong landscape patterns included: Cyclotella michiganiana Skvortzow (Fig. 10a), a planktonic diatom with a circumneutral pH optimum (Dixit et al., 1993; Hall & Smol, 1996; Dixit, Dixit & Smol, 2002); Mallomonas acaroides var. muskokana Nicholls (Fig. 10b), a scaled chrysophyte with an low-pH optimum (Cumming, Smol & Birks, 1992; Paterson et al., 2001; Dixit et al., 2002); and Heterotrissocladius Spärk (Fig. 10c), a chironomid taxon associated with deep, cold, well-oxygenated lakes (Walker et al., 1991; Quinlan & Smol, 2001).
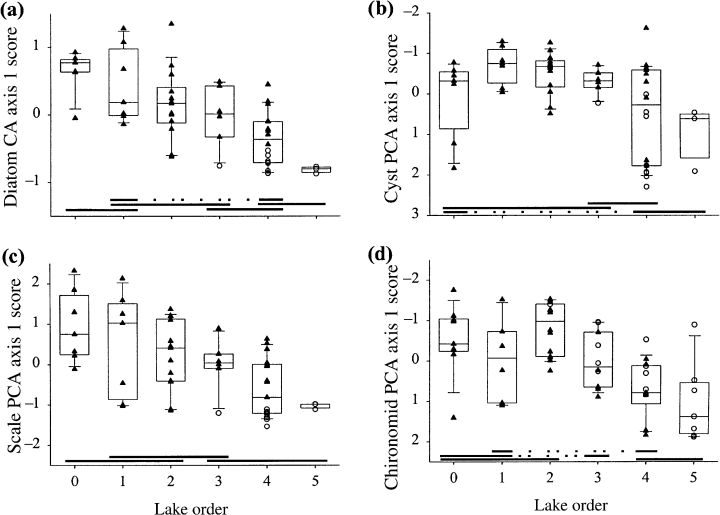
Scatter- and box-plots of CA or PCA ordination axis 1 sample scores of sediment assemblages: (a) diatoms; (b) chrysophyte cysts; (c) scaled chrysophytes; (d) chironomids.
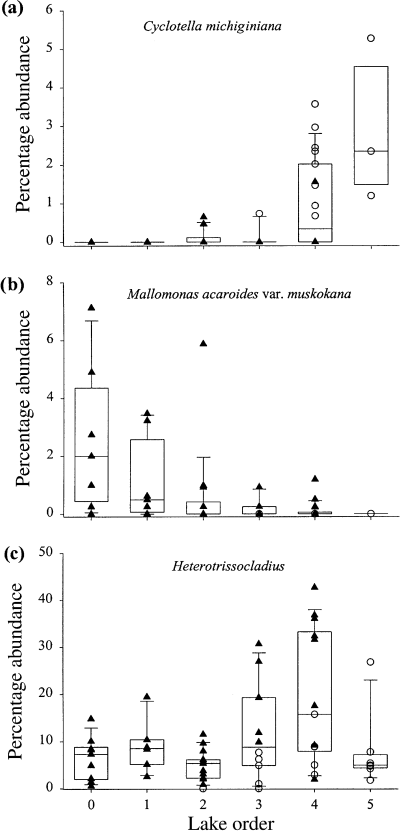
Relative abundances (%) of selected diatom, scaled chrysophyte and chironomid taxa along a lake order gradient: (a) Cyclotella michiginiana Skvortzow; (b) Mallomonas acaroides var muskokana Nicholls; (c) Heterotrissocladius Spärck.
There were also significant landscape patterns in long-term changes in biological assemblages, measured as a comparison of present-day and predisturbance sample scores of an ordination of biological data (Fig. 11, Table 4). Using a Bray-Curtis similarity measure between present-day and predisturbance samples, anovas indicated that only scaled chrysophyte assemblages showed a significant landscape pattern in long-term community composition change (Fig. 12, Table 4). Paleoecologically-inferred changes in water chemistry indicate that there were almost no significant landscape patterns of change in inferred pH, TP or deepwater oxygen (Fig. 13, Table 4). Interestingly, headwater lakes recorded the greatest diatom-inferred declines in pH and TP (Fig. 13), while high-order lakes recorded the largest chironomid-inferred increases in average volume-weighted hypolimnetic oxygen (Fig. 13).
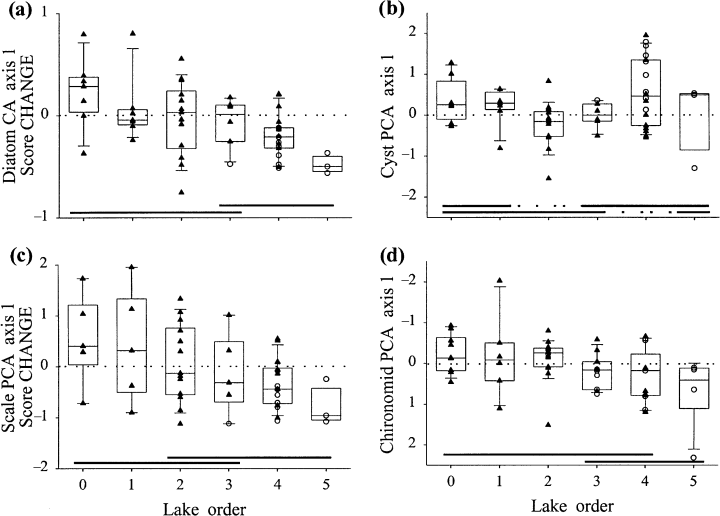
Scatter- and box-plots of long-term changes in CA or PCA ordination axis 1 sample scores of sediment assemblages: (a) diatoms; (b) chrysophyte cysts; (c) scaled chrysophytes; (d) chironomids.
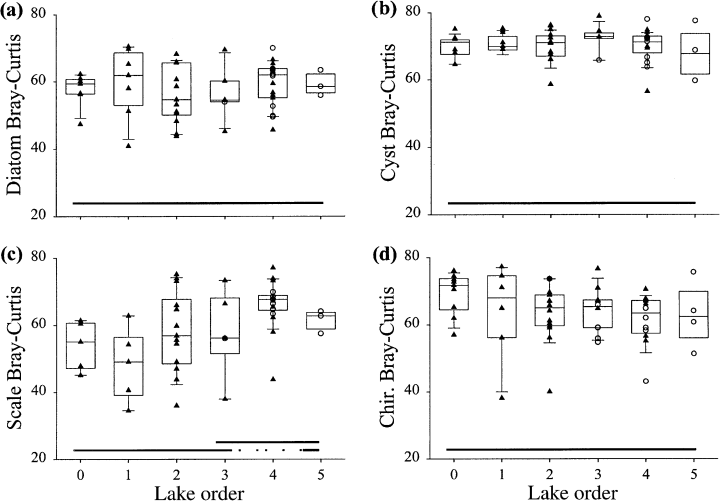
Scatter- and box-plots of long-term changes in sediment assemblages, based on Bray-Curtis distance: (a) diatoms; (b) chrysophyte cysts; (c) scaled chrysophytes; (d) chironomids.
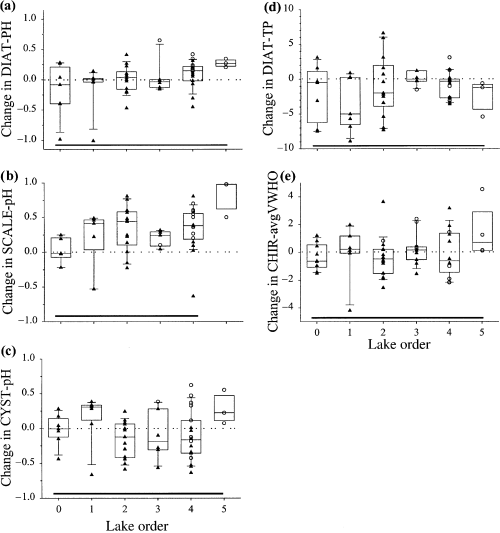
Scatter- and box-plots of inferred long-term changes in: (a) diatom-inferred TP (μg L−1), (b) diatom-inferred pH, (c) chrysophyte cyst-inferred pH, (d) chrysophyte scale-inferred pH, and (e) chironomid-inferred avgVWHO (mg O2 l−1).
Comparison of spatial descriptors in ecological data sets
Environmental variables retained for VPA were very similar amongst the four indicator groups (Table 5). While pH has been previously identified as the primary explanatory variable for diatom and chrysophyte assemblages in this region (Hall & Smol, 1996; Wilkinson et al., 1999; Paterson et al., 2001), it was not retained in analyses for this study as it was highly correlated with most of the water chemistry variables (i.e. it had a high VIF). If ordinations were manipulated to retain pH and remove other variables with lower VIFs, results were virtually identical to the VPA results presented (Table 5). In order to keep statistical protocols identical for all indicator groups, the original results that removed pH as a collinear variable were retained.
| Variable group | Diatom | Chrysophyte cyst | Chrysophyte scale | Chironomid |
|---|---|---|---|---|
| Environmental | Alkalinity, DOC, Na, K, SO4, NH3, NO3, Si, TP, surface area, Zmax | Alkalinity, conductivity, DOC, K, SO4, NH3, NO3, TP, surface area, Zmax | Alkalinity, DOC, Na, K, SO4, NH3, NO3, Si, TP, surface area, Zmax | DOC, Ca, Mg, Na, K, SO4, NH3, NO3, TN, TP, surface area, Zmax, avg. volume-weighted hypolimnetic oxygen |
| Spatial | Latitude, longitude x, y, x2, y2, lake order | Latitude, longitude x, y, xy, x2y, xy2, y2, lake order | Latitude, longitude x, y, xy, x2y, lake order | x 2 y, lake order |
All three spatial descriptors (i.e. latitude–longitude, x–y polynomial, lake order) were significant in constrained ordinations except in the chironomid data sets, where neither latitude nor longitude and very few x and y terms explained significant amounts of variation (Table 5). The number of significant x and y terms retained for VPA (after removal of terms with VIFs > 10) ranged from a low of zero for the reduced chironomid data set to a high of six for the chrysophyte cyst data sets (Table 5). Ordinations constrained to lake order only were highly significant (P < 0.003) for all indicator groups.
Environmental variables, on average, explained three to 12 times the variation in the four indicator groups, compared with spatial variables (Table 6). Of the spatial descriptors, latitude and longitude explained the least amount of ’pure’ spatial variation compared with other metrics, although it still explained significant portions of variation in some data sets (Table 6). In the full data sets, the x–y polynomial and latitude–longitude were significant descriptors for the diatom and chrysophyte cyst data sets, whereas the x–y polynomial was significant for the scaled chrysophyte data set, and lake order was significant for the chironomid data set. In the reduced data set of 35 lakes in common to all indicators, fewer descriptors were significant, but lake order became more important for both the scaled chrysophytes and the chironomids.
| Taxa and spatial descriptor | All lakes§ | Common data set (n = 35) | ||||||
|---|---|---|---|---|---|---|---|---|
| Envt | Envt–space | Space | Unex | Envt | Envt–space | Space | Unex | |
| Diatom | ||||||||
| x–y equation | 32.1 | 9.4 | 7.7 | 50.8 | 42.3 | 4.9 | 8.2 | 44.6 |
| Latitude–longitude | 36.5 | 5.1 | 4.2 | 54.2 | 43.5 | 3.7 | 5.9 | 46.9 |
| Lake order | 32.6 | 9.0 | 7.8 | 50.6 | 34.6 | 12.6 | 12.0 | 40.8 |
| Cyst | ||||||||
| x–y equation | 21.0 | 6.3 | 13.5 | 59.2 | 26.1 | 8.6 | 16.5 | 48.8 |
| Latitude–longitude | 23.0 | 4.4 | 5.6 | 67.0 | 30.1 | 4.6 | 5.8 | 59.5 |
| Lake order | 23.3 | 4.1 | 9.5 | 63.1 | 27.6 | 7.1 | 12.8 | 52.5 |
| Scale | ||||||||
| x–y equation | 38.0 | 15.7 | 7.0 | 39.3 | 29.0 | 20.6 | 12.5 | 37.9 |
| Latitude–longitude | 43.8 | 10.0 | 3.4 | 42.8 | 40.9 | 8.8 | 5.4 | 44.9 |
| Lake order | 42.0 | 11.8 | 7.2 | 39.0 | 35.0 | 14.7 | 13.6 | 36.7 |
| Chironomid | ||||||||
| x–y equation | 34.0 | 1.5 | 1.6 | 62.9 | NA | NA | NA | NA |
| Latitude–longitude | NA | NA | NA | NA | NA | NA | NA | NA |
| Lake order | 27.2 | 8.2 | 9.3 | 55.3 | 29.4 | 10.3 | 15.6 | 44.7 |
- †Determined using Monte Carlo permutation tests; ‡Using variance partitioning techniques, one cannot assess the statistical significance of environment–space interactions or unexplained variance; §n = 54 for diatoms and chrysophyte cysts, n = 53 for scaled chrysophytes, n = 59 for chironomids; NA: no variables in category significant (P < 0.05) in constrained ordinations.
Mantel tests on all lakes indicated that only the scaled chrysophyte assemblages exhibited significant spatial autocorrelation, but that this relationship was weak (diatoms: n = 54, r = 0.113, P = 0.082; cysts: n = 54, r = 0.053, P = 0.218; scales: n = 53, r = 0.132, P = 0.027; chironomids: n = 59, r = −0.001, P = 0.495). Mantel tests on a common, reduced data set (n = 35) showed that chrysophyte cysts had weak but marginally significant, and scaled chrysophytes had a weak but significant, spatial autocorrelation (diatoms: r = 0.094, P = 0.162; cysts: r = 0.149, P = 0.062; scales: r = 0.152, P = 0.015; chironomids: r = 0.022, P = 0.358).
Discussion
Geological influences
Many of the patterns in water chemistry variables that appeared to have strong relationships to a lake order gradient can be partly attributable to bedrock geology. Higher values of pH and major ion concentrations in high-order lakes were largely in carbonate metasedimentary lakes. Results such as these might be considered as confounding in an analysis of lake order and limnological variables. However, it must be emphasised that, because of the very thin surface till and the underlying shield bedrock in this region, landscapes are highly resistant to weathering and large-scale drainage patterns are strongly influenced by surface features of factors such as bedrock heterogeneity. Therefore, it should be considered a normal consequence, as opposed to an ‘anomaly,’ that the watercourses that contain the majority of the high-order lakes in this study happen to closely follow the carbonate metasedimentary belts in this region.
Physical and chemical variables
Both Riera et al. (2000) and our study showed a pattern where downstream lakes were larger and deeper, but the relationships were stronger in our study than those in Riera et al. (2000). Similarly, we found statistically similar, albeit weaker, patterns for lake and hypolimnetic volume, and also for the percentage of lake volume in the hypolimnion. As the ratio of ’immediate’ drainage area to lake area did not significantly change with lake order, the relatively shallower basin shape of downstream lakes (lower Zmean/SA0.5) does not reflect landscape patterns of surface geomorphology.
Associated with these patterns of larger and deeper lakes, hypolimnetic oxygen levels also increased in downstream lakes. This deepwater oxygen pattern has important implications for landscape structuring of populations of the keystone species lake trout (Salvelinus namaycush Walbaum), especially for juvenile trout. While there are several headwater and intermediate lakes with usable adult lake trout habitat (temperature <15.5 °C and >4 mg L−1 O2; Ontario Ministry of the Environment and Ministry of Natural Resources (OMOE/OMNR), 1993), juvenile trout habitat is thought to be deeper and constrained by adult trout presence because of cannibalism (Warren Dunlop, OMNR, pers. comm.). There are more downstream lakes with bottom oxygen levels greater than the critical limit for juvenile trout (>2 mg L−1 O2; Evans, Casselman & Willox, 1991) compared with headwater lakes. This suggests that, based on environmental constraints of temperature and oxygen, lake trout habitat may extend across much of the landscape of south-central Ontario, but optimal habitat for adult lake trout (<10 °C and >6 mg L−1 O2; OMOE/OMNR, 1993), and habitat important for development and recruitment of juvenile trout, may be more concentrated in downstream, higher order lakes. Lake trout habitat in headwater lakes is restricted primarily by morphometry, as shallow lakes provide little cold-water temperature refuge. Moreover, upstream lakes with thin hypolimnia and higher sediment area: water volume ratios experience more anoxic or hypoxic conditions. For many headwater lakes the usable lake trout habitat at end-of-summer conditions was restricted to metalimnetic depths, where phenomena such as metalimnetic oxygen maxima provided a narrow stratum of habitat (Quinlan, unpublished data). For several lakes where multiple years of oxygen and temperature data were available, thermocline depth varied by several metres and during some years there was no usable lake trout habitat (data not shown). Therefore, such narrow fish habitat limited to the metalimnion may be considered quite marginal, and ‘consistent’ habitat is found mostly in the deeper, downstream lakes.
Solute concentrations in the south-central Ontario lake district are generally a function of precipitation because of negligible groundwater flow (Webster et al., 2000). With geological influences taken into account, the generally weak relationships between major ion chemistry and lake order in our study, compared with Riera et al. (2000), reflect the weaker influence of groundwater flow in south-central Ontario compared with northern Wisconsin. The strongest landscape pattern in a water chemistry variable (in terms of r2) was for SO4 concentrations, and may reflect the historical importance of large-scale acidic deposition on lake chemistry in south-central Ontario. Given that lake volume increased by roughly two orders of magnitude across the lake order gradient, while catchment area increased by three orders of magnitude, it would be expected that SO4 export from headwater catchments (Eimers & Dillon, 2002) would increase SO4 concentrations in downstream, high-order lakes.
While there were no measurements of water colour in our study, DOC strongly controls the thermocline depth of lakes in south-central Ontario and is highly correlated with light attenuation (Perez-Fuentetaja et al., 1999). There is only a weak landscape pattern to DOC and lakewater optical properties in our study, similar to findings in Riera et al. (2000). These patterns suggest that DOC imports into downstream lakes with larger catchments may be balanced by increased in-lake DOC losses because of longer water residence times (Schindler et al., 1992).
Both our study and that of Riera et al. (2000) showed a strong landscape gradient to silica concentrations, which suggests that it acts as a non-reactive weathering variable as opposed to a nutrient controlled by biological dynamics (Soranno et al., 1999) such as seasonal algal growth. The existence of a wide Si : TP gradient (range 10–400) suggests that interspecific competition may be important in structuring siliceous algal populations composed of species with differing abilities for nutrient uptake (Tilman, 1976), however this hypothesis cannot be explored further with our existing data.
Mass balance studies of TP in lakes (e.g. Hutchinson, Neary & Dillon, 1991; Dillon et al., 1994) assume that some portion of a lake's P-load is derived from upstream lakes and from precipitation. Our results suggest that, despite these two mechanisms, which should be more important in lakes with larger catchments and surface areas, there appears to be no landscape pattern of increasing TP concentrations in downstream lakes. As most of the TP in south-central Ontario lakes is associated with DOC, the same processes may regulate TP as DOC, with potential TP gains imported from upstream lakes balanced by increased in-lake TP losses in downstream lakes. High rates of nutrient retention (removal by deposition into sediments) in some of our lakes (Dillon, Reid & Evans, 1993) and biological dynamics (Riera et al., 2000) may reduce or remove the occurrence of landscape patterning of nutrient concentrations.
Whereas Riera et al. (2000) found greater human impact (cottage/resort density per kilometre shoreline) on downstream lakes, our cottage density variable was corrected for lake volume and may explain why we found no landscape pattern, as high-order lakes had greater volumes. In our field sites, there were numerous small headwater lakes with few or no cottages, while cottages surrounded the shorelines of many large, downstream lakes. As there was no observed landscape pattern in lake-volume-weighted cottage density, there was likely no landscape pattern of anthropogenic-P load into these lakes.
A continuum of lake environments
The ‘global’ CVA of physical and chemical variables illustrates that, similar to streams and rivers in the river continuum concept, environments gradually change along a lake order gradient (a lake continuum concept). There is a lack of sharp transitions between lake orders, even though some lake orders (e.g. four and five) are grouped in the CVA biplot. The direction of the environmental arrows, compared with the centroid means of each lake group, illustrate that one of the few noticeable transition points along the lake continuum occurs between lower order (zero to two) and higher order (three to five) lakes, and that there is no single environmental variable that clearly delineates this transition. The box-plots of most environmental variables also illustrate that there may be noticeable landscape patterns, however no variable shows clear changes from one lake order to the next (with the obvious exception of catchment area).
Biological variables
Our study also showed relatively strong relationships (r2 between 0.29 and 0.48) between lake order and biological variables, specifically ordination sample scores of algal and invertebrate assemblages preserved in lake sediments. Landscape patterns of biological assemblages were similar to those of physical and chemical variables, as low-order lakes tended to have similar community composition, with a transition at lake order three, whereas lake orders four and five had similar composition. Variance partitioning analyses suggested that, although space could influence significant variation in some biological communities (maximum influences of 7–14% in full data sets), lake-specific environmental variables explained much greater proportions of community structure (up to 23–44% in full data sets). Similarly, Johnson & Goedkoop (2002), also using variance partitioning analyses, found ecosystem-scale variables (e.g. lake chemistry, lake morphometry) explained roughly two times greater variation in littoral macroinvertebrate communities compared with geographic-scale variables (e.g. latitude, longitude). In our study, community structure explained by environment–space interactions (up to 6–16% in full data sets) reflects that some environmental variables were spatially structured, such as water chemistry variables (e.g. lower solute concentrations in headwater lakes). We should note, however, that similar to lake chemistry variables, we are underestimating landscape patterns of biological variability by not including isolated and ephemeral water bodies in our analyses, which may experience very different controls on community structure compared with permanent lakes (Wellborn, Skelly & Werner, 1996).
Long-term changes in algal assemblages and algal-inferred water chemistry reflect the regional changes that have occurred in lake chemistry in response to stressors such as acidic deposition (Paterson et al., 2001). Although algal-inferred patterns related to lake order are not significant, headwater lakes with lower present-day pH have generally suffered greater pH declines compared with downstream lakes, which generally experienced smaller pH declines or small pH increases. These headwater lakes were likely more susceptible because of their low acid neutralising capacity (ANC), as a result of low concentrations of major ions. Lakes associated with the downstream metasedimentary belt generally recorded algal-inferred increases in pH in almost every lake, likely because of effective alkalinity generation from neutralisation of precipitation acidity (Johnson et al., 2000).
These differences in pH trajectories for headwater versus downstream lakes are reflected in algal community ordination sample scores. Present-day algal communities were primarily structured along water chemistry gradients of pH and major ion concentrations, with changes in sample scores reflecting shifts from acidophilous assemblages to pH-indifferent and alkaliphilous assemblages. Predisturbance samples with positive sample scores, reflecting the low end of the pH/dilute major ion environments, have become more positive, reflecting decreases in pH, while samples with negative sample scores have become more negative, reflecting increases in pH. Changes in pH have likely affected phosphorus dynamics (Hall & Smol, 1996), as the greatest declines in diatom-inferred TP occurred in headwater lakes, similar to patterns of diatom-inferred pH changes. One interesting pattern in long-term shifts in assemblages in downstream lakes as a result of acidic deposition was recorded in the chrysophyte cyst assemblages, where a bimodal distribution in lake order four sample scores exists and strongly differentiated lakes located on and off the metasedimentary belt. This bimodal distribution does not occur in predisturbance samples. As this change appears to be partially-independent of geological influences (not all order four metasedimentary lakes showed the same shift in cyst assemblages), we are currently unable to identify the mechanism of this change.
Long-term changes in chironomid communities have only a weak landscape pattern, and reflect changes in deepwater oxygen. These changes have been influenced by hydrological management regimes imposed by human activity (Quinlan & Smol, 2002). Hydrological management also has a landscape pattern (data not shown), with greater human intervention occurring in downstream lakes. Briefly, many of the headwater lakes have natural hydrological regimes, while all downstream lakes have experienced increased lake levels because of dam construction. Consequently, these high-order lakes have experienced increases in hypolimnetic volume. These environmental changes are reflected in changes in chironomid communities as low-order lakes (with natural hydrological regimes) recorded mostly declines in sample scores (and chironomid-inferred hypolimnetic oxygen losses), while high-order lakes (with managed regimes) recorded mostly increases in sample scores (and inferred oxygen increases).
Bray-Curtis distances between predisturbance and present-day samples generally do not show landscape patterns, reflecting that current stressors on these lakes are not only active along primary directions of variation of biological assemblages (e.g. acidic deposition), but also along additional gradients (e.g. climate change, eutrophication, food web changes). The net impact of these multiple stressors acting on these aquatic ecosystems is that assemblages have apparently changed in a similar magnitude along the landscape.
Previous research examining broad landscape scales in northeastern U.S.A. has shown that the taxonomic richness of benthic invertebrate assemblages is more strongly correlated with lake morphometry (e.g. lake depth), compared with algal assemblages which are more correlated with water chemistry (e.g. pH) (Allen et al., 1999a). Additionally, small-bodied organisms with shorter life-cycles (e.g. algae) are more strongly correlated with small-scale, short time period phenomena (e.g. diatom blooms at spring overturn) compared with larger-bodied organisms with longer life cycles (e.g. benthic invertebrates) (Allen et al., 1999b). The correlation of environmental variables with the primary directions of variation in algal and chironomid assemblages in this study (data not shown) agree with these findings of Allen et al. (1999a,b). Although lake order was comparable with other spatial metrics in explaining variation in all assemblages, lake order was a substantially stronger explanatory variable in the chironomid analyses compared with latitude–longitude and x–y coordinates. This may be the result of the stronger relationship between lake morphometry and lake order, compared with water chemistry variables. Additionally, end-of-summer hypolimnetic oxygen was also an important variable structuring chironomid communities, and it represents a variable influenced by longer term, seasonal processes of physical and biological dynamics.
Overall, results suggest that lake order is a useful metric as it explains spatially-structured ecological variation to a comparable degree as other spatial metrics. Our results also suggest that lake order is a useful metric for landscape ecology in that, being ’directionless,’ it is free from artefacts because of spatial autocorrelation amongst assemblages. This benefit is likely more important on smaller scales, where drainage patterns can be erratic, especially in shield bedrock areas with thin surface soils. While lake order explained a significant portion of community variation in chironomid assemblages and slightly greater variation in diatom assemblages, compared with latitude–longitude and an x–y equation, it explained similar or slightly less variation in the chrysophyte assemblages. Because of the spatial autocorrelation in these chrysophyte assemblages, spatial position of lake communities is relatively more important than landscape position (hydrological connectedness), compared with non-autocorrelated data sets. Therefore, as the importance of lake position could be overstated if the landscape metric is based on coordinate position, lake order is a valuable new metric in the catchment-scale examination of ecological data sets along chains of connected lakes.
Acknowledgments
The authors would like to thank colleagues from the Ontario Ministry of Environment, Ontario Ministry of Natural Resources, and PEARL for supplying limnological data and assisting in fieldwork. We would also like to thank Keith Somers for statistical advice. We thank two anonymous reviewers for their comments on an earlier version of this manuscript. This research was funded by NSERC grants to BFC and JPS, Ontario Ministry of the Environment support to RIH and PJD, and scholarships/fellowships to RQ (OGS, OGSST, NSERC PDF), AMP (NSERC PGS B, OGS), and ANW (OGS).


