Carbohydrate utilization by juvenile silver perch, Bidyanus bidyanus (Mitchell). I. Uptake and clearance of monosaccharides following intraperitoneal injection
Abstract
Abstract Intraperitoneal carbohydrate tolerance tests were done to assess the ability of silver perch, Bidyanus bidyanus, to utilize the predominant monosaccharides in plant ingredients currently being used in the formulation of aquaculture feeds for this species. Preliminary experiments carried out to assess baseline plasma glucose concentrations indicated that blood glucose levels were elevated within 2 min of handling and silver perch required a period of 48 h without feeding before plasma glucose levels remained constant. In the first carbohydrate test, either glucose, galactose or xylose were administered by injection into the intraperitoneal cavity at a dose rate of 1 g carbohydrate kg−1 body weight (BW). In the second carbohydrate test, glucose was administered at a dose rate of either 2 or 4 g glucose kg BW−1. Following injection, uptake and clearance rate of the carbohydrates from the blood stream was monitored over a 24-h period. Silver perch were significantly more efficient at the uptake and clearance of glucose from the blood stream than xylose or galactose. Maximum plasma glucose concentrations (22.2 mmol L−1) were recorded at 1 h following injection and basal levels (3.44 mm) were attained between 6 and 12 h following injection. For both galactose and xylose, maximum concentrations were recorded at 1 and 3 h, respectively, and concentrations of both monosaccharides remained significantly elevated 24 h after the administration. Plasma glucose concentrations of silver perch administered with either 2 or 4 g glucose kg BW−1 were significantly elevated and peaked at similar levels (30.2 mmol L−1 and 30.7 mmol L−1 respectively) 3 h after injection. Basal plasma glucose concentrations were attained in silver perch injected with 2 g glucose kg BW−1 at 24 h following administration. Plasma glucose concentrations remained significantly elevated in fish injected with 4 g glucose kg BW−1 after 24 h. These findings indicate that silver perch are more efficient at utilizing glucose than either xylose or galactose, and that there are also differing maximum threshold for the inclusion of ingredients rich in glucose, galactose and xylose into the diets of silver perch.
Introduction
Increasing effort is being made to use more plant ingredients, such as wheat, lupins and field peas as protein sources, or to spare energy in aquaculture diets (Tacon 1994; Wilson 1994; Allan, Parkinson, Booth, Stone, Rowland, Frances & Warner-Smith 2000). One of the key limitations to the increased use of plant ingredients is the ability of fish to utilize the inherent carbohydrates (Allan et al. 2000).
While digestibility and growth trials are the principal methods to measure utilization of nutrients in fish, both methods are relatively expensive and time consuming. A rapid and relatively cheap screening method for assessing the ability of fish to utilize carbohydrates is to introduce carbohydrate, either orally or into the intraperitoneum of fish, and then measure uptake and clearance of the carbohydrate from the blood stream. When glucose is used this method is commonly referred to as the glucose tolerance test. Glucose tolerance tests have been conducted on a range of fish species (Palmer & Ryman 1972; Furuichi & Yone 1982; Shimeno 1982; Furuichi, Taira & Yone 1986; Wilson 1994; Lin, Ho & Shiau 1995; Shiau & Chuang 1995; Deng, Refstie & Hung 2001).
In general, fish of a low trophic level (herbivorous or omnivorous) tend to be more efficient at both the uptake and clearance of glucose compared with carnivorous species (Furuichi & Yone 1981; Garcia-Riera & Hemre 1996; Peres, Goncalves & Oliva-Teles 1999).
Enzyme pretreatment of dietary plant material with carbohydrases (α-amylase, β-glucanases and β-xylanases) may enhance energy digestibility in fish by releasing previously unavailable glucose, galactose and xylose. Relatively few tolerance studies have investigated the ability of fish to utilize galactose or xylose (Hung 1991; Shikata, Iwanaga & Shimeno 1994; A J Anderson, unpublished data). Results from these studies tend to suggest that herbivorous species are more galactose and xylose tolerant than carnivorous species.
Silver perch (Bidyanus bidyanus) is an omnivorous freshwater species, currently being cultured in Australia on relatively low protein (< 35%) diets containing carbohydrates, including starch rich ingredients such as wheat and field peas, as well as lupins that contain a high proportion of galactose and xylose (Allan & Rowland 1998).
The aim of this study was to investigate the uptake and short-term clearance rates of glucose, galactose and xylose from the blood stream of silver perch.
Materials and methods
Experimental fish and holding facilities
Silver perch [experiment 1, mean weight ± SEM: 42.5 ± 4.5 g (n = 36); experiment 2, 25.8 ± 7.0 g (n = 63); experiment 3, 58.1 ± 1.1 g (n = 180); and experiment 4, 45 ± 1.2 g (n = 72)] were bred at the NSW Fisheries Grafton Research Centre (GRC) 29° 40′_S, 153° 00′_E and raised in earthen ponds using similar techniques to those described by Thurstan & Rowland (1994). Except for experiment 1 which was conducted at GRC, fish used in experiments were transported by road to the NSW Fisheries Port Stephens Fisheries Centre (PSFC) (32° 44′_S, 152° 08′_E) and held in a 7000-L tank supplied with re-circulating freshwater (bore water). Fish were fed twice a day with a low carbohydrate basal diet (digestible protein, 60.0; lipid, 13.4; total carbohydrate, 7.9; ash 15.6%; and digestible energy 20.3 MJ kg−1). Water temperature was held at 24 ± 2 °C by the use of two, 2 kW immersion heaters. The fish were held at PSFC for at least 3 weeks prior to the commencement of each experiment.
Two preliminary experiments were performed to validate blood sampling and fasting protocols for glucose tolerance in silver perch.
Experiment 1: baseline plasma glucose levels and acute glucose stress response of pond reared silver perch
Plasma glucose levels in fish has been shown to be elevated by handling stress (Mazeaud, Mazeaud & Donaldson 1977; Pickering 1981, 1993; Schreck 1982; Carragher & Rees 1994), and stress can therefore be a major confounding factor and influence results obtained from glucose tolerance tests. This experiment was designed to investigate the plasma glucose response of silver perch following capture and handling stress. The aim was to determine base line plasma glucose concentrations of silver perch and also to determine how quickly blood samples had to be collected from silver perch following an initial disturbance before plasma glucose concentrations were influenced by handling stress.
Silver perch used in this experiment were maintained in a 0.1-ha pond at GRC. In order to monitor the glucose kinetics of silver perch following capture and confinement, a time course study was adopted. Sampling times were 0.5, 0.75, 1, 2, 5 and 10 min following initial disturbance. Fish were fasted for a period of 48 h, prior to the experiment. Silver perch were captured from the pond by angling and blood samples were withdrawn either immediately or following confinement. Fish were confined in a 20-L plastic bucket containing fresh pond water supplied with oxygen. Six fish were used for each sampling time. Blood samples were obtained from the caudal vessel of fish using a 1-mL syringe and a 27 gauge hypodermic needle. Following collection, blood was transferred immediately into a 1.5-mL microfuge tube containing anticoagulant, EDTA (5 mg mL−1 blood) and glycolysis inhibitor, NaF (2 mg mL−1 blood). Blood samples were immediately centrifuged at 1250 G and the plasma was separated and stored at −20 °C prior to analysis. Plasma glucose concentrations were measured.
Results from experiment 1 indicated that blood glucose levels of silver perch are elevated rapidly following a handling disturbance (after 1 min; Fig. 1). Therefore, to eliminate the confounding effects of stress on plasma glucose concentrations, all blood samples taken from silver perch in the following experiments were obtained within 1 min of initial disturbance at each sampling time.
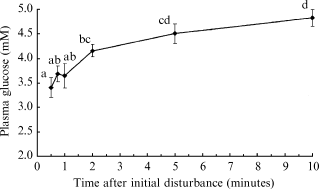
Plasma glucose concentrations of silver perch following capture and confinement. Values are means ± sem (n = 6 fish per sampling time). Means which share the same superscript are not significantly different (P > 0.05, anova, SNK).
Experiment 2: postprandial plasma glucose levels of silver perch
This experiment was designed to investigate the postprandial glycaemic response of silver perch following normal feeding. The aim was to determine how long fish needed to be starved before glucose tolerance tests to ensure that blood glucose concentrations were due to the test diet and not previous feeding.
Three silver perch were stocked into each of 21, 70-L acrylic aquaria (three aquaria per sampling time) in a phototherm controlled room (17 h light:7 h dark, water temperature range 24–26 °C). Fish were acclimated to the facility for a period of 2 weeks, during which time they were fed the basal diet twice daily (50% in the morning, 50% in the afternoon) at a rate of 4% biomass day−1. To monitor the postprandial glucose kinetics of silver perch, a time-course study was adopted. Sampling times were 0 (before feeding) 3, 6, 12, 24, 48 and 72 h following feeding. To minimize disturbance of fish during sampling, each 70-L aquaria was isolated by black plastic screens on front, back and sides.
On the morning of the commencement of the experiment, six fish were sampled (two from each of three aquaria), and the remaining fish were fed a single meal (2% biomass). At each sampling time fish were anaesthetized with ethyl p-aminobenzoate (Sigma Chemical Co., Castle Hill, NSW, Australia) at a concentration of 300 mg L−1 then captured using a dip net. Blood samples were withdrawn as described in experiment 1. Two fish from each of three aquaria were sampled. Fish were then weighed and plasma glucose was analysed.
Experiment 3: carbohydrate tolerance test for glucose, galactose and xylose at a dose rate of 1 g carbohydrate kg BW−1
Design, facilities and fish
This experiment was designed to investigate the ability of silver perch to regulate blood carbohydrate levels following an intraperitoneal injection of either d-glucose, or d-galactose, or d-xylose (Sigma Chemical Co.), at a dose rate of 1 g carbohydrate kg BW−1, over a period of 24 h.
The experiment was carried out in a recirculating system consisting of 16 10 000-L tanks held within a 40 × 15 m plastic greenhouse. Each 10 000-L tank contained six experimental floating cages (n = 96). Experimental cages were 200-L in capacity (0.6 m diameter and 0.7 m submerged depth, walls were constructed of 9 mm plastic mesh and the top and bottom were constructed of 1.6 mm plastic (Kinnears Pty Ltd, Smithfield, NSW, Australia). To minimize disturbance to the fish during acclimation and sampling, each 10 000-L tank was divided into six segments using black plastic sheeting. One cage was held within each segment. The 1.6 mm mesh lid on each cage also helped shield the fish from disturbances.
Freshwater was filtered through a sand filter before being supplied to experimental tanks at a flow-rate of 17 L min−1. Effluent water from each tank flowed by gravity from the bottom of the tanks, into a 2-m3 biological filter within a common 7000-L reservoir and was then pumped back to the sand filter. Aeration was provided to each tank by two air-stone diffusers and each tank was heated using a 2 kw immersion heater. Fluorescent lighting was used to control photo-period at 17 h light:7 h dark.
Prior to stocking, fish were captured by dip net from the 7000-L holding tank and anaesthetized in a 200-L container using a bath of 50 mg L−1 ethyl ρ-aminobenzoate for 3 min The fish were then caught at random, individually weighed, and distributed among the 200-L cages by systematic interspersion. During the acclimation phase of both experiments, 20 fish were held in each 200-L cage. Twelve cages of fish (n = 240 fish) were used. The fish were fed the basal diet at 4% BW day−1 and acclimated to the experimental facilities for a period of 35 days prior to the experiment. At the completion of the acclimation phase the fish were not fed for a further 48 h prior to the administration of carbohydrate (following results from Experiment 2).
To confirm that handling stress did not influence plasma glucose levels of fish, two groups of control fish were included. The first control group were exposed to the same handling procedures as the fish injected with carbohydrate but received no injection. The second group were also exposed to the same handling procedures as the fish injected with carbohydrate, but also received a ‘sham’ injection of sterile isotonic saline solution (0.9% NaCl).
Stock solutions and injections
For ease of injection, the carbohydrates were mixed with distilled water and sterilized to create a stock solution containing 200 mg carbohydrate mL water−1. To achieve the desired dose rate, each fish was weighed and the desired volume of stock solution was injected. This resulted in a constant ratio of stock solution volume to fish weight. Injections were administered using a 27 gauge needle and 0.5 mL syringe.
Sampling procedures
Fish were removed from a 200-L holding cage and a blood sample was withdrawn immediately from one fish (as for experiment 1). The sample from this fish was randomly assigned to each treatment and used as the initial sample (basal level). The remaining fish were transferred simultaneously into a 100-L bin containing 50 mg L−1 ethyl p-aminobenzoate and anaesthetized, weighed and randomly assigned to each treatment series. The fish were then processed, either no injection (handling control group) or injected with either glucose, galactose, xylose or saline solution (‘sham’ control group) at a dose rate of 1 g carbohydrate kg BW−1. Immediately following handling and injection, single fish were returned to individual 200-L cages to minimize disturbance at subsequent sampling times. Blood samples were obtained (as described in Experiment 1) from fish at 1, 3, 6, 12 and 24 h following injection. This procedure was repeated for each holding cage of fish until six fish were sampled for each sampling time for each treatment. After blood sampling, each fish was removed from the experiment and placed back into a separate tank for recovery.
Experiment 4: glucose tolerance test at a dose rate of 2 or 4 g carbohydrate kg BW−1
Silver perch appeared to be efficient at the uptake and clearance of glucose from their blood when administered at 1 g glucose kg BW−1. Therefore, this experiment was done to assess the uptake and clearance capacity of silver perch with increasing levels of glucose over a period of 24 h following an intraperitoneal injection with either 2 or 4 g glucose kg BW−1.
This experiment was conducted using the same facilities and techniques described for experiment 3, except the fish were acclimated to the facilities for 14 days and there were 6 cages of fish (n = 120 fish) used. In addition, as the results from experiment 3 indicated that the injection procedures had no significant confounding effects on the glucose response of silver perch, the controls used for this experiment were the fish sampled initially without anaesthetic or injection. In an attempt to keep the injection volume constant between experiments, the concentration of the stock solution used in this experiment was 400 mg glucose mL distilled water−1. Injection procedures, sampling times and experimental facilities for this experiment were the same as those described for Experiment 3. Six fish were used for each treatment for each sampling time.
Water quality
During experiments, water temperature (range 23–26 °C), dissolved oxygen (above 5.0 mg/l), and pH (between 7.4 and 8.2) were measured daily using a Yeo-Kal 611 water quality analyser (Yeo-Kal Electronics, Brookvale, Sydney, NSW, Australia). Nitrite and ammonia (< 0.2 mg L−1 NO2-N and < 0.4 mg L−1 total ammonia-N respectively) were measured using colourmetric methods described by Major, Dal Pont, Kyle & Newell (1972) and Dal Pont, Hogan & Newell (1973).
Biochemical analysis
Plasma glucose was determined for all blood samples. The glucose oxidase–peroxidase method (Fleming & Pegler 1963) (Kit 510 A, Sigma Chemical Co.) was used. Plasma galactose was determined for blood samples of fish injected with galactose by difference using the Somogyi-Nelson method for total reducing sugars (Dische 1962a). Plasma xylose was measured in blood samples from fish injected with xylose using the method of Dische (1962b).
Statistical analysis
Statistical evaluation of the data was carried out using the Statsgraphics Plus for Windows 4.1 software package (Manugistics Inc., Rockville, MD, USA, 1998). Homogeneity of variance was assessed using Cochran's Test (Winer 1991). Experiments 1 and 2 were designed for analysis of plasma glucose concentrations of silver perch using one-factor anova with sampling time as the fixed factor. Experiment 3 was designed for analysis of plasma glucose concentrations of silver perch using two-factor anova with treatment type [no injection (handling only), sham injection, glucose injection, galactose injection or xylose injection] as the first fixed factor and sampling time as the second fixed factor. Concentrations of plasma galactose and xylose in fish injected with either of these carbohydrates were analysed using single factor anova with sampling time as the fixed factor. Experiment 4 was designed for analysis of plasma glucose concentrations of silver perch using two-factor anova with glucose injection concentration (2 or 4 g glucose kg BW−1) as the first fixed factor and sampling time as the second fixed factor. Single factor anova was used to assess the differences of plasma glucose concentrations within treatments over time. If significant differences were found, comparisons among means were made using Student–Newman–Kuels multiple range test. Differences between means were considered significant at P < 0.05. Unless otherwise stated, all results appear as mean ± standard error of mean (n = 6).
Results
Experiment 1: baseline plasma glucose levels and acute glucose stress response of pond reared silver perch
Resting, or baseline plasma glucose concentrations of silver perch were 4.41 ± 0.30 mM, and were significantly elevated within 2 min of initial disturbance (P < 0.05) (Fig. 1).
Experiment 2: post-prandial plasma glucose levels of silver perch
Post-prandial plasma glucose concentrations of silver perch changed significantly during the experiment (P < 0.05) (Fig. 2). Glucose concentrations approached their lowest levels following 48 h of starvation, and were not significantly different after 72 h (P > 0.05) (Fig. 2). As there was no significant reduction of plasma glucose concentrations between 48 and 72 h, a starvation period of 48 h was adopted before the carbohydrate administration for the subsequent glucose tolerance tests.
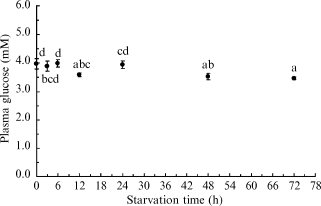
Postprandial plasma glucose levels of starved silver perch. Values are means ± sem (n = 3 replicates consisting of two fish per tank). Means which share the same superscript are not significantly different (P > 0.05, anova, SNK).
Experiment 3: carbohydrate tolerance test for glucose, galactose and xylose at a dose rate of 1 g carbohydrate kg BW−1
There was a significant effect of treatment on the plasma glucose concentrations of silver perch, in order of magnitude: glucose injection > control = saline injection = galactose injection = xylose injection (P < 0.05, Fig. 3). There was also a significant effect of time on the glucose concentrations of silver perch with plasma glucose concentrations elevated between 1 and 12 h following treatment (P < 0.05). There was also a significant interaction between treatment and time (P < 0.05). The interaction may be explained by the large elevation of plasma glucose concentrations of silver perch following the injection of glucose, when compared with the minimal elevation of plasma glucose concentrations of fish, which received either no injection or an injection of, galactose, xylose or saline solution. This was confirmed by excluding plasma glucose concentrations of fish injected with glucose from the two-factor anova with treatment type [no injection (handling only), sham injection, galactose injection or xylose injection] as the first fixed factors and sampling time as the second fixed factor. Results of this two-factor analysis indicated that there was a significant effect of time on plasma glucose concentrations of silver perch (P < 0.05), and that there was no significant effect of treatment type and there was no interaction (P > 0.05).
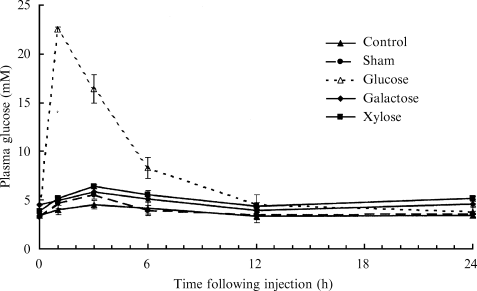
Plasma glucose concentrations of silver perch which were either anaesthetized (control) or anaesthetized and administered with an intraperitoneal injection of carbohydrate (1 g carbohyrate kg BW−1) or isotonic saline solution (mean ± sem; n = 6 fish for each sampling time within each series).
Initial basal concentrations of glucose in plasma (3.43 mM) were similar for all groups. Plasma glucose levels of silver perch injected with glucose were significantly elevated (P < 0.05) and peaked (∼22 mM) 1 h after injection. From this point onwards glucose levels declined until basal levels were attained at 12 h after injection (P > 0.05). In contrast, silver perch, which received no injection (control), exhibited a slight increase in plasma glucose concentrations, which peaked at 3 h and returned to basal levels between 6 and 12 h of injection. Plasma glucose concentrations of fish, administered with galactose, xylose or the sham injection, followed the same trend as the control (no injection) fish (P > 0.05).
There were no measurable concentrations of galactose found in the blood of silver perch prior to galactose administration. Silver perch injected with 1 g galactose kg BW−1 exhibited a significant elevation of plasma galactose that peaked between 1 and 3 h after injection (P < 0.05) (Fig. 4). Plasma galactose concentrations tended towards basal levels over the following 24 h, but remained significantly elevated (P < 0.05).
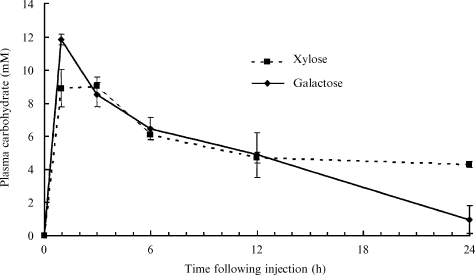
Plasma galactose and xylose concentrations of silver perch following an intraperitoneal injection of either 1 g galactose or 1 g xylose kg BW−1 (mean ± sem; n = 6 fish for each sampling time within each series).
There were no measurable concentrations of xylose observed in the blood of silver perch prior to xylose administration. Fish injected with 1 g xylose kg BW−1 exhibited a significant elevation of plasma xylose between 1 and 3 h after the injection (P < 0.05) (Fig. 4). From this point plasma xylose concentrations slowly declined but were still significantly elevated 24 h following injection (P < 0.05).
Experiment 4: silver perch glucose tolerance test
There was a significant effect of glucose dose rate on the plasma glucose concentrations of silver perch (4 g glucose kg BW−1 > 2 g glucose kg BW−1) (P < 0.05, Fig. 5). There was also a significant effect of time on the glucose concentrations of silver perch (P < 0.05). There was also a significant interaction between glucose dose rate and time (P < 0.05). The interaction may be explained by the failure of fish injected with 4 g glucose kg BW−1 to attain basal levels, whereas fish injected with 2 g glucose kg BW−1 attained basal levels 24 h following injection.
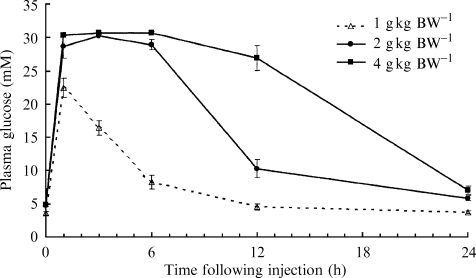
Glucose response of silver perch following an intraperitoneal injection of glucose at either 1 or 2 or 4 g kg BW−1 (mean ± sem; n = 6 fish for each sampling time within each series).
Initial basal concentrations of plasma glucose (4.78 mM) of silver perch were similar for both groups. Plasma glucose levels of silver perch injected with either 2 or 4 g glucose kg BW−1 were significantly elevated (P < 0.05) and peaked at 30.2 mM and 30.7 mM, 3 h after injection respectively. Basal plasma glucose concentrations for fish injected with 2 g glucose kg BW−1 were reached at 24 h following injection (P > 0.05). In contrast, plasma glucose concentrations of silver perch injected with 4 g glucose kg BW−1 remained significantly elevated (P < 0.05) throughout the experiment.
Discussion
Experimental procedures, such as crowding, repeated sampling from the same tank or handling and blood sampling, have been reported to induce a primary stress response in fish (Mazeaud et al. 1977; Pickering 1981, Schreck 1982,1993). In fact, plasma glucose concentrations have been used as a measure of secondary stress in fish (Mazeaud et al. 1977; Carragher & Rees 1994). The failure to adequately address this aspect of fish physiology during glucose tolerance tests can easily confound results. This was evident in a number of studies (Shikata et al. 1994; Garcia-Riera & Hemre 1996). The basal glucose concentrations observed in the plasma of silver perch during experiments 2, 3 and 4 of the present study were within the range reported for silver perch sampled from the pond at GRC (Fig. 1), and are also within the range reported for other species (Furuichi & Yone 1981; Wilson & Poe 1987; Hung 1991; Peres et al. 1999; Deng et al. 2001). This indicates the silver perch had settled into the experimental facilities and stress was minimized prior to the experiment. The injection procedure had a minimal effect on plasma glucose concentrations in silver perch. There was a slight increase in plasma glucose of silver perch in both handling or ‘sham’ injected control groups when compared with the initial basal concentrations, however, these were small compared with increased plasma glucose concentrations from silver perch receiving an injection of glucose (Fig. 3).
The ability of an organism to assimilate and clear glucose from the blood stream is predominantly dependent upon active transport mechanisms (Champe & Harvey 1994). The route of assimilation of glucose into the bloodstream following intraperitoneal injection may differ to that following oral administration. In the case of intraperitoneal injection, the assimilation of glucose through the digestive system maybe by-passed, and as glucose does not passively diffuse into cells, active transport must occur predominantly through the epithelial cells of the peritoneum cavity or surrounding organs (Champe & Harvey 1994).
Silver perch challenged with an intraperitoneal injection of glucose at a dose rate of 1 g kg BW−1 were extremely efficient at the assimilation of glucose from the peritoneum cavity into the blood stream. The assimilation of glucose by silver perch was rapid, with maximum glucose concentrations observed within 1 h of administration (Fig. 3). When compared with the assimilation rate reported for the omnivorous common carp challenged with the same dose of glucose (Peres et al. 1999), it appears that silver perch have a more efficient transport mechanism. As expected of an omnivorous species, silver perch were more efficient at assimilating glucose from the bloodstream than a wide range of carnivorous species (Hemre, Sandnes, Lie & Waagbø 1995; Peres et al. 1999; Deng et al. 2001).
The utilization of assimilated glucose as an energy source relies upon facilitated transport of extra- cellular glucose from the blood into cells and involves specific, cell-bound glucose transporters (Champe & Harvey 1994). Glucose may also be stored as glycogen, or incorporated into fat or protein (Champe & Harvey 1994). Other clearance routes do operate, for example, when the renal threshold is exceeded glucose may also be passed in the urine (glycosuria) (Champe & Harvey 1994; Deng et al. 2001). Glycosuria has been reported for the carnivorous yellowtail and white sturgeon (Furuichi et al. 1986; Deng et al. 2001). Glucose excretion, although minimal, has also been detected via the gills of Atlantic cod (Gadus morhua) (Hemre & Kahrs 1997).
Silver perch injected with 1 g glucose kg BW−1 were efficient at the clearance of glucose from the blood stream, with basal glucose concentrations achieved between 6 and 12 h following administration (Fig. 3). This is only slightly longer than the clearance rate of glucose observed for the herbivorous carp or tilapia which required 4–8 h to achieve basal concentrations following carbohydrate administration (Hertz, Madar, Hepher & Gertler 1989; Lin et al. 1995). When compared with the clearance rate of glucose by carnivorous species such as Atlantic salmon, turbot or sturgeon (Hemre et al. 1995; Garcia-Riera & Hemre 1996; Deng et al. 2001), silver perch appear to be more efficient at utilizing assimilated glucose. However, from the experiments reported in this study it is not possible to say what proportion of circulating blood glucose was utilized or simply excreted as waste via the urine or gills.
As with all other species of fish, silver perch exhibited a rapid and prolonged elevation of plasma glucose, which peaked within 1 h of administration at ∼22 mM, and returned to basal levels within 12 h.
A comparison of the magnitude of the effects of increased glucose loading on silver perch from experiments 2 and 3, indicates silver perch maintained the ability for rapid assimilation of glucose from the intraperitoneal cavity into the blood stream (Fig. 5). However, when the dose rate of glucose was increased from 1 to 2 to 4 g kg BW−1, there appeared to be a progressive overload of the metabolic pathways responsible for the assimilation of glucose and prolonged hyperglycemia was observed. This may have major implications on feed formulations and feeding strategies adopted for silver perch production.
Dietary carbohydrate level, complexity and feeding frequency have been reported to influence carbohydrate utilization in fish (Brauge, Medale & Corraze 1994; Shiau 1997; Deng et al. 2001). This indicates that fish must be able to clear glucose from a previous meal before the next meal is given, otherwise hyperglycaemia may occur, and a progressive decline in fish growth performance may result. Hyperglycaemia may also be reduced by feeding fish more complex carbohydrates. Slower digestibility of the more complex carbohydrates such as starch or dextrin by fish has been reported to result in a lower glycaemic response compared with fish fed the more easily digested glucose (Wilson & Poe 1987; Deng et al. 2001).
The administration of glucose at the dose rate of 1 g kg BW−1 equates to approximately the same amount of glucose that would be derived from one meal (1% BW−1) of a commercial diet containing 30% digestible starch for silver perch. The uptake and clearance capacity of glucose following the intraperitoneal injection at this dose rate complements digestibility and utilization data for gelatinized starch or dextrin when included at 30% dietary inclusion content from previous studies for silver perch (Stone, Allan & Anderson 2003a, b). In a culture situation, it appears that increasing the feeding frequency when feeding diets containing moderate levels of digestible carbohydrate may improve carbohydrate utilization by silver perch.
Silver perch appear to have similar initial uptake rates for xylose and galactose into the blood stream (Fig. 4). However, silver perch are very inefficient at the assimilation and utilization of xylose and galactose compared with glucose. Even though the uptake of both xylose and galactose into the blood stream was only approximately half that of glucose, plasma concentrations remained elevated at 24 h following the injection. This suggests silver perch are both xylose and galactose intolerant at the dose rates tested in this study. Using similar methods to those reported in the present study (A J Anderson, unpublished data) concluded that barramundi were also both xylose and galactose intolerant (they also failed to clear elevated blood sugar levels within 48 h following an intraperitoneal injection of 1 g carbohydrate kg BW−1). Tilapia cleared elevated blood galactose concentrations within 4 h (A J Anderson, unpublished data) but blood xylose levels of tilapia peaked rapidly within 1 h of administration and remained significantly elevated after 24 h.
In humans, galactose shares many of the same uptake mechanisms as glucose and may even be converted to glucose during the absorption process (Champe & Harvey 1994). It appears that silver perch lack the required conversion mechanisms as there was no evidence of the conversion of galactose into glucose observed in the plasma of silver perch injected with galactose (Fig. 3). The conversion mechanism appears to be species dependent as Shikata et al. (1994) also reported that carp fed galactose lacked the ability to convert the galactose to glucose in the absorption process while the opposite has been reported for white sturgeon (Hung 1991). Hung (1991) reported elevated blood glucose in sturgeon following oral administration of galactose.
An interesting point regarding galactose utilization is that most fish, including silver perch, fail to efficiently clear elevated concentrations of galactose from their blood stream and appear to be galactose intolerant. There may be a reduction in the growth and health of silver perch if fed diets high in galactose. Galactosaemia has been reported to have negative effects on fish performance. Shikata et al. (1994) reported a remarkable reduction in growth, reduced feeding activity, low body and serum fat levels and reduced hepatopancreatic enzyme activity in carp fed diets containing 30% galactose. Inefficient utilization of galactose has also been reported for chinook salmon (Oncorhynchus tshawytscha), brook trout (Salvelinus fontinalis) and chum salmon fry (Oncorhynchus keta) (Buhler & Halver 1961; McCartney 1971).
The inefficient utilization of galactose and xylose observed here for silver perch lends further support to previous findings from digestibility studies which have indicated that this species is inefficient at digesting galactose or xylose from plant ingredients such as lupins (Allan & Rowland 1998). It also brings into question the potential of pretreatment of dietary NSP's with enzymes (β-glucanases and β-xylanases) to enhance dry matter and energy digestibility for silver perch.
As the digestibility of NSPs by silver perch is insignificant (Allan & Rowland 1998), the potential for the availability of excessively high levels of dietary galactose or xylose in commercial diets is low. However, caution will have to be exercized if an attempt is made to enhance the digestibility of NSPs by the use of endogenous carbohydrase enzymes, as an increase in the availability of dietary galactose and xylose may have negative impacts on fish health and growth performance.
The results from this study indicate that there are marked differences in carbohydrate utilization between the silver perch and other species. and even though hyperglycemia was evident, silver perch appear to be extremely glucose tolerant at the dose rate of 1 g glucose kg BW−1. They maintained the ability to clear excessive blood glucose the before delivery of the next meal. As silver perch appear to be galactose and xylose intolerant, dietary levels of galactose and xylose should be restricted. In a culture situation, the restriction of high contents of glucose, galactose and xylose from diets may also contribute to an improvement in pond water quality because of a reduction in waste output from faeces.
Acknowledgments
We would like to thank Rebecca Warner-Smith, Mark Booth, Ian Russell & Natalie Tostin from Port Stephens Fisheries Centre, Ms Z. S. Lipovsek from the Queensland University of Technology and Stuart Rowland & Charlie Mifsud from Grafton Research Centre for their technical assistance in this study. We are also grateful to Stewart Fielder & Wayne O'Connor for reviewing the manuscript and Helena Heasman for assistance with manuscript preparation. The study was funded by Fisheries Research and Development Corporation, Project no. 96/391.


