Control of secretion by mitochondria depends on the size of the local [Ca2+] after chromaffin cell stimulation
Abstract
In chromaffin cells, plasma membrane calcium (Ca2+) channels and mitochondria constitute defined functional units controlling the availability of Ca2+ nearby exocytotic sites. We show here that, when L-/N-type Ca2+ channels were inhibited with nisoldipine and ω-conotoxin GVIA, cytosolic [Ca2+] ([Ca2+]c) peaks measured in fura-4F-loaded cells were reduced by 36%; however, mitochondrial Ca2+ uptake was unaffected and secretion was potentiated by protonophores as in control cells. By contrast, when non L-type Ca2+ channels were inhibited with ω-conotoxin MVIIC, [Ca2+]c peaks induced by high K+ were reduced by 73%, mitochondrial Ca2+ uptake was abolished, and secretion was not modified by protonophores. However, if Ca2+ entered only through L-type channels activated by FPL64176, high K+ stimulation induced fast mitochondrial Ca2+ uptake and catecholamine secretion was strongly increased and potentiated by protonophores. These results confirm the close association of catecholamine secretion to mitochondrial Ca2+ uptake, and indicate the sharp threshold of local [Ca2+]c (about 5 µm) required for triggering fast mitochondrial Ca2+ uptake that is able to modulate secretion. The entry of Ca2+ through L-type channels generated local [Ca2+]c increases just below that, inducing little mitochondrial Ca2+ uptake unless FPL64176 was present. By contrast, Ca2+ entry through P/Q-type channels fully activated mitochondrial Ca2+ uptake. Control of secretion by mitochondria therefore depends critically on the ability of the stimulus to create large local [Ca2+]c microdomains.
Introduction
It has been known for many years that mitochondria play a central role in energy metabolism and the production of ATP (Duchen, 1999). During cell activation, some mitochondria take up Ca2+ from local cytosolic [Ca2+] ([Ca2+]c) microdomains generated by the activation of nearby Ca2+ channels located either at endomembranes or at the plasma membrane (Rizzuto et al., 1993, 1994; Brini et al., 1997). Using mitochondrially targeted aequorins with different Ca2+ affinities to measure mitochondrial [Ca2+] ([Ca2+]M), we have shown (Montero et al., 2000) that activation of Ca2+ entry by high K+ depolarization or acetylcholine produced a heterogeneous response of [Ca2+]M in chromaffin cells. Whereas half of mitochondria responded with moderate increases in [Ca2+]M up to 2–3 µm, a very fast Ca2+ uptake was observed in the remainder; these mitochondria, probably located closer to the Ca2+ entry sites, reached near millimolar [Ca2+] in a few seconds. In addition, caffeine-induced release of Ca2+ from the endoplasmic reticulum (ER) also induced a fast Ca2+ uptake into the same population of mitochondria, suggesting that voltage-dependent Ca2+ channels, ryanodine receptors and mitochondria are colocalized.
These functional units could be relevant to determine the rate and extent of Ca2+ delivery to the secretory machinery. Our observations (Montero et al., 2000) are compatible with the idea that the subpopulation of mitochondria located nearby the plasmalemma observe and buffer Ca2+ from high [Ca2+] microdomains occurring near the inner mouth of plasma membrane Ca2+ channels. From the rate of Ca2+ uptake into these mitochondria, the presence of subplasmalemmal [Ca2+]c microdomains of 20–40 µm was inferred. These concentrations are close to those reached at subplasmalemmal exocytotic sites during physiological cell depolarization of bovine chromaffin cells (Augustine & Neher, 1992; Neher, 1998). Mitochondria are well suited to control [Ca2+]c in this range because of the high Km of the mitochondrial Ca2+ uniporter (Uceda et al., 1995; Csordás et al., 1999; Montero et al., 2000). This large capacity and low affinity Ca2+ uptake mechanism might therefore serve the function of controlling the amount of Ca2+ available to trigger secretion. In fact, blockade of mitochondrial Ca2+ uptake using protonophores or mitochondrial poisons potentiated catecholamine secretion strongly (Giovanucci et al., 1999; Montero et al., 2000).
In this report we extend our study by taking advantage of the presence of different types of voltage-dependent Ca2+ channels in bovine chromaffin cells. Detailed pharmacological studies have found that bovine chromaffin cells contain different proportions of L-type, N-type and P/Q-type Ca2+ channels (López et al., 1994; Albillos et al., 1996; Lomax et al., 1997). Selective inhibition of these channels enabled the study of the conditions required for modulation of catecholamine secretion by mitochondria. Mitochondrial Ca2+ uptake starts when [Ca2+]c reaches > 0.5 µm (Herrington et al., 1996; Colegrove et al., 2000); however, we show here that the fast mitochondrial Ca2+ uptake required to modulate secretion starts only at [Ca2+]c > 4–5 µm. This sharp threshold, due to the sigmoidal dependence of the rate of mitochondrial Ca2+ uptake on [Ca2+]c (Montero et al., 2000), could transform a relatively small difference in Ca2+ entry through the plasma membrane into a large difference in terms of mitochondrial Ca2+ uptake.
Materials and methods
Materials
Fura-4F and coelenterazine n were obtained from Molecular Probes (Oregon, USA). Carbonyl cyanide m-chlorophenyl-hydrazone (CCCP) was purchased from Sigma Chemical Co. (St. Louis, MO, USA). FPL64176 was obtained from Research Biochemicals International (RBI-Sigma; Natick, MA, USA) and ω-conotoxin MVIIC and ω-conotoxin GVIA were obtained from Alomone Laboratories (Israel) or The Peptide Institute (Osaka, Japan). Other reagents were from Sigma or Merck (Darmstadt, Germany).
Preparation and culture of bovine chromaffin cells
Bovine adrenal medulla chromaffin cells were isolated following standard methods (Livett, 1984) with some modifications (Moro et al., 1990). Cells were suspended in Dulbecco's modified Eagle medium (DMEM) supplemented with 5% fetal calf serum, 10 µm cytosine arabinoside, 10 µm fluorodeoxyuridine, 50 IU/ml penicillin and 50 IU/ml streptomycin. For secretion experiments, cells were plated in 5 cm diameter Petri dishes (5 × 10⁶ cells per 5 mL DMEM). For the aequorin experiments, cells were plated in 12 mm glass polylysine-coated coverslips (0.25 × 10⁶ cells per 1 mL DMEM). Cultures were maintained at 37 °C in a humidified atmosphere of 5% CO2.
Measurements of single-cell [Ca2+]c
Single-cell measurements of [Ca2+]c were performed in cells loaded with the low-affinity Ca2+ dye fura-4F (by incubation with 4 µm fura-4F-AM for 60 min at 25 °C). Other details were as described previously (Núñez et al., 1995). Cells were epi-illuminated alternatively at 340 and 380 nm and light emitted above 520 nm was recorded by an extended ISIS-M camera (Photonic Science, Robertbridge, East Sussex, UK) and analysed using an Applied Imaging Magical image processor (Sunderland, Tyne and Wear, UK). Eight frames excited at every wavelength were averaged by hardware, with a time resolution of 1.7 s for each pair of images. The [Ca2+]c was estimated from the formula (Grynkiewicz et al., 1985):
[Ca]c = Kd × β (R − Rmin)/(Rmax − R)
where R is the ratio between the fluorescence emissions measured at 340 and 380 nm excitation, Rmax and Rmin are the ratios obtained at saturation of the dye with Ca2+ and in the absence of Ca2+, respectively, Kd is the dissociation constant for the dye (0.77 µm) and β is the ratio of the maximal (in the absence of Ca2+) and minimum (at saturation with Ca2+) fluorescence emissions measured at 380 nm excitation. The values of Rmax, and Rmin and β were determined in cells permeabilized to Ca2+ with ionomycin and perfused with media containing either no Ca2+ (5 mm EGTA) or 10 mm Ca2+. These values were similar to the ones obtained with fura-2. All the experiments were performed at room temperature.
Measurements of [Ca2+]M with aequorin
The mitochondrial aequorin was a kind gift of Professor Tullio Pozzan, Padova, Italy. Mutated mitochondrial aequorin (Asp19 to Ala) was obtained by replacing in frame the wild-type aequorin with the mutated aequorin DNA (Montero et al., 1995). Expression in chromaffin cells was achieved by infecting the cells with a defective herpes simplex virus type 1 containing the mitochondrial aequorin gene (pHSVmitAEQ). Virus packaging and titre have been described previously (Alonso et al., 1998). Chromaffin cell cultures (2.5 × 10⁵ cells/0.5 mL) were routinely infected with 2 × 10³ infectious virus units 12–24 h before measurements.
For aequorin reconstitution, cells expressing mitochondrial wild-type or mutated aequorin were incubated for 1–2 h at room temperature with 1 µm coelenterazine n, in standard medium containing (in mm): NaCl, 145; KCl, 5; MgCl2, 1; CaCl2, 1; glucose, 10; and HEPES, 10 at pH 7.4. Cells were then placed in the perfusion chamber of a purpose-built luminometer maintained at 22 °C. Calibration was performed using the calibration curves corresponding to each aequorin type (Barrero et al., 1997; Montero et al., 2000). Aequorin consumption was calculated as the integral of the luminescence measured during the experiment normalized as a percentage.
Online measurements of catecholamine release from populations of bovine chromaffin cells
Cells (5 × 10⁶) were removed carefully from the bottom of the Petri dish by scraping with a rubber policeman, and centrifuged at 800 r.p.m. for 10 min. The cell pellet was resuspended in 500 µL of Krebs–Hepes medium containing (in mm): NaCl, 144; KCl, 5.9; MgCl2, 1.2; glucose, 11; Hepes, 10 at pH 7.4, and incubated with the corresponding Ca2+ channel blockers for 30 min at room temperature. The cells were then transferred to a jacketed microchamber continuously superfused with Krebs–Hepes solution containing 2 mm Ca2+, at room temperature. The superfusion rate was 2 mL/min. The liquid flowing from the superfusion chamber reached an electrochemical detector (Metrohm AG CH-9100 Hersau; Methrom AG, Switzerland), placed just at the outlet of the microchamber that monitored online the amount of catecholamines secreted (Borges et al., 1986). Once a steady-state basal secretion was reached (about 20 nA of oxidation current), cells were stimulated to secrete at 2 min intervals with short pulses (10 s) of Krebs–Hepes solution containing 2 mm Ca2+ and 70 mm K+ (isosmotic reduction of Na+). Statistical values are given as mean ± SΕΜ.
Results
Depolarization of chromaffin cells using high K+ induces activation of plasma membrane voltage-dependent Ca2+ channels and Ca2+ entry. The contribution of different types of Ca2+ channels to this entry of Ca2+ has been estimated previously by measuring the effect of selective Ca2+ channel inhibitors on whole-cell, voltage-dependent Ca2+ currents (López et al., 1994; Albillos et al., 1996). The conclusion of these studies was that the Ca2+ current is carried 20% by L-type Ca2+ channels, 30% by N-type Ca2+-channels and 50% by P/Q-type Ca2+channels. Opening of Ca2+ channels produces a transient [Ca2+]c peak, and the contribution of different types of Ca2+ channels to these peaks has also been estimated by measuring the effect of selective Ca2+ channel inhibitors on the high K+-induced [Ca2+]c peaks measured with fura-2 (Lomax et al., 1997). One problem of this approach lies in the relatively high affinity for Ca2+ of fura-2, which provides little sensitivity at [Ca2+]c above 2 µm. For that reason, in the experiments in Fig. 1 we used the lower Ca2+ affinity dye fura-4F, which has a Ca2+ sensitivity of up to 7 µm. In Fig. 1a, cells were sequentially stimulated with high K+ three times to obtain reproducible [Ca2+]c increases. The cells were then treated with 3 µm nisoldipine (L-channel inhibitor) and 1 µmω-conotoxin GVIA (N-channel inhibitor) for 20 min. Subsequent stimulation with high K+ induced [Ca2+]c peaks that were decreased by about 50% with respect to those of the controls. In four similar experiments, inhibition was 36 ± 6% (mean ± SΕΜ). Following this, cells were treated with 3 µmω-conotoxin MVIIC (P/Q-/N-channel inhibitor) for an additional 20-min period. This treatment essentially abolished the [Ca2+]c peaks induced by the previous high K+ stimulations. Control experiments showed that high K+-induced [Ca2+]c peaks were stable over periods of > 30 min of periodic stimulation every 2–5 min (data not shown; see also Alonso et al., 1999). In Fig. 1b, after the initial three control high K+-induced [Ca2+]c peaks, cells were incubated with 3 µmω-conotoxin MVIIC for 20 min. This treatment decreased subsequent high K+-induced [Ca2+]c peaks by nearly 80%. In four similar experiments, inhibition was 73 ± 7% (mean ± SΕM). These results are consistent with those obtained by using whole-cell patch-clamp techniques, and suggest that the [Ca2+]c peak induced by high K+ pulses is constituted by 50–60% Ca2+ entry through P/Q-type channels, and about 20% through each of L- or N-type channels. Finally, in Fig. 1c, we show that the inhibition by ω-conotoxin MVIIC of high K+-induced [Ca2+]c peaks was partially reversed by the selective and potent nondihydropyridine activator of L-type Ca2+ channels FLP64176 (McKechnie et al., 1989; Villarroya et al., 1999). The average [Ca2+]c peak obtained in the presence of both the toxin and FPL64176 was 2.0 ± 0.1 µm compared to 0.88 ± 0.04 µm in the presence of the toxin alone (mean ± SEM, 53 single cells). The L-channel activator, however, produced little effect on the high K+-induced [Ca2+]c peaks in control cells (3.8 ± 0.1 µm with FPL64176 and 3.4 ± 0.1 µm in the absence of FPL64176; mean ± SΕΜ, 53 single cells). This could be attributed in part to saturation of fura-4F (81% at this [Ca2+]), although we have been able to detect previously potentiation of high-K+-induced [Ca2+]c peaks in these cells with the protonophore CCCP (Montero et al., 2001). Therefore, activation of Ca2+ entry through l-type Ca2+ channels probably contributes little to the global high K+-induced [Ca2+]c peak, except when non-L-channels are inhibited.
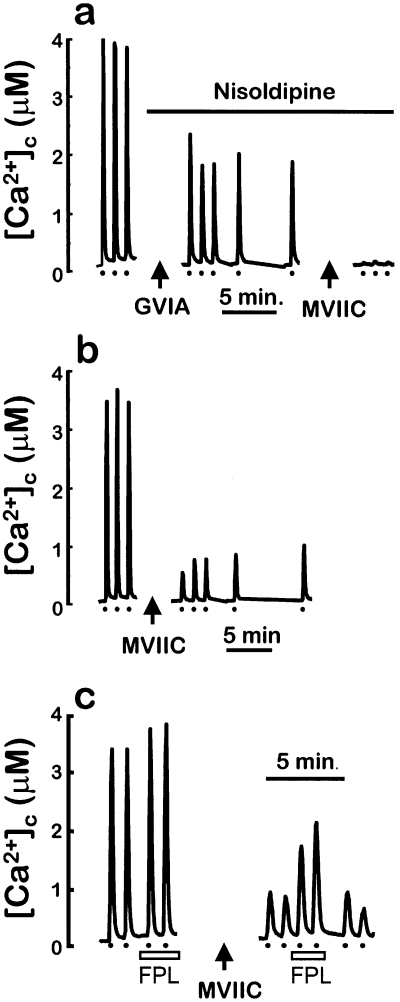
Effects of Ca2+ channel blockers on high K+-stimulated [Ca2+]c peaks. Cells were loaded with fura-4F in standard medium containing 1 mm CaCl2. Then, 10 s pulses of medium containing 70 mm KCl were given as indicated (dots, bottom). Arrows indicate the points at which recording was stopped and the cells were incubated for 20 min with either 1 µmω-conotoxin GVIA (GVIA) or 3 µmω-conotoxin MVIIC (MVIIC). Perfusion of 3 µm nisoldipine is indicated by the top horizontal bar in Fig. 1a. Perfusion of 0.3 µm FPL64176 is indicated at the bottom in Fig. 1c. Experiments were performed at room temperature. The traces shown are the average of 37 (panel a), 38 (panel b) and 53 (panel c; average of two experiments with identical protocol) cells present in the microscope field.
We then studied the effect of these selective Ca2+ channel inhibitors on high K+-induced [Ca2+]M increase. We expected effects proportional to the inhibition of the [Ca2+]c peaks; however, the results were very different. Figure 2a shows that high K+ stimulation induced a fast and reversible mitochondrial Ca2+ uptake in control cells, as reported previously (Montero et al., 2000). This large mitochondrial Ca2+ uptake can only be measured using mitochondrially targeted low Ca2+ affinity mutated aequorin, reconstituted with coelenterazine n (AEQ3; Montero et al., 2000). This type of aequorin, originally designed to measure [Ca2+] in the ER (Montero et al., 1995, 1997), is able to measure [Ca2+] as high as 1 mm. The figure shows the effect of three consecutive stimulations, two 10 s K+ pulses and a final 30 s K+ stimulation. When cells were treated with 3 µm nisoldipine and 1 µmω-conotoxin GVIA (inhibition of L- and N-type Ca2+ channels), the high K+-induced [Ca2+]M increase was not modified significantly (Fig. 2b). However, when cells were treated with 3 µmω-conotoxin MVIIC (inhibition of P-, Q- and N-type Ca2+ channels; Fig. 2c), the increase in [Ca2+]M induced by 10 s K+ pulses was completely abolished, whereas a 30 s high K+ pulse produced a small response. Figure 2d also shows that the activator of L-type Ca2+ channels, FLP64176 restored mitochondrial Ca2+ uptake in the presence of ω-conotoxin MVIIC. The results shown in 1, 2 are combined and summarized as a bar chart in Fig. 3. The figure shows mean peak [Ca2+]c-values (white bars) and [Ca2+]M-values (black bars) under the different conditions.

Effects of Ca2+ channel blockers on high K+-stimulated [Ca2+]M peaks measured with low Ca2+-affinity AEQ3. Chromaffin cells expressing mutated aequorin were reconstituted with coelenterazine n for 1–2 h in either control cells (panel a), in the presence of 3 µm nisoldipine and 1 µmω-conotoxin GVIA (panel b; in this case nisoldipine was also present during the superfusion and recording period), or in the presence of 3 µmω-conotoxin MVIIC (panels c and d). In panel d, ω-conotoxin MVIIC-treated cells were superfused throughout the experiment with 0.3 µm FPL64176. Each [Ca2+]M trace corresponds to a separate cell batch, and stimulation was obtained by applying 10 or 30 s pulses of medium containing 70 mm KCl (in equimolar substitution for NaCl).
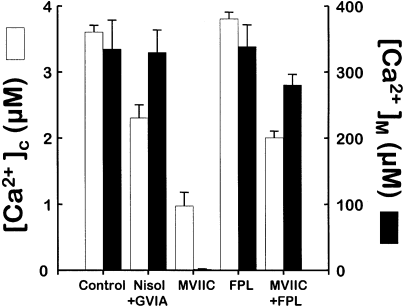
Effects of Ca2+ channel blockers and/or FPL64176 on high K+-stimulated [Ca2+]c and [Ca2+]M peaks. The figure summarizes the data shown in 1, 2 to compare the peak values of [Ca2+]c (white bars) and [Ca2+]M (black bars) under the different conditions. [Ca2+]c data are mean ± SΕΜ of 128 (control), 37 (Nisol + GVIA), 38 (MVIIC) and 53 (FPL and FPL + MVIIC) single cells analysed. The [Ca2+]M data are given as the mean ± SΕΜ of 4–7 experiments of each type.
We have shown previously (Montero et al., 2000) that the amplitude of the [Ca2+]c hot-spot generated around mitochondria after cell stimulation can be estimated from the rate of increase in [Ca2+]M. The rate was very similar in control cells and in cells treated with L- and N-type Ca2+ channel inhibitors (67 ± 2 µm/s, n = 17 and 63 ± 6 µm/s, n = 10, respectively, after a 30 s high K+ stimulation). These rates correspond to a local [Ca2+]c of nearly 20 µm (Montero et al., 2000); by contrast, the rate of [Ca2+]M increase induced by the same stimulus in cells treated with ω-conotoxin MVIIC was only 10 ± 1 µm/s (n = 7). From the dependence of the rate of [Ca2+]M increase on the extramitochondrial [Ca2+] (Montero et al., 2000), we can calculate that mitochondria in this case were surrounded by a [Ca2+]c of about 6 µm. Perfusion of FPL64176 restored the high rate of mitochondrial Ca2+ uptake induced by high K+ in ω-conotoxin MVIIC-treated cells (45 ± 4 µm/s, n = 6).
Wild-type aequorin reconstituted with coelenterazine n (AEQ2; Montero et al., 2000) is almost completely consumed after the first high K+ stimulation in mitochondria close to plasma membrane Ca2+ channels. Subsequent stimulation, not only with high K+ but also with caffeine, produces little further aequorin consumption (Montero et al., 2000). This effect is not due to emptying of the Ca2+ store of the ER. Direct measurements of [Ca2+] inside the ER showed that the steady-state level of [Ca2+] in this organelle was restored rapidly after any of these stimuli (Alonso et al., 1999). In fact, caffeine evokes cytosolic [Ca2+]c peaks of normal height after both high K+ or caffeine stimulation (Alonso et al., 1999). The lack of effect on [Ca2+]M with caffeine added as the second stimulus can therefore be explained only on the basis of fast aequorin consumption in a specific population (about 50%) of mitochondria. The rest of the mitochondria respond to high K+ or caffeine with much lower [Ca2+]M peaks that hardly consume any AEQ2 (Montero et al., 2000). This implies that Ca2+ entering through plasma membrane Ca2+ channels induces a large Ca2+ uptake in the same mitochondria that undergo a large Ca2+ uptake after activation by caffeine of ryanodine receptors. Once aequorin in these mitochondria is completely consumed during the first high K+ stimulation, further addition of caffeine will not produce any further signal. This indicates the colocalization of plasma membrane Ca2+ channels and ER ryanodine receptors. Figure 4a and b shows this effect. If caffeine is added as the first stimulus, it produces a large [Ca2+]M peak; if it is added 2 min after a 10 s pulse with high K+, it produces a much smaller effect. Cell treatment with nisoldipine (Fig. 4c), ω-conotoxin GVIA (Fig. 4d), or both together (Fig. 4e) did not modify this pattern of response. However, when cells were treated with ω-conotoxin MVIIC (Fig. 4f), the [Ca2+]M peak induced by high K+ was reduced considerably. Consistently, subsequent addition of caffeine produced a large [Ca2+]M peak similar to the control (Fig. 4a). The small increase in [Ca2+]M induced by the 10 s high K+ stimulation is compatible with the apparent lack of effect of this stimulus shown in Fig. 2c, because of the low Ca2+-affinity of AEQ3. The higher resolution at low [Ca2+] obtained here using AEQ2 enabled the precise measurement of the rate of increase in [Ca2+]M after a 10 s stimulation with high K+ of ω-conotoxin MVIIC-treated cells. The rate obtained (0.7 ± 0.4 µm/s) corresponds to a [Ca2+]c around mitochondria of slightly > 4 µm (Montero et al., 2000).
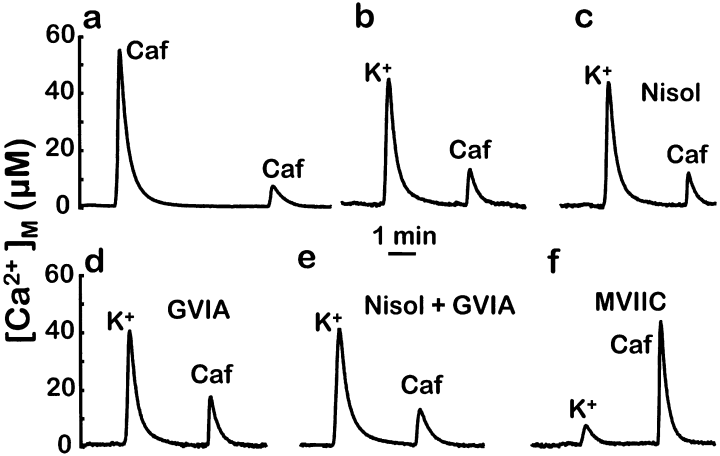
Effects of Ca2+ channel blockers on high-K+ stimulated [Ca2+]M peaks measured with high Ca2+-affinity AEQ2. Chromaffin cells expressing wild-type aequorin were reconstituted with coelenterazine n for 1–2 h in either control cells (a and b), or in the presence of 3 µm nisoldipine (c), 1 µmω-conotoxin GVIA (d), 3 µm nisoldipine and 1 µmω-conotoxin GVIA (e) or 3 µmω-conotoxin MVIIC (f). Panel a shows the effect of two consecutive additions of caffeine (Caf; 50 mm, 30 s). The other panels show the effect in each cell type of the consecutive addition of high K+ medium (70 mm, 10 s) and caffeine (50 mm, 30 s). In panels c and e, nisoldipine was also present throughout the experiment.
Figure 5 shows mean data obtained in experiments similar to those of Fig. 4, using both 10 s (black bars) or 30 s (white bars) high K+ stimuli. The height of the bars corresponds to the percentage of aequorin consumed by the first addition of high K+, with respect to the total aequorin consumed by the two consecutive stimulations with high K+ and caffeine. These values show how good the inhibitors are at blocking Ca2+ entry close to both mitochondria and ryanodine receptors from the ER. The data confirm that inhibition of non-L-type channels specifically reduces Ca2+ entry close to the ryanodine receptors. A 10 s high K+ pulse consumed nearly 90% of high [Ca2+]M aequorin in control cells, so that the subsequent caffeine-induced [Ca2+]M peak consumed only 10%. Treatment with nisoldipine, ω-conotoxin GVIA or both did not modify these values. Instead, treatment with ω-conotoxin MVIIC dramatically reduced aequorin consumption induced by the initial 10 s high K+ pulse. Closed bars show similar data, but calculated from experiments where the high K+ pulse was 30 s. Regarding control cells, there is a barely significant increase in the percentage of AEQ2 consumption induced by high K+. Again here, treatment with nisoldipine, ω-conotoxin GVIA, or both had no effect. However, a 30 s stimulation with high K+ consumed more than half of the AEQ2 in subplasmalemmal mitochondria even in the presence of ω-conotoxin MVIIC.
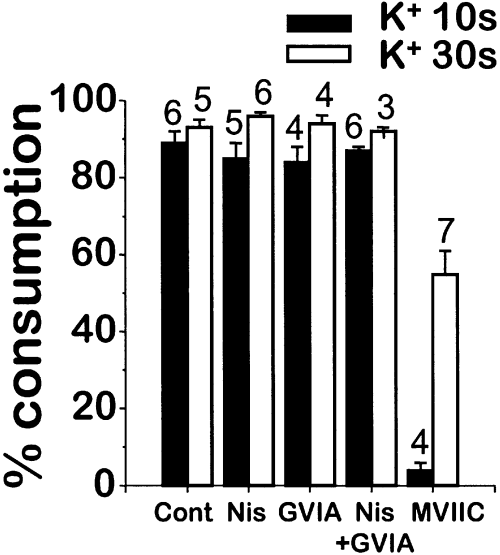
Effect of Ca2+ channels blockers on the relative consumption of AEQ2 induced by consecutive stimulations with high K+ and caffeine. Experiments were performed as described in Fig. 2, panels b–f, using either 10 s (black bars) or 30 s (white bars) high K+ pulses as the first stimulus. Consumption of AEQ2 induced by both high K+ and caffeine was measured. The bars show the mean ± SΕΜ (data number indicated at the top of each bar) values of the percentage of AEQ2 consumption induced by the high K+ stimulus, normalized to the total AEQ2 consumption induced by both consecutive additions of high K+ and caffeine.
The data in 1-5 show that mitochondria take up Ca2+ only when it enters the cell through P/Q-type Ca2+ channels or when Ca2+ entry through L-type channels is enhanced. If our hypothesis is correct and these functional units control exocytosis, then we should find a correlation between mitochondrial Ca2+ uptake and potentiation of secretion by protonophores; this was the case. Figure 6 compares secretion evoked by pulses of high K+ in the absence and in the presence of the protonophore CCCP (2 µm). Representative traces are shown in panel (a) and averages of several experiments are shown in panels (b and c). In the controls, peaks of catecholamine secretion were enhanced approximately twofold after 90 s of prior superfusion with CCCP. The enhancement by CCCP persisted in cells treated with either nisoldipine (3 µm) or nisoldipine plus ω-conotoxin GVIA (1 µm), but was prevented by treatment with ω-conotoxin MVIIC (3 µm; Fig. 6a and b). Therefore, CCCP potentiates secretion when Ca2+ enters through P/Q-type channels, but it is unable to do so when Ca2+ enters only through L-type channels. The question was now whether potentiation by CCCP would be restored by enhancing Ca2+ entry through L-type channels. To stimulate Ca2+ influx through these channels we enhanced their opening by using FPL64176. In the continued presence of 0.3 µm FPL64176, the secretory response to high K+ pulses increased 2–3-times and CCCP further enhanced the secretory response approximately twofold (Fig. 6c). In this case, pretreatment with ω-conotoxin MVIIC (right bars) did not modify secretion, and the response was still potentiated by CCCP.
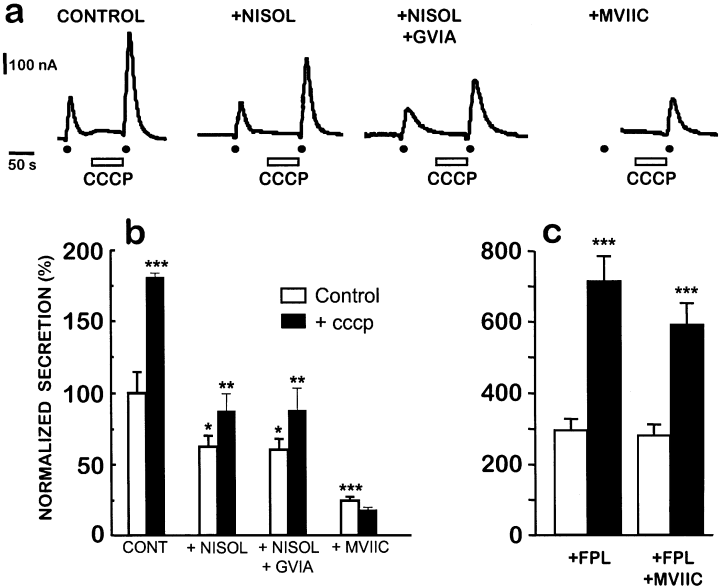
Potentiation by CCCP of catecholamine release evoked by high K+. (a) Cells were preincubated with either control medium (Control) or with 3 µm nisoldipine (+ Nisol), 3 µm nisoldipine and 1 µmω-conotoxin GVIA (Nisol + GVIA) or 3 µmω-conotoxin MVIIC (MVIIC). Cells were stimulated with 10 s pulses of a solution containing 70 mm K+ (dots). CCCP (2 µm) was perfused for 90 s, as indicated. The traces illustrate representative experiments. (b) The histogram shows averaged secretion areas (±SΕΜ) from at least 20 similar experiments performed with cells from at least six different cultures. Data were calculated in µC (µA) and normalized with regard to the untreated controls performed with the same batch of cells. (c) In these experiments the cells were superfused with 0.3 µm FPL64176 and stimulated with 5 s high K+ pulses, both in the absence and in the presence of 2 µm CCCP. Secretion was normalized as in panel (b). The right bars show experiments performed in cells preincubated with 3 µmω-conotoxin MVIIC. ***, P < 0001; **, P < 0005; *, P < 0,05.
Discussion
We have reported previously (Montero et al., 2000) the presence in bovine chromaffin cells of functional units composed of plasma membrane voltage-dependent Ca2+ channels, ER ryanodine receptors and mitochondria, associated to exocytotic sites. In this paper we have extended our study to provide further evidence for the role of mitochondria in the control of secretion, and to investigate the conditions in which this modulation takes place. We found that high K+ stimulation induces a [Ca2+]c peak of about 4 µm, whereas a population of mitochondria senses a microdomain of 20 µm[Ca2+]. When non-L Ca2+ channels were inhibited with ω-conotoxin MVIIC, high K+ stimulation induced a [Ca2+]c peak of only 1 µm and mitochondria sensed a local [Ca2+]c microdomain of about 4 µm. This local [Ca2+]c is below the threshold for fast mitochondrial Ca2+ uptake, and so little Ca2+ was taken up by mitochondria under these conditions. Consistently, CCCP did not potentiate catecholamine secretion in cells treated with ω-conotoxin MVIIC. The L-channel activator FPL64176 partially recovered the high K+-induced [Ca2+]c response and fully restored mitochondrial Ca2+ uptake in the presence of ω-conotoxin MVIIC. Consistently, catecholamine secretion was increased and it again became sensitive to stimulation with CCCP. All of these results show a close correlation between mitochondrial Ca2+ uptake and potentiation of secretion by CCCP. In addition, the lack of effect of CCCP in ω-conotoxin MVIIC-treated cells demonstrates that its potentiation of stimulated secretion in control cells is not due to a nonspecific effect of this drug in the secretory machinery. Rather, it suggests that CCCP potentiates secretion in control cells by abolishing mitochondrial Ca2+ uptake.
The entry of Ca2+ through only P/Q-type channels (with L- and N-type channels inhibited) was enough to trigger fast mitochondrial Ca2+ uptake, which was indistinguishable from that obtained with all the channels active. Therefore, suppression of nearly 40% of Ca2+ entry did not significantly modify mitochondrial Ca2+ uptake. Consistently, catecholamine secretion was potentiated in a similar manner by CCCP under those conditions. These results could be interpreted to conclude that P/Q-type channels are more specifically coupled to the functional units containing mitochondria and ER ryanodine receptors, whereas L- or N-type channels would be situated further away. In fact, we have recently reported functional evidence suggesting that Q-type Ca2+ channels may be located closer to the secretory sites than L-type Ca2+ channels (Lara et al., 1998). Alternatively, these results may also be interpreted on the basis of the presence of a sharp threshold for fast mitochondrial Ca2+ uptake. The Ca2+ uptake by mitochondria has a sigmoidal dependence on [Ca2+]c, so that it remains very slow until [Ca2+]c rises to > 4 µm, and then the rate increases almost linearly until saturation is reached at [Ca2+]c > 40–50 µm (Montero et al., 2000). This threshold might condition a nearly all-or-nothing response of mitochondrial Ca2+ uptake, depending on the percentage of inhibition of Ca2+ entry. High K+ stimulation generates a local [Ca2+]c microdomain of about 20 µm, estimated from the rate of mitochondrial Ca2+ uptake (Montero et al., 2000). Assuming that the magnitude of that microdomain is proportional to Ca2+ entry, 70% inhibition of Ca2+ entry would give microdomains of 6 µm, the local [Ca2+]c we estimate after 30 s high K+-stimulation in the presence of ω-conotoxin MVIIC (Fig. 2). If the local [Ca2+]c decreases any further, the rate of [Ca2+]M increase drops dramatically. 2, 3 show that this rate decreases 20-fold when the local [Ca2+]c is reduced from 6 to 4 µm. Therefore, 40% inhibition (that expected from L- and N-type channel inhibition) of Ca2+ entry might produce relatively small changes in mitochondrial Ca2+ uptake but 70–80% inhibition could nearly abolish it. This alternative view is also reinforced by several findings. First, potentiation of Ca2+ entry through L-type Ca2+ channels with FPL64176 restored both mitochondrial Ca2+ uptake and stimulation by CCCP of catecholamine release in ω-conotoxin MVIIC-treated cells. Second, FPL64176 strongly increased high K+-induced secretion in control cells, whereas the [Ca2+]c peak was modified very little, and this stimulated secretion was hardly inhibited by ω-conotoxin MVIIC, although [Ca2+]c peaks were reduced by 37% (from 3.8 µm to 2.4 µm). These puzzling data reflect a dissociation between the magnitude of global [Ca2+]c peaks and the secretory rate, and could be interpreted as meaning that activated L-type channels are also closely coupled to secretion in these cells.
In conclusion, although we cannot exclude the possibility that a particular type of Ca2+ channel could have a preferential spatial relationship with the functional units, our data stress the point that mitochondrial fast Ca2+ uptake has a very sharp threshold, at around 5 µm[Ca2+]c. Although mitochondrial Ca2+ uptake starts at much lower [Ca2+]c values (about 0.5 µm; see Herrington et al., 1996; Colegrove et al., 2000), translation of [Ca2+]c changes into [Ca2+]M changes is not linear. Below 4 µm[Ca2+]c, the rate of mitochondrial Ca2+ uptake is low (< 1 µm/s) but at 7 µm[Ca2+]c, the rate increases to about 20 µm/s, and rates above 100 µm/s can be obtained when the local [Ca2+]c reaches 40 µm (Montero et al., 2000). If [Ca2+]c changes do not reach 4–5 µm, the accompanying changes in [Ca2+]M are relatively small, although they may be enough to activate mitochondrial metabolism. Instead, if the local [Ca2+]c reaches over these values, fast [Ca2+]M uptake is triggered and mitochondria could act as a Ca2+ sink. As a consequence, mitochondria can modulate secretion (or, in general, subplasmalemmal [Ca2+]c) only when the stimuli raise the local [Ca2+]c above that threshold. The local [Ca2+]c known to be required for catecholamine secretion in chromaffin cells or for neurotransmitter secretion in neurons are well above that threshold (Neher, 1998). Even though these large [Ca2+] are very short-lasting, [Ca2+]M could increase in an accumulative way during a train of depolarizing pulses because the release of Ca2+ from mitochondria is relatively slow (Montero et al., 2000). Physiological stimulation of the adrenal gland by acetylcholine generates spikes of action potentials, and a burst of action potentials may be evoked in response to repetitive discharges of acetylcholine from the splanchnic nerve. This means that mitochondria are perfectly suited to take up Ca2+ and modulate secretion in response to physiological stimuli. Whether, and to what extent, this modulation actually operates under physiological conditions will require further study.
Acknowledgements
Financial support from Dirección General de Enseñanza Superior to J.A. (PM98/0142) and J.G.-S. (PB97/0474), from Dirección General de Investigación Científica y Técnica (PB94/0150) and Janssen-Cilag to A.G.G., and from Junta de Castilla y León to J.A. (VA19/99) and to M.T.A. (VA62/99) is gratefully acknowledged. I.C.I. and A.A. hold fellowships from Ministerio de Educación y Ciencia.
Abbreviations
-
- AEQ2
-
- wild-type aequorin reconstituted with coelenterazine n
-
- AEQ3
-
- mutated aequorin reconstituted with coelenterazine n
-
- [Ca2+]c
-
- cytosolic [Ca2+], [Ca2+]M, mitochondrial [Ca2+], CCCP, carbonyl cyanide m-chlorophenyl-hydrazone
-
- DMEM
-
- Dulbecco's modified Eagle medium.


