Signal detection in amplitude-modulated maskers. II. Processing in the songbird's auditory forebrain
Abstract
In the natural environment, acoustic signals have to be detected in ubiquitous background noise. Temporal fluctuations of background noise can be exploited by the auditory system to enhance signal detection, especially if spectral masking components are coherently amplitude modulated across several auditory channels (a phenomenon called ‘comodulation masking release’). In this study of neuronal mechanisms of masking release in the primary auditory forebrain (field L) of awake European starlings (Sturnus vulgaris), we determined and compared neural detection thresholds for 20-ms probe tones presented in a background of sinusoidally amplitude modulated (10-Hz) noise maskers. Responses of a total of 34 multiunit clusters were recorded via radiotelemetry with chronically implanted microelectrodes from unrestrained birds. For maskers consisting of a single noise band centred around the recording site's characteristic frequency, a substantial reduction in detection threshold (21 dB on average) was found when probe tones were presented during envelope dips rather than during envelope peaks. Such effects could also explain results obtained for masking protocols where the on-frequency noise band was presented together with excitatory or inhibitory flanking bands that were either coherently modulated (in-phase) or incoherently modulated (phase-shifted). Generally, masking release for probe tones in maskers with flanking bands extending beyond the frequency range of a cell cluster's excitatory tuning curve was not substantially improved. Only some of the neurophysiological results are in agreement with behavioural data from the same species if only the average population response is considered. A subsample of individual neurons, however, could account for behavioural thresholds.
Introduction
In the natural environment, acoustic signals have to be distinguished from background noise that typically exhibits temporal patterns (Richards & Wiley, 1980; Klump, 1996). Noise transmitted over a distance does not fluctuate randomly in intensity across frequencies, but shows considerable fluctuations in amplitude that are correlated in different spectral ranges (e.g. Nelken et al., 1999). European starlings (Sturnus vulgaris— a true songbird; Klump & Langemann, 1995; Langemann & Klump, 2001) as well as humans (e.g. see review in Moore, 1992) and other mammals (Kittel et al., 2000; Niemiec et al., 2000) can take advantage of coherent amplitude fluctuations in different frequency bands of a masking noise to substantially improve signal detection in psychophysical experiments. Hall et al. (1984) termed this effect ‘comodulation masking release’ (CMR).
Mechanisms underlying CMR are generally attributed to two distinct categories. Mechanisms of the first category exploit ‘within-channel cues’ that are extracted by the auditory system from a single perceptual channel (auditory frequency filter). Examples are mechanisms detecting the changes of the envelope spectrum of a sound occurring when a signal is added to a masker (Schooneveldt & Moore, 1989) or mechanisms exploiting temporal masking patterns within a single auditory filter (e.g. Gralla, 1991, 1993). Mechanisms of the second category exploit ‘across-channel cues’, i.e. compare acoustic information across different frequency channels of the auditory system. In this type of mechanism, both temporal and spectral cues in perceptual channels that are separate from the auditory filter tuned to the signal of interest convey information improving detection of the signal (e.g. Buus, 1985; Moore, 1992).
Although there has been considerable interest in the mechanisms producing CMR, their neural bases are still debated and only few studies have presented evidence of neuronal masking release in the auditory system (Mott et al., 1990; Henderson et al., 1999; Nelken et al., 1999; Winter et al., 2000). None of these studies compared neuronal responses and psychophysical performance in the same species. Here we present data on neuronal release from masking recorded from the primary auditory forebrain of freely moving European starlings and compare these with psychophysical data obtained from the same species (Langemann & Klump, 2001). Using sinusoidally amplitude-modulated (SAM) noise bands as maskers, temporal and spectral effects of CMR could be addressed separately. Neuronal masking phenomena involving a single auditory filter (i.e. based on analysing within-channel cues only) were investigated by spectrally placing probe signal and maskers within a recording site's frequency-tuning curve (the putative neural correlate of a perceptual auditory filter; see Pickles, 1979; Ehret & Merzenich, 1985, 1988; Evans et al., 1992; Buus et al., 1995; Langemann et al., 1995). Mechanisms involving neural computation across frequency channels were studied by spectrally positioning masker components remote from the excitatory frequency-tuning curve of cell clusters at frequencies suppressing the spontaneous firing of the neurons of a cluster. (Some of these data have been presented in abstract form; Langemann et al., 2000).
Materials and methods
Surgery and chronic recordings
Recordings were obtained from eight wild-caught adult starlings, Sturnus vulgaris, of both sexes. A detailed description of the manufacturing of electrodes and the preparation is given elsewhere (Nieder & Klump, 1999a). Briefly, flexible microelectrodes with impedances ranging from 300 kΩ to 1 MΩ were made from polyimide-insulated nickel-chrome resistance wires (17 µm core diameter) that were sharpened at the tip (Jacob & Krüger, 1991). A maximum of 14 microelectrodes was attached to an Amphenol IC-socket connector and implanted as bundles.
Birds were given atropine (0.05 mL) subcutaneously and anaesthetized with 0.8–3% halothane. They were fixed in a stereotaxic holder and body temperature was maintained with an electric heating pad. Electrodes were implanted chronically into the input layer of the field L complex (L2a), according to stereotactic coordinates. In addition, a small socket was glued onto the skull to carry the FM-transmitter. The care and treatment of these birds were in accordance with the procedures of animal experimentation approved by the Government of Upper Bavaria, Germany. All procedures were performed in compliance with the NIH Guide for the Care and Use of Laboratory Animals (1996).
All multiunit data presented here were recorded via radiotelemetry from unrestrained birds. During the recording sessions, the bird rested in a small cage (25 × 53 × 35 cm) inside a custom-built, sound-attenuating booth. Food and water was provided ad libitum. As birds were habituated to the stimuli, they usually rested calmly during recording sessions on the only perch provided in the centre of the cage. A miniature FM-radiotransmitter (Type 40–71–1, Frederick Haer & Co., USA) with a high-impedance input stage was inserted into the socket on the bird's skull and transmitted neuronal activity. Multiunit signals were filtered (band-pass 500–5000 Hz), amplified and stored to disk of a Silicon Graphics Indy Workstation (Silicon Graphics, USA). Recordings containing artefacts (amplitude peaks of more than about twice the level of the typical signal of the neuronal discharge) were rejected automatically and the stimulus was presented again. The stimulus was repeated 32 times and in all cases the first 20 artefact-free runs were included in the analysis. With the rate of stimulus presentation used, no obvious effect of habituation was observed. The multiunit activity (‘impulses’) was extracted using window-discriminator software, i.e. an amplitude-threshold device with a constant nontriggering delay of 0.5 ms. The recordings were stable after implantation for time periods extending over several days, since electrodes were not moved once implanted. The background activity and reproducibility of frequency tuning was checked repeatedly during the recording session at each site. Making comparisons with discharge rates reported for single units in the starlings' field L (Leppelsack, 1974; Capsius & Leppelsack, 1996), we estimate that we recorded the activity of approximately five cells per electrode (see also Nieder & Klump, 1999a).
After experiments, birds were killed with an overdose of sodium pentobarbital. Brains were fixed and frozen sagittal sections (50 µm) were cut and stained with cresyl violet. Electrode tips were allocated to different subregions of the field L complex using morphological criteria. Only recording sites found within the input layer L2a were analysed for the current study. For a more detailed description of the histology and criteria for unit selection see Nieder & Klump (1999a).
Auditory stimulation
The sound field was calibrated with a sound-level meter (General Radio 1982 precision sound-level meter; GenRad, USA) and a condenser microphone (General Radio 1/2′ microphone type 1962–9611) that was placed at about the location where the bird's head would be while it was sitting on the perch.
A UNIX workstation (Silicon Graphics Indy) produced all stimuli at a sampling rate of 32 kHz with a 16-bit digital-to-analogue converter. Using the workstation's stereo output, probe tones and maskers could be presented simultaneously by mixing the two channels in a Yamaha A-520 hi-fi amplifier (Nippon Gakki, Japan). The stimuli were adjusted in level by a computer-controlled attenuator (TDT PA 4; Tucker-Davis Technologies, USA) and played through a single midrange speaker (100MT; McFarlow, France) mounted at the ceiling of the booth.
Prior to masking experiments, frequency-tuning curves (FTC) were measured for each recording site by analysing responses to 169 different frequency-level combinations of 250-ms tone bursts (five repetitions, 750 ms interstimulus interval). An excitatory FTC and inhibitory sidebands were constructed for each recording site using a statistical criterion (for details see Nieder & Klump, 1999a).
In the current study, a test tone (‘probe’) was played together with SAM noise (‘masker’). The probe was a 20-ms tone including 10 ms-Gaussian rise/fall. The probe tone frequency was always identical to the recording site's characteristic frequency (CF; the frequency that excites the neurons at a minimum level). Probe-tone levels were presented in 5 dB-steps from 10 dB to 70 dB SPL (sound pressure level).
The maskers consisted of digitally synthesized noise bands of 100 Hz bandwidth. The envelope of all noise bands (400 ms duration) was modulated with a 10-Hz sinusoid (100% depth of modulation), thus generating SAM noise. The probe tone was presented at different positions relative to the envelope of the masking noise (i.e. at different envelope phase). Each level/masker condition was repeated 20 times and responses were averaged.
Two different stimulation protocols were applied (for an example of a tuning curve and the different noise bands see Fig. 1). In the first stimulus condition, a single on-frequency SAM noise band with the spectrum centred around a recordings site's CF was presented at a spectrum level 20 dB above the threshold (threshold for the 100 Hz noise band was determined from rate-level functions for each individual multiunit recording). The probe was presented at four different positions relative to the masker envelope: 190 ms after masker onset right at an envelope dip (0° probe position), 215 ms after masker onset at the rising flank of an envelope maximum (90° probe position), 240 ms after masker onset right at an envelope maximum (180° probe position) and 265 ms after masker onset at the declining flank of an envelope maximum (270° probe position). The top panel of Fig. 2 illustrates the single on-frequency SAM masker condition.
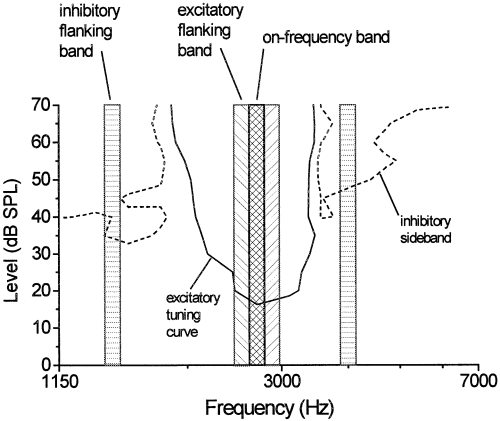
Position of frequency bands used in the various masker configurations in relation to the frequency-tuning properties of an exemplary unit cluster. The characteristic frequency (CF) of this recording site was 2700 Hz. A 100-Hz-wide on-frequency band (cross-hatched) was generated that consisted of spectral components ranging from 2650 to 2750 Hz. Flanking bands that were spectrally adjacent to the on-frequency band were used to generate the three-component excitatory masker (hatched). All three excitatory noise bands together covered a range of 300 Hz centred around the CF. For three-component maskers involving both excitation and inhibition, flanking bands (100 Hz bandwidth each) with spectral components in the range of the inhibitory sidebands were presented in addition to the on-frequency band (horizontally hatched). In all masking conditions the probe tone frequency was the CF.
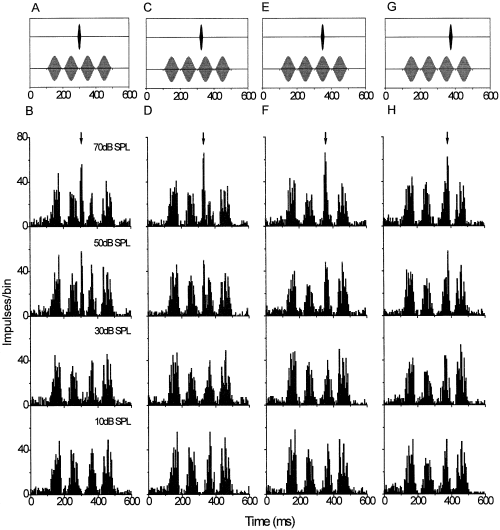
Response of a multiunit cluster to probe tones masked by a single sinusoidally amplitude-modulated on-frequency noise band. The characteristic frequency and, thus, probe tone frequency of this recording site was 1200 Hz. Top-row panels illustrate the stimulus configuration (for clarity, probe tone and masker are shown separately). Relative to the masker envelope, the probe tone was presented at the dip (A and B), the rising flank (C and D), the peak (E and F) and the declining flank (G and H). Peristimulus time histograms below each stimulus panel represent the neuronal discharge integrated over 20 stimulus repetitions (binwidth 5 ms). From bottom to top, the probe level was increased from 10 to 70 dB SPL. The arrow points to the time at which the probe-driven response occurs.
In the second stimulus condition using three-component maskers, the probe was always presented 190 ms after masker onset, but three SAM noise bands were applied simultaneously as the masker (Fig. 1). These three masking bands were presented with different temporal (i.e. envelope phase) and spectral relationships. From a temporal point of view, the onset times of the three masking bands were either identical (i.e. sinusoidal envelopes of all SAM noise bands in phase; ‘coherently modulated SAM noise’), or the onset times of the second and third noise bands were shifted by 25 ms and 50 ms, respectively (i.e. envelopes of individual noise bands were phase shifted by 90° relative to the preceding noise envelope; ‘incoherently modulated SAM noise’). Two types of maskers were presented that differed in spectral composition. (1) The three noise bands covered a 300-Hz band of adjacent frequencies centred around the CF. All three noise bands had a spectrum level of 20 dB above the noise threshold. (2) Only the (excitatory) on-frequency noise band was centred around the CF, while the two flanking bands of noise were positioned spectrally at the inhibitory sidebands remote from the CF that was shown to suppress the neurons' activity. In condition (2), only the first excitatory noise band was played at a level of 20 dB above noise threshold, while both flanking noise bands were presented at a level of 40 dB above the (excitatory) threshold at CF to account for the fact that suppression or inhibition affects the neuronal responses only at higher levels than those eliciting excitation at CF (Nieder & Klump, 1999a, b).
Data analysis
Spectral tuning properties (frequency tuning and inhibitory sidebands) and latencies of each multiunit cluster were determined by statistical criteria, as described in Nieder & Klump (1999a). The combined activity evoked by the probe and the simultaneously played noise masker was analysed in a 20-ms-time window (according to the probe duration) that was shifted by the cluster's response latency. Activity in this time window will be called ‘probe-plus-masker-driven activity’.
An identical analysis window was used to examine the response that was elicited by the masker alone to 80 (single on-frequency band condition) or 40 (three-component SAM masker condition) stimulus repetitions. Activity elicited by the masker alone was used as the reference activity to calculate a neuronal detection threshold for the probe. A neuronal detection threshold for the probe tone was reached if the discharge rate elicited by probe and masker together was just significantly different from the response evoked by the masker alone (binomial test, criterion, P < 0.01). Non-parametric statistics were used to analyse differences in neuronal detectability (all P-values, two-tailed).
Results
The responses of a total of 34 multiunit clusters were tested under different masking conditions. All recording sites presented here were located in the input layer (L2a) of the avian auditory forebrain (field L complex). Frequency tuning was measured for each recording site by analysing responses to 169 different frequency-level combinations of tone bursts in silence (for details see Nieder & Klump, 1999a). Clusters showed a phasic-tonic temporal discharge pattern to pure tones (i.e. a ‘primary-like’ response pattern that is similar to the pattern found in auditory-nerve fibres). Their CFs were in the range of 1.0–6.8 kHz, which covered the starling's range of sensitive hearing. Thresholds at CF varied between 11.4 and 39.6 dB SPL (average 21.1 dB SPL). The majority of clusters (76%) had inhibitory sidebands on one or both flanks of the FTC (Fig. 1). We have presented evidence elsewhere that the reduced activity in the sidebands flanking the excitatory tuning curves may be, at least in part, due to inhibition (for more details of the basic response properties of the units see Nieder & Klump, 1999a).
Probe tone masking in relation to the on-frequency masker envelope
The most elementary masking paradigm described in this study involved stimulation with a probe tone at the units' CF and a single, narrow-band noise masker (on-frequency band) that was centred around the probe tone frequency (or CF, respectively). Since masking effects depended critically on excitation caused by the amplitude-modulated noise band, discharge to the masker alone will be considered first.
Neurons responded with distinct discharge maxima and minima to the 10 Hz modulation frequency of the CF-centred 100 Hz noise band played at a level of 20 dB above noise threshold. For all clusters, summed activity in peristimulus time histograms (PSTH) clearly mirrored peaks and troughs of the masker's sinusoidal amplitude modulation (Fig. 2). Averaged activity to the masker alone with the analysis window set at different positions relative to the envelope phase represented one cycle of the sinusoidal modulator (Fig. 4A). Responses evoked during the dip (0° position), the rising flank (90° position), the peak (180° position) and the descending flank (270° position) of the masking-noise envelope were significantly different from each other (Wilcoxon matched-pairs signed-ranks test, all P < 0.01, n = 34). Highest discharge rates were observed at the envelope peak (mean, 215 impulses/sec ± 93 SD), followed by the envelope 90° position (169 impulses/sec ± 75 SD) and 270° position (124 impulses/sec ± 58 SD). Minimum activity was evoked at the dip of the noise bands' envelope at 0° (28 impulses/sec ± 16 SD).
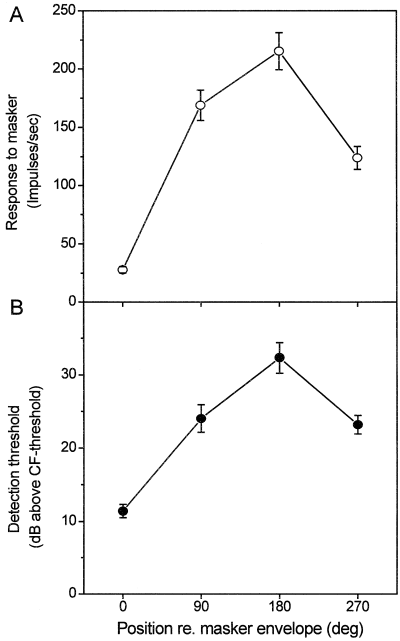
Neuronal multiunit responses to sinusoidally amplitude-modulated noise and detection thresholds for masked probes. (A) Discharge evoked by the masking noise alone during the dip (0° position), the rising flank (90° position), the peak (180° position) and the declining flank (270° position) of the envelope were significantly different from each other (see text for statistics). (B) Neuronal detection thresholds for the characteristic frequency probes varied relative to the phase of the masker envelope. Masking was minimal at the envelope dip and maximal at the envelope peak, with intermediate detection threshold at 90° and 270° masker envelope (Error bars ± SE).
Probe tones were presented at four positions relative to the masker's envelope. Figure 2 displays the rise of the probe-driven response compared with the discharge evoked by the masker alone. The probe-driven response was most prominent for tones presented during the masker dip (0° position) where the phasic onset discharge to the tone signal occurred in a masker dip with low background activity. Responses to probes presented at the flanks or at the envelope peak were concealed by the masker-elicited activity and, thus, more difficult to separate at low probe-tone levels. At the highest probe-tone level of 70 dB SPL, however, the probe-driven response clearly exceeded the masking background activity for all probe tone positions. Rate-level functions (Fig. 3) derived for the cluster shown in Fig. 2 illustrate the masking effect at different envelope positions. Excitation caused by the masking noise raised the sound pressure level at which probe-driven activity emerged from the background, and could be discriminated from the masker-driven activity statistically. At higher probe-tone levels (55 dB SPL and more), activity elicited by masker plus probe at the four different positions was about the same. This indicates that discharge at levels well above detection threshold was primarily determined by the probe-driven response.
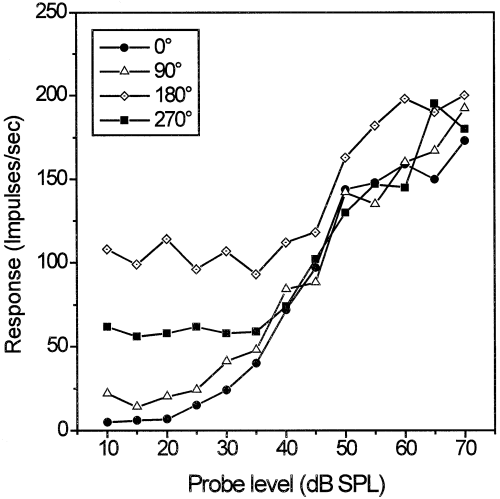
Rate-level functions for probe tones masked by a single sinusoidally amplitude-modulated noise (same neuron cluster as in Fig. 2). The best threshold at the characteristic frequency in silence (derived from the frequency tuning curve) was 23 dB SPL. The legend indicates probe position relative to the masker envelope. Neuronal detection thresholds of this cell cluster were 29 dB SPL (0° position), 33 dB SPL (90° position), 51 dB SPL (180° position) and 44 dB SPL (270° position).
Detection thresholds for CF probes depended critically on the position in time relative to the SAM masker envelope (Fig. 4B). The masking effect was minimal during the envelope dip (0° position) with a mean detection threshold of 11.4 dB above CF threshold. On average, probe-tone levels needed for detection had to be increased by an additional 21 dB (i.e. the detection threshold was found to be 32.3 dB above CF threshold) during the peak of the masker envelope. Intermediate detection thresholds were observed for probes at a position of 90° (24.1 dB above CF threshold) and 270° (23.2 dB above CF threshold). Except for detection thresholds at a position of 90° and 270°, all thresholds were significantly different from each other (Wilcoxon matched-pairs signed-ranks test, all P < 0.01, n = 34).
Probe tones presented in three-component excitatory maskers
To investigate masking effects caused by multiple noise bands that exhibit amplitude fluctuations, an on-frequency SAM noise band together with two flanking SAM noise bands were used as maskers. The first three-component masking protocol consisted of flanking bands whose spectra were directly adjacent to the on-frequency band (see Fig. 1 for illustration). Therefore, all three SAM noise bands excited the recording site.
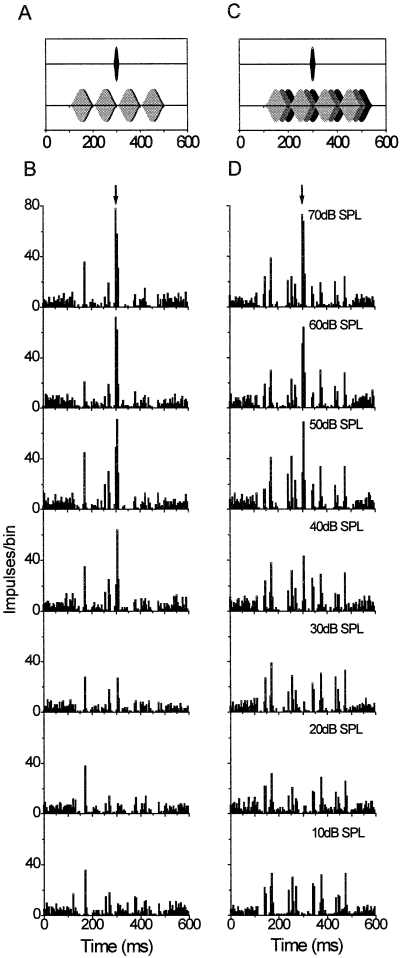
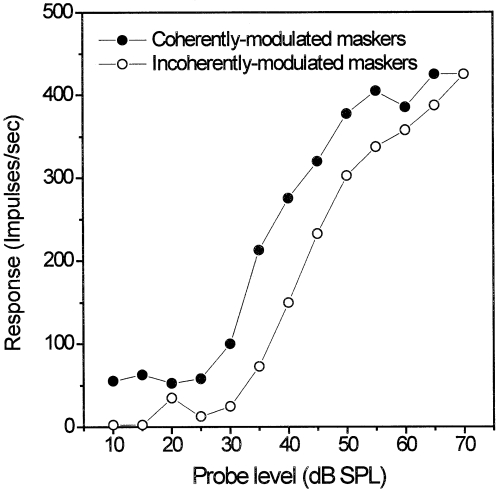
In Fig. 5, the responses of an exemplary multiunit cluster to probe tones embedded in coherently modulated or incoherently modulated (i.e. envelopes of individual noise bands shifted in phase by 90° relative to each other) SAM noise bands are illustrated in detail. When all three SAM maskers were presented in phase (Fig. 5A and B), distinct peaks and troughs appear in the PSTH as a response to the masker. This response was similar to that observed in the condition when only a single on-frequency band of 100 Hz bandwidth was used (see Fig. 2 for comparison). As a consequence, the probe-driven response occurred at intervals of minimum background activity and could emerge from the background at relatively low probe-tone levels. The probe-driven response is clearly visible at a level of 30 dB SPL in the documented case. On the other hand, if the envelopes of the flanking bands were phase shifted relative to each other and to the phase of the on-frequency band, the pattern of excitation caused by SAM maskers largely lost the discrete temporal structure mirroring the 10 Hz envelope (Fig. 5C and D). In this case, masker-driven responses resembled discharges evoked by noise with a more steady envelope without prominent dips. The probe-tone level at the neuronal detection threshold was increased by about 10 dB compared with the coherently modulated condition, because probe detection during presentation of incoherently modulated SAM noise happened at temporal intervals during which the second flanking noise band reached its amplitude maximum and, thus, considerably excited the recording site. Rate-level functions plotted for the same cell cluster as shown in Fig. 5 indicate that the masking effect can be attributed to the elevated activity level caused by the masker (Fig. 6). Probe-plus-masker-driven discharge was similar for coherently and incoherently modulated maskers above detection thresholds.
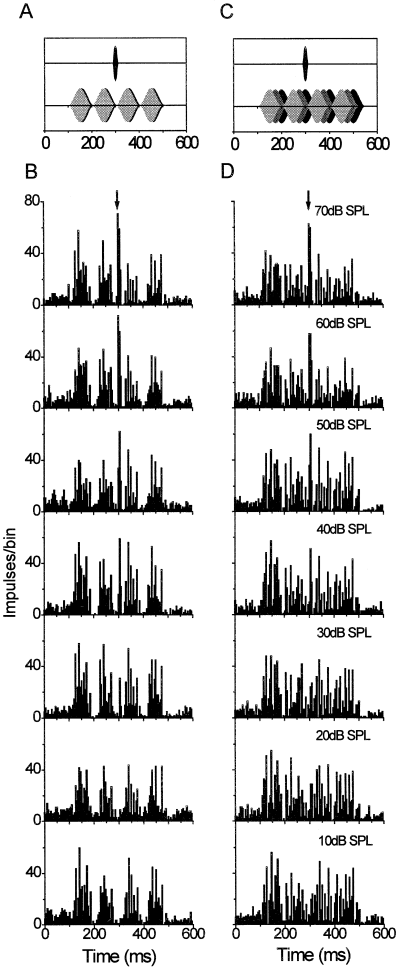
Response of a multiunit cluster to probes masked by three excitatory sinusoidally amplitude-modulated noise bands. Masking bands were either coherently modulated (A and B, left column) or incoherently modulated (C and D, right column). Peristimulus time histograms below each stimulus panel (B and D) represent neuronal discharge integrated over 20 stimulus repetitions (binwidth 5 ms). From bottom to top, probe level was increased from 10 to 70 dB SPL. Note the increasingly prominent discharge about 200 ms after masker onset elicited by the probe at higher levels. The arrow points to the temporal position at which the probe-driven response occurs.
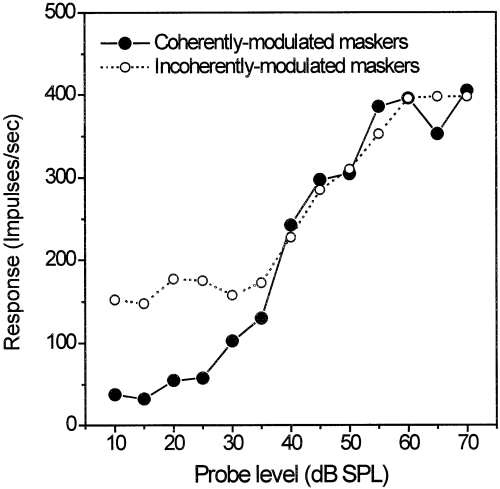
Exemplary rate-level functions for probe tones masked by three excitatory sinusoidally amplitude-modulated noise bands (cell cluster same as in Fig. 5).
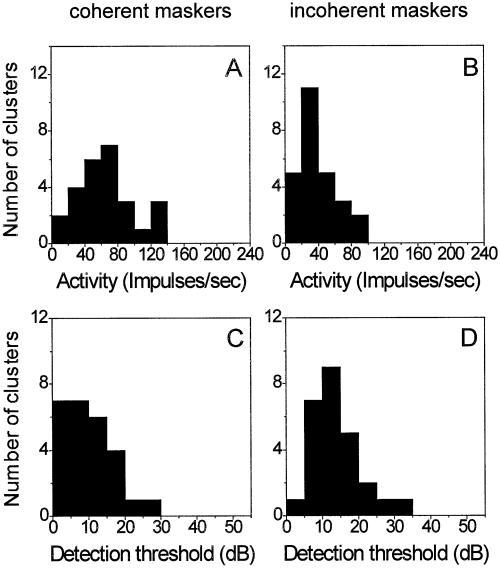
Summary data for all recording sites tested with three-component excitatory maskers are shown in Fig. 7. Impulse rates evoked by the masker alone at the temporal position where the probe tone response appeared during the masking experiments were significantly lower for coherently modulated SAM bands (33 impulses/sec ± 14 SD) compared with incoherently modulated SAM noise (107 impulses/sec ± 52 SD) (Wilcoxon matched-pairs signed-ranks test, P < 0.0001, n = 31). Correlated with the different amounts of background activation, mean detection thresholds for probe tones were significantly lower in coherently modulated SAM bands (10.1 dB above CF threshold) than in incoherently modulated SAM noise (19.3 dB above CF threshold), with a difference in detection thresholds of 9.2 dB (Wilcoxon matched-pairs signed-ranks test, P < 0.0001, n = 31).
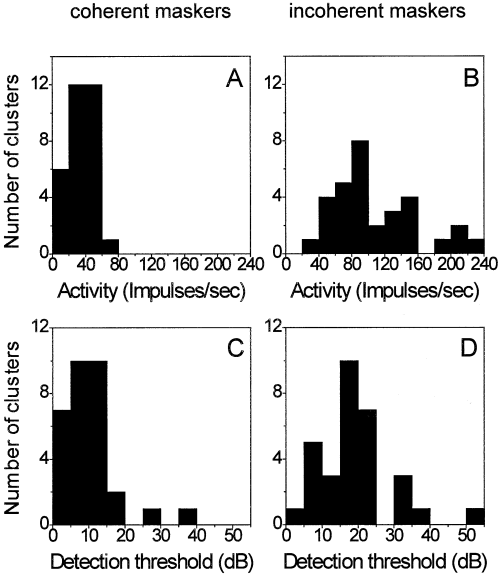
Frequency distribution of neuronal activity in a sample of 31 recording sites elicited by three excitatory sinusoidally amplitude-modulated noise bands (A and B) and the frequency distribution of the detection thresholds of probes for the same neurons (C and D). Average activity (A) and detection thresholds (C) for coherently modulated maskers are lower than the average activity (B) and detection threshold (D) for incoherently modulated maskers.
Probe tones presented in maskers with both excitatory and inhibitory components
Auditory neurons are not only affected by spectral components within the excitatory FTC, but their responses are also modified by suppressive and inhibitory effects elicited by signals with frequency components that form sidebands of the FTC. Twenty-six of the tested neuron clusters exhibited sideband inhibition at least on one side of the FTC. To test the role of sideband inhibition, the second three-component masking protocol consisted of a masker with one excitatory on-frequency band and two flanking bands with a spectrum incorporating inhibitory frequencies remote from the on-frequency band (see Fig. 1 for illustration). Note that the level of flanking bands was set to be 20 dB above the level of the on-frequency band, since higher levels are necessary to elicit sideband inhibition (see Nieder & Klump, 1999a).
PSTHs plotted in Fig. 8 (same cell cluster as displayed in Fig. 5) show the responses to on-frequency and inhibitory flanking bands for coherently modulated and incoherently modulated envelopes. For coherently modulated SAM noise bands (Fig. 8A and B), overall activity of the recording site was similar to or even lower than spontaneous activity (which can be evaluated during the first 100-ms time interval where no signal was presented). Inhibitory flanking bands almost completely suppressed excitation by the on-frequency band. Some excitation (for example about 60 ms after masker onset) was probably due to the occasional occurrence of envelope dips in both flanking bands (random amplitude dips are inherent in narrow-band noise, as was used in this study). However, if the envelopes of flanking bands were time shifted (incoherently modulated noise bands; Fig. 8C and D), spectral components at the rising envelope of the on-frequency band were not overlapped by components at inhibitory frequencies. Thus, distinct periods of excitation alternated with intervals of substantial inhibition (right column, Fig. 8D). Rate-level functions (Fig. 9) for the cell cluster, whose PSTHs are displayed in Fig. 8, showed that the background activity for incoherently modulated maskers was completely reduced at the temporal position at which the probe-driven response occurred at higher probe levels. In contrast, for coherently modulated maskers in which no inhibitory spectral energy was present in the simultaneous dip of the three maskers' bands, the activity was higher (about 50 impulses/sec in the example shown here) at this position than for the phase-incoherent masker configuration.
Response of a unit cluster to probes masked by an excitatory on-frequency sinusoidally amplitude-modulated (SAM) noise band and two inhibitory flanking SAM noise bands (same recording site as in Fig. 5). Masking bands were either coherently modulated (A and B, left column) or incoherently modulated (C and D, right column). All other conventions are as in Fig. 7. Note that the discharge to the excitatory on-frequency noise is suppressed substantially by the inhibitory flanking bands, especially in the case of coherently modulated noise bands (left column).
Averaged impulse rates for the SAM noise alone (Fig. 10A and B) at the same temporal position at which the probe tone was presented in the masking experiments were significantly higher for maskers with coherently modulated envelopes (64 impulses/sec ± 32 SD) than for maskers with incoherently modulated envelopes (40 impulses/sec ± 24 SD, Wilcoxon matched-pairs signed-ranks test, P = 0.0002, n = 26). Neuronal detection thresholds differed significantly by 3.4 dB between coherent and incoherent maskers involving both excitation and inhibition (Wilcoxon matched-pairs signed-ranks test, P = 0.0007, n = 26). Detection thresholds for probes in coherently modulated maskers was 9.9 dB above CF threshold and 13.3 dB above CF threshold in the incoherently modulated masker condition (Fig. 10C and D).
Frequency distribution of neuronal activity in a sample of 26 recording sites elicited by one on-frequency excitatory noise bands plus two inhibitory flanking sinusoidally amplitude-modulated noise bands (A and B) and the frequency distribution of the detection thresholds of probes for the same neurons (C and D). Average activity (A) and detection thresholds (C) for coherently modulated maskers are lower than the average activity (B) and detection threshold (D) for incoherently modulated maskers.
Comparing different masking conditions
Neuronal detection thresholds did not differ between the three masking conditions (Fig. 11, black columns; Friedman one-way anova, P > 0.05, n = 25) that presented the probe tone at an envelope dip (i.e. maskers consisting of the on-frequency band only with probe position 0° or coherently modulated three-component maskers with either excitatory or inhibitory flanking bands). Pairwise comparisons of the masker-only driven responses at the envelope dip, however, revealed that activity evoked in the three-component configuration with inhibitory flanking bands was significantly higher (66 impulses/sec; Wilcoxon matched-pairs signed-ranks test, P = 0.0001, n = 25) compared with both conditions with a single on-frequency band (28 impulses/sec) or three-component excitatory masking bands (33 impulses/sec), which did not differ in discharge rate.
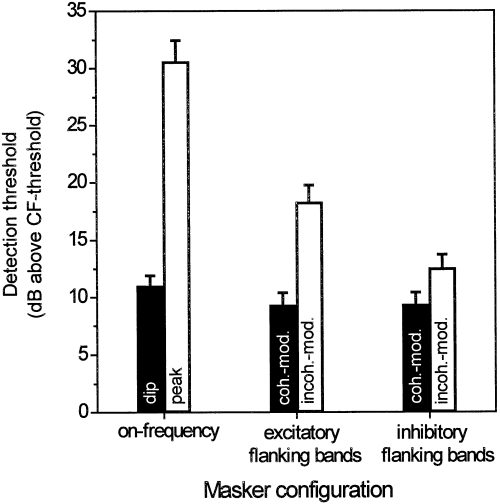
Comparison of average detection thresholds for all three masking conditions. Black columns indicate (left to right) masking conditions where the probe tone was presented at an envelope dip in a single on-frequency band (probe position 0°), in coherently modulated excitatory three-component maskers and in coherently modulated maskers with inhibitory flanking bands. White columns indicate (left to right) masking conditions where the probe tone was presented at an envelope peak in a single on-frequency band (probe position 180°), in incoherently modulated excitatory three-component maskers and in incoherently modulated maskers with inhibitory flanking bands (mean ± SE).
Detection thresholds for signals played at the envelope peak of a single on-frequency band were highest compared with thresholds in incoherently modulated three-component maskers with excitatory or inhibitory flanking bands (Fig. 11, white columns). This order of detection thresholds was mirrored by activity evoked by the masker alone in these conditions. Activity at the peak of an on-frequency band was, on average, 176 impulses/sec, followed by a mean discharge of 115 impulses/sec for incoherently modulated excitatory flanking bands and 78 impulses/sec for incoherently modulated inhibitory flanking bands (all pairwise comparisons with P < 0.01). (Values are slightly different compared with 4, 7, 10, as only a restricted number of recording sites was available for this paired analysis.)
Discussion
Neuronal masking effects caused by SAM noise bands were prominent at the level of the starling's primary auditory forebrain. A substantial release from masking was observed as a function of probe position relative to the envelope of the maskers. This indicates that the starling's auditory system is very effective in exploiting temporal cues. Most of the masking release observed under different conditions could be attributed to responses within the units' excitatory frequency-tuning curve. Spectral masker components remote from the excitatory signal frequency generally failed to cause an additional enhancement of detectability. Thus, neuronal masking release at the level of the starling's auditory forebrain appears to result mainly from masker–signal interactions within frequency analysis channels rather than the effects of interactions across different frequency channels.
Functional organization of avian auditory forebrain: interpretation of multiunit recordings
Cells of the thalamo-recipient input layer L2a of the avian auditory forebrain (e.g. see Wild et al., 1993) consist of a large number of small, densely packed somata with average diameters in the range of 5–7 µm (Saini & Leppelsack, 1981; Hose et al., 1987) preventing the isolation of single units in the current study with freely moving animals. Multiunit recordings bear the risk of mixing responses of cells with different physiological attributes. Evaluation of the functional organization of field L2a, however, suggests that response properties of adjacent neurons are quite similar. Spectral response characteristics are arranged in an orderly manner. Field L2a contains a prominent tonotopic organization of CFs with a dorsoventral gradient (e.g. Bonke et al., 1979; Heil & Scheich, 1985; Rübsamen & Dörrscheidt, 1986). Additionally, best rates for frequency-modulated stimuli have been described to be represented topographically in the field L complex (Heil et al., 1992). Temporal response characteristics of neurons are also clustered in the field L complex. Envelope frequencies of AM signals have been found to be represented topographically (orthogonal to the frequency map) in field L of the mynah bird, a member of the starling family (Hose et al., 1987; Scheich, 1990). In summary, all these studies suggest strong similarities of both temporal and spectral response characteristics of adjacent neurons in the input layer L2a of the avian auditory forebrain that combine into a multiunit cluster. Tuning properties of small cell clusters might be slightly broader than single units, but not different qualitatively.
Recording in a freely moving and awake bird has the clear benefits of exclusion of possible effects of anaesthesia which are important in this area of the starling's forebrain (Capsius & Leppelsack, 1996). Often, responses in the auditory forebrain of awake animals are more intense and sustained than those in anaesthetized animals (Brugge et al., 1969; Clarey et al., 1992; Capsius & Leppelsack, 1996). Furthermore, anaesthetics may reduce inhibitory effects already at the level of the cochlear nucleus (Evans & Nelson, 1973). Thus, responses to temporally structured sounds will be most likely modified by narcotics (see also discussion in Schreiner & Urbas, 1988; Rees & Palmer, 1989; Eggermont, 1998). On the other hand, multiunit recordings via telemetry are susceptible to movement artefacts and require procedures for their rejection. The reduced stress to the animal, however, is an additional benefit of recording neuronal responses via telemetry.
Temporal-masking effects in single on-frequency noise bands
Psychophysical studies in humans (e.g. Gralla, 1991) and the European starling (Klump & Langemann, 1995; Langemann & Klump, 2001) indicate that temporal patterns of masking are a major constituent of the release from masking observed for signals presented in amplitude-modulated noises. This suggests that masking release depends critically on the auditory system's ability to encode temporal fluctuations. Neurons in the starling's forebrain modulated their firing rates with the temporal envelope of the masking noise. Such ‘envelope locking’ to the 10 Hz modulation of SAM noises was very clear-cut, as can be seen in PSTHs shown in 2, 5. The PSTH pattern mirrored the sinusoidal masker envelope. Envelope locking by neurons in the input layer L2a is probably enhanced by a prominent suppression of activity after offset of an acoustic signal (Leppelsack, 1974; Bonke et al., 1979; Nieder & Klump, 1999a). The neuronal responses during dips in noises with 100% modulation depth resemble responses at signal offset. Average impulse rate at the masker dip was 28 impulses/sec, which was well below spontaneous activity of 72 impulses/sec (Nieder & Klump, 1999a). This decrease in activity in the dips enhanced the response following the modulation. Neurons of the input layer L2 of the avian forebrain show a particularly good following response to high envelope frequencies compared with neurons of the mammalian cortex (e.g. Eggermont, 1994; Bieser & Müller-Preuss, 1996; Nelken et al., 1999). In the starling auditory forebrain, Knipschild et al. (1992) observed a consistently high synchrony of the response to amplitude modulations with modulation frequencies of up to 80 Hz. The upper frequency limit of the neurons' capability to follow envelope modulations was 320 Hz and 380 Hz in the European starling and the mynah bird (a closely related species), respectively (Hose et al., 1987; Knipschild et al., 1992). Thus, envelope locking in songbirds seems to occur at considerably higher envelope frequencies than in the mammalian primary auditory cortex. For example, best modulation frequencies of only 10–20 Hz have been reported for the primary auditory area (AI) of anaesthetized cats (Schreiner & Urbas, 1988; Eggermont, 1994; Eggermont, 1998) and 18 Hz for the awake squirrel monkey (Bieser & Müller-Preuss, 1996).
The precise envelope locking of cells in the songbird's forebrain explains why probe tones experienced very different masking when played at different positions relative to the noise envelope. At the envelope dip of a single SAM masker, spectral energy of the maskers was essentially 0. Masking effects at such a dip can thus not be explained by simultaneous masking, where masker and probe are presented at the same time. Rather, the probe tones' reduced detection thresholds of about 10 dB relative to the CF threshold (i.e. detectability of tones in silence) is most likely caused by forward-masking effects. Maskers that end several milliseconds before the probe is presented reduce discharge to the probe (e.g. Harris & Dallos, 1979; Brosch & Schreiner, 1997). In SAM noises used in the present study, the amplitude maximum of the masker that was reached 50 ms prior to maximal probe amplitude excited the recording sites substantially and very likely reduced probe-driven discharge at the dip. At probe positions outside the dip, detection thresholds were correlated strongly with background discharge evoked by the masking noise alone. Simultaneous masking effects can account for these observations (Nieder & Klump, 1999b).
Release from masking: coherent vs. incoherent maskers
Given that temporal envelope patterns affect the amount of masking, it is clear that differences in the neuronal response can be observed for coherently vs. incoherently modulated maskers exhibiting different envelope patterns. For excitatory three-component maskers (Fig. 11), there was 9 dB less masking for signals presented in the dip of the coherent masker than for signals presented in the incoherent masker (i.e. in which the signal was presented in the peak of one of the components and in the dip and half-maximum of the envelope of the other components). However, probes presented in incoherently modulated three-component SAM noise with excitatory flanking bands were masked 13 dB less than probe tones played at the peak of a masker composed of a single on-frequency band (Fig. 11). This difference could be explained by the fact that the incoherent SAM noise with phase-shifted components caused a more steady excitation similar to an ongoing masker with little amplitude fluctuations, while envelope peaks of a single on-frequency band or a masker with coherent envelopes elicited a phasic excitation. Thus, the envelope peaks of the latter types of SAM noise elicited responses that were more typical of onset responses to ramped sounds. Phasic discharges of cell clusters in L2a of the starling elicited by the ramped onset of sounds were found to be much higher than sustained firing rates at the same signal level (e.g. see fig. 3 in Nieder & Klump, 1999b). This is also reflected in the nearly two times higher firing rate of neurons during the peak of a masker composed of a single on-frequency band than an incoherent masker composed of three phase-shifted noise bands. Since the amount of masking is correlated positively to the firing rate, detection thresholds for signals in the peak of a single-band excitatory masker are expected to be higher than thresholds during an ongoing incoherent masker. The threshold difference of 13 dB for probes at the peak of an on-frequency band compared with thresholds for probes in phase-shifted excitatory three-component maskers resembles the amount of neuronal overshoot found with pure-tone maskers (overshoot describes the threshold difference between signals presented at the beginning of a gated masker vs. those presented at the end of a gated masker; Nieder & Klump, 1999b).
For three-component maskers with inhibitory flanking bands, the small difference in detection thresholds for coherently vs. incoherently modulated noise bands can be attributed to inhibition that coincided with probe presentation for phase-shifted flanking bands. Inhibitory frequencies that are presented simultaneous with a CF probe cause a reduction of the masker-driven response and, thus, decrease detection thresholds for the probe (Nieder & Klump, 1999b).
Comparing behavioural and neuronal masking release
Two approaches are commonly used in comparing neuronal and behavioural detection thresholds: either the neuronal population average is used as a predictor of the behaviour, or the behaviour is explained by the most sensitive units. Psychophysical detection thresholds are often represented by the responses of the most sensitive neurons (see review by Parker & Newsome, 1998). Behaviourally, starlings show a considerable release from masking for signals presented in dips of the masker envelope compared with those presented in peaks of the masker envelope. On average, masking was reduced by 18 dB if the frequency spread of the masker was limited to the starling's auditory filter bandwidth (Langemann & Klump, 2001). The starlings' performance exploiting single auditory filters corresponds well to the average neuronal release from masking of 21 dB that was observed in the present study for maskers stimulating only within the limits of the units' excitatory tuning curves (Fig. 11). About 60% of the clusters, however, showed a performance that exceeded the behavioural release from masking (the upper 10% of the distribution showed a release from masking of between 37 and 44 dB).
Signal detection in coherent maskers compared with detection in incoherent maskers was improved by an average 26 dB for maskers of a bandwidth that was larger that of the auditory filter centred at the test-tone frequency in the behavioural study (Langemann & Klump, 2001). Furthermore, psychophysical release from masking was on average 15 dB for maskers limited in bandwidth to one auditory filter. Comparing psychophysical release from masking within individual birds for the wide-band (five auditory-filter bandwidths) and the narrow-band (one auditory-filter bandwidth) condition showed that about 13 dB of improvement could be accounted for by comparisons across different auditory filters. The neuronal data (Fig. 11) differ in some respect from this pattern observed in behaviour. Maskers limited to the excitatory area of the tuning curve resulted in an average release from masking of 9 dB, and more than 20% of the neurons showed a release from masking that was similar or better than the behavioural performance. For this paradigm, the neurons' population response is a good predictor of the behaviour. In contrast to the results of the behavioural study, maskers extending into the units' inhibitory sidebands (which may represent interactions across different frequencies) lead to an average release from masking of only 3 dB. This is much less than across-channel effects observed in behaviour. The two most sensitive recordings (out of a total of 13), however, could account for the behavioural data. To avoid stimulation beyond the excitatory part of the tuning curve at all recording sites, we chose to use maskers of a fixed bandwidth of 100 Hz (adding up to a bandwidth of 300 Hz in the case of three adjacent masker bands) and did not use maskers of the ‘critical bandwidth’ obtained from behavioural data. However, this procedural difference between the behavioural and the neuronal studies is not likely to be important with respect to the maskers' envelope pattern and its effect on masking release.
In psychophysical studies in humans (e.g. Delahaye, 1999), a reduction of hearing threshold has been noticed for signals played at the dip of coherently modulated multicomponent tonal maskers relative to conditions where the probe is presented at the dip of a single on-frequency band. Such an effect is regarded as ‘true’ CMR, because it indicates only across-channel interactions of masker components. In contrast to the human psychophysical data, additional flanking bands that were coherently modulated with the on-frequency band did not further enhance neuronal detectability in the starling's forebrain. Neuronal detection thresholds were not different for probes presented during an amplitude dip of maskers that consisted of only a single on-frequency band, an on-frequency band plus two excitatory flanking bands, or an on-frequency band plus two inhibitory flanking bands (Fig. 11, black columns). The results on the neuronal masking release observed in the present study are consistent, however, with findings in another study using more complex amplitude-modulated broadband maskers to explore neuronal CMR in the avian auditory forebrain (G. M. Klump & A. Nieder, unpublished observations). There, a lack of true, i.e. across-channel, CMR was also evident in the average responses for low-pass filtered broadband maskers.
The results presented here agree with observations in mammalian species. Mott et al. (1990) reported that the largest release from masking resulting from amplitude modulation can be found in chinchilla auditory-nerve fibres that respond in an excitatory fashion to the masker, whereas little release from masking can be found for fibres in which the masker reduces the response. Similar to the results of the present study, the average masking release of auditory nerve fibres excited by the masker was lower than that observed in a psychophysical study in humans using the same stimuli (Mott & Feth, 1986). Since the neurophysiological and the psychophysical studies involved different species, such discrepancies are difficult to interpret. Preliminary data on neuronal CMR have also been reported for neurons of the inferior colliculus of anaesthetized chinchilla (Henderson et al., 1999) and cells in the ventral cochlear nucleus of anaesthetized guinea pigs (Winter et al., 2000). Similar to results presented in the present study, Winter and colleagues observed a large variation in the amount of masking release between different neurons. According to their report, more than half of the units did not show a release from masking. Masking release was evident mainly in certain types of neurons (e.g. primary-like neurons in the anterior ventral cochlear nucleus). Compared with these studies in the brain stem, a considerably larger fraction of the forebrain neurons in the starling showed a release from masking. A study in the auditory forebrain (primary auditory cortex) of anaesthetized cats also observed threshold differences for signals presented in maskers with unmodulated or modulated envelopes (Nelken et al., 1999) qualitatively resembling patterns of CMR observed in human psychophysical experiments. Additional quantitative studies comparing behavioural and physiological performance in the same species are needed, however, before we can fully understand the mechanisms enhancing signal detection in the natural acoustic environment.
Acknowledgements
The study was supported by grants to G. M. K. from the Deutsche Forschungsgemeinschaft within the SFB 204 ‘Gehör’ and the FG 306 ‘Hörobjekte’. G. A. Manley and U. Langemann kindly provided comments on a previous version of the manuscript.
Abbreviations
-
- CF
-
- characteristic frequency
-
- CMR
-
- comodulation masking release
-
- FTC
-
- frequency-tuning curve
-
- PSTH
-
- peristimulus time histogram
-
- SAM
-
- sinusoidally amplitude modulated
-
- SPL
-
- sound pressure level.


