Cold-Induced Adaptive Thermogenesis in Lean and Obese
Abstract
On entering a cold environment, people react by increasing insulation and energy expenditure (EE). However, large interindividual differences exist in the relative contribution of each mechanism. Short-term studies revealed that obese subjects increase EE (i.e., adaptive thermogenesis) less than lean subjects, which might have implications for the predisposition to obesity. In this study, we validate the differences in adaptive thermogenesis between lean and obese upon midterm mild cold exposure. Therefore, 10 lean and 10 obese subjects were exposed for 48 h to mild cold (16 °C) in a respiration chamber. The preceding 36 h they stayed in the same chamber at a neutral temperature (22 °C) for the baseline measurements. EE, physical activity, skin temperature, and core temperature have been measured for the last 24 h of both parts. Mean daytime EE increased significantly in the lean subjects (P < 0.01), but not in the obese. Physical activity decreased significantly in the lean (P < 0.01) and the obese (P < 0.001) subjects. The change in EE was related to the change in physical activity in both groups (respectively R2 = 0.673, P < 0.01 and R2 = 0.454, P < 0.05). Upon mild cold exposure, lean subjects decreased proximal skin temperature less, but distal skin temperature more than obese. In conclusion, the interindividual differences in cold-induced thermogenesis were related to changes in physical activity in both lean and obese, pointing at the existence of individual variation in physical activity to compensate for cold-induced thermogenesis. Furthermore, although a large part of the lean subjects counteracted the cold by increasing EE, most obese subjects changed temperature distribution, and therefore, increased insulation.
Introduction
Entering a cold environment, humans are able to adapt by behavioral changes such as wearing a coat or by physiologic processes as increasing insulation (decreasing skin temperature), increasing energy expenditure (EE), or decreasing core body temperature (hypothermia). Even in our westernized society, in daily life mild cold is often encountered in wintertime. Under these conditions, the thermal balance is maintained (1); the interplay between insulation and increased metabolism will constitute the physiological reaction to the cold exposure. Large differences between people exist; some will mainly increase insulation, others mainly increase EE (2). In obesity research especially the large interindividual differences in increases in EE and energy efficiency in general are of importance, since small differences in EE might lead to large long-term changes in body fatness (3). The interindividual variability in the so-called adaptive thermogenesis in whole day mild cold exposure tests has repeatedly been shown to be within the same range of 0–14% increase in EE (2,4,5). In shorter term interventions (hours), interindividual differences are even larger, with ranges of −4 to +30% (6). This effect is subject-specific throughout the seasons. Claessens-van Ooijen et al. (7) showed upon 1 h of mild cold exposure a significant difference in the metabolic reaction between lean and overweight subjects. Although mean EE increased by 19% in the lean subjects, it increased only by 6.3% in the overweight subjects. The mechanism of the increased thermogenesis and its interindividual differences, are not known yet, although increased mitochondrial uncoupling in brown adipose tissue (8) and muscle tissue (9) or increased nonexercise activity thermogenesis (10) are the most likely heat producing candidates. Furthermore, cold strain in obese subjects is likely to be less due to the insulative fat layer.
In this study, we validate the differences between lean and obese upon midterm mild cold exposure (days), which is a more realistic timeframe for compensational mechanisms to occur. Thermogenesis is measured during 48 h of mild cold exposure in a respiration chamber in lean and obese male subjects. Furthermore, the influence of temperature distribution is explored.
Methods and Procedures
Subjects
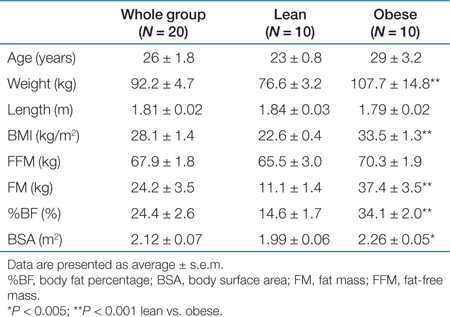
Two groups of 10 healthy, male subjects have been recruited to participate in this study: a lean group with a mean BMI of 22.6 kg/m2 (range 20.8–24.8 kg/m2) and an obese group with a mean BMI of 33.5 kg/m2 (range 28.6–40.8 kg/m2). Subject characteristics are shown in Table 1. All subjects signed an informed consent for the study protocol, which was approved by the institutional review board of Maastricht University Medical Centre.
 |
Experimental protocol
Subjects stayed in a respiration chamber (11) for 84 h, starting at 2000 h. The first 36 h chamber temperature was 22 °C (baseline); the following 48 h chamber temperature was set to 16 °C (mild cold exposure). During the first night the subjects accustomed to the chamber. The following 24 h the measurements for the baseline condition took place. The data of the last 24 h (day 2 in the cold) were used to analyze the mild cold condition. Clothing was standardized (0.8 clo): subjects received a standard set consisting of a pair of socks (0.02 clo), a shirt (0.09 clo), sweatpants (0.28 clo) and a sweater (0.37 clo). Subjects wore their own underwear (about 0.04 clo), but were instructed to wear similar underwear during the complete stay. They were instructed to wear all the clothes at all times, except during the night. At night, subjects slept under a duvet (7.0 clo).
A standard daily activity protocol was applied (12), which described all activities required by the subjects. Subjects were fed in energy balance. Energy balance was based on individually measured and calculated energy requirements. After measurement of sleeping metabolic rate (SMR) during the first night in the respiration chamber, an estimated total daily EE (TDEE) was calculated by multiplying SMR with a physical activity index of 1.55 (13). Macronutrient composition of all meals was 47, 38, and 15% energy from carbohydrate, fat, and protein, respectively. The temperature of the mild cold situation (16 °C) has been validated earlier with similar clothing to be slightly above the shivering threshold (6). No shivering occurred in that previous study (6), as was verified with electromyography. Nevertheless, in the present study, each participant had to fill out an hourly questionnaire about whether shivering occurred.
Whole day (24 h) measurements (EE, activity, temperatures) were averaged from 0630 to 0630 h. Because subjects were able to create their own micro-climate under the duvet at night, also daytime measurements were calculated, as an average over time from 0800 h to 0000 h.
Respiration chamber measurements
The respiration chamber is a 14 m3 room, furnished with a bed, chair, television, radio, telephone, computer, washbowl, and deep-freeze toilet. Air locks provide passage for exchange of food and urine. EE was determined from the subjects' O2 consumption, CO2 production, and urine nitrogen excretion according to the Weir equation (14). The respiration chamber was ventilated with fresh air at a rate of 70–80 l/min. A dry gas meter (G4; Schlumberger, Dordrecht, the Netherlands) measured the ventilation rate. A paramagnetic O2 analyzer (OA 184A; Servomex, Crowborough, UK) and an infrared CO2 analyzer (Uras 3G; Hartmann & Braun, Frankfurt am Main, Germany) were used to analyze the samples of the in- and outgoing air. Ingoing air was analyzed once every 15 min and outgoing air every 5 min. Relative humidity was kept between 53 and 55%. Physical activity was monitored by means of a radar system, based on the Doppler principle. Twenty-four-hour urine samples were collected in containers with HCl to acidify the urine and to prevent nitrogen loss by evaporation. Total daily nitrogen excretion was calculated with 24-h urine nitrogen concentration, which was measured with a nitrogen analyzer (CHN-O-Rapid; Heraeus, Hanau, Germany).
SMR is defined to be the lowest EE at night (measured over three consecutive hours). For comparative purposes, TDEE, daytime EE, and SMR have been corrected for fat-free mass (FFM) and fat mass (FM) through linear regression, because a large part of interindividual differences in EE can be explained by these variables. The residuals of the regression between EE and FFM and FM have been added to the average EE.
Temperature measurements
Skin temperatures were measured continuously during the experiment by means of iButtons (type DS1921H; Maxim/Dallas Semiconductor, Dallas, TX), which have recently been validated for studies in humans (15). iButtons were attached to the skin using fixomull tape (BSN, Hamburg, Germany) at the 14 sites prescribed by ISO-standard 9886:2004 (Ergonomics—Evaluation of thermal strain by physiological measurements, International Standards Organization, Geneva, Switzerland). Furthermore, iButtons have been attached to the forearm and the fingertip to calculate the forearm–fingertip gradient, which is a measure for skin vasoconstriction (16). Mean skin temperature is defined as the average temperature of the 14 ISO-sites. Proximal skin temperature is defined as the average of skin temperatures from abdomen, chest, scapula, and lower back. Distal skin temperature is defined as the average of skin temperatures from hand and foot. Core temperatures were measured over 24 h using a telemetric pill (CorTemp; HQinc, Palmetto, FL) that measures temperature in the intestine and transmits data to a mobile receiver. The silicon-coated pill was ingested with breakfast.
Plasma and urine tests
Blood samples in the fasted state were taken to assess glucose, insulin, free fatty acids, active ghrelin, leptin, and adiponectin concentrations. Blood was taken in EDTA-containing tubes to prevent clotting. Plasma was obtained by centrifugation, frozen in liquid nitrogen, and stored at −80 °C until further analysis. Before centrifugation, phenylmethylsolfonyl fluoride was added to the active ghrelin samples. Plasma insulin, leptin, active ghrelin, and adiponectin levels were determined using radioimmunoassays (Linco Research, St Charles, MO). Plasma glucose and FFA were analyzed with the Cobas Fara semiautomatic analyzer (Roche Diagnostica, Basel, Switzerland). The homeostasis model assessment of insulin resistance index for insulin resistance was calculated from glucose and insulin concentrations as described by Matthews et al. (17). Catecholamines from urine collected over 24 h were assessed by HPLC according to the method of Alberts et al. (18).
Body composition
Whole-body density was determined in the fasted state (nil by mouth, except water, 10 h preceding measurements) by hydro-densitometry with simultaneous assessment of the lung volume using the helium dilution technique. Body weight was measured using a digital balance with an accuracy of 0.001 kg (ID1 plus; Mettler Toledo, Tiel, the Netherlands). Under water, body weight was measured using a digital balance with an accuracy of 0.01 kg (E1200; Sauter, Ebingen, Germany). Lung volume was measured by use of a spirometer (Volugraph 2000; Mijnhardt, Bunnik, the Netherlands). Percent body fat was calculated using the equation of Siri (19).
Statistics
Statistical analyzes were done using SPSS 16.0 for Mac OS X. Data were reported as mean ± s.e.m. Extremes have been identified using box-plot data exploration, and have been excluded from analyses. Comparisons between groups were made using unpaired Student's t-tests. Comparisons between baseline and mild cold exposure were made using paired Student's t-tests. Correlation tests have been performed using Pearson correlation. The correction of EE values for FM and FFM has been performed using multiple regression. A P value <0.05 was considered as statistically significant.
Results
Energy expenditure
EE was significantly higher in the obese subjects than in the lean subjects, both in the baseline condition (respectively 12.92 and 11.35 MJ/day, P < 0.01) and after mild cold exposure (respectively 12.97 and 11.60 MJ/day, P < 0.01). EE is highly affected by the FFM on the one hand as the metabolic active tissue, and the other hand by the FM as the less metabolic active tissue. EE in the baseline condition correlated significantly to FFM and FM for all subjects (R2 = 0.76, P = 0.001 for FFM, P = 0.006 for FM). When corrected for FM and FFM (see “Respiration chamber measurements” in the Methods section), no differences in EE between lean and obese were present in both the baseline and mild cold condition (obese vs. lean, respectively, 12.24 and 12.30 MJ/day baseline, 12.39 and 12.46 MJ/day mild cold, P > 0.8). Similar corrections with comparable results for FM and FFM have been performed for SMR (R2 = 0.72, P = 0.003 for FFM, P = 0.007 for FM) and daytime EE (daytime EE) (R2 = 0.74, P = 0.001 for FFM, P = 0.007 for FM).
Because baseline respiration chamber measurements of one subject were detected as extremes using box-plot data exploration (with extremes defined as more than three times the interquartile range from the first or third quartile), the measurements of this subject have not been taken into account in this article.
Upon cold exposure, mean TDEE increased significantly (0.25 MJ/day, P < 0.05) in the lean subjects, whereas in the obese mean TDEE did not increase significantly (Table 2). Mean daytime EE increased significantly both on whole group level (0.30 MJ/day, P < 0.05) and in the lean subjects (0.44 MJ/day, P < 0.01), whereas the obese remained at the same level (Table 2). Mean SMR did not increase upon cold exposure in both groups. Because subjects at night slept under a duvet, they were able to create their own micro-climate. Therefore, daytime EE is a better measure for mild cold exposure. Emphasis will be placed on daytime EE, and other daytime measurements in the rest of this article. Throughout the study, no shivering has been reported at all.
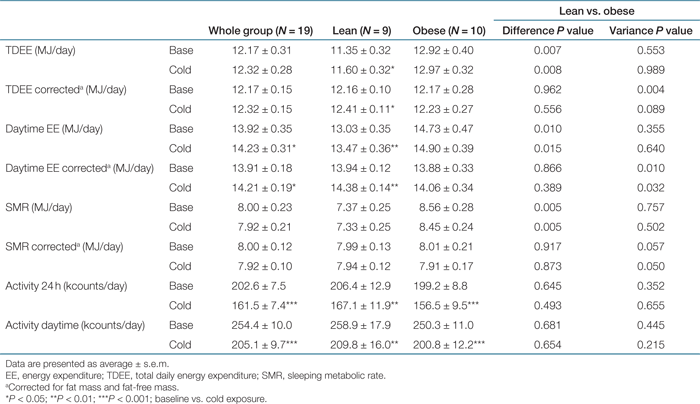 |
The variance in daytime EE was significantly larger in the obese (P < 0.05), in the baseline condition and after mild cold exposure. Also the variance in the change in daytime EE, which is the measure for adaptive thermogenesis, was significantly larger (P < 0.05) in the obese.
Activity by radar count decreased significantly after mild cold exposure on a whole group level (P < 0.001), in the lean subjects (P < 0.01), and in the obese subjects (P < 0.001). This effect was similar in the 24-h measurement and during daytime (Table 2). The change in daytime EE between baseline and cold exposure was significantly related to the change in daytime activity counts (whole group: R2 = 0.385, P < 0.005; lean: R2 = 0.673, P < 0.01; obese: R2 = 0.454, P < 0.05, see 1). On whole group level, negative correlations existed between the change in daytime EE and BMI (R2 = 0.306, P < 0.05) and body mass (R2 = 0.220, P < 0.05). In the obese group Δ daytime EE also correlated to BMI (R2 = 0.610, P < 0.01), see 1. Together, BMI and the change in physical activity counts correlated with Δ daytime EE on whole group level, resulting in an R2 of 0.565 (P < 0.002).
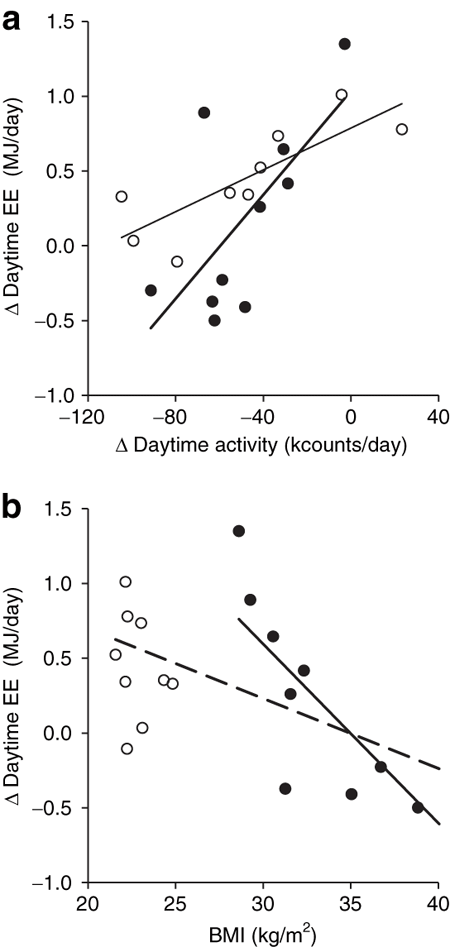
(a) The relationship between change in daytime energy expenditure (EE) and change in daytime activity counts. Open symbols and thin regression line represent the lean subjects (R2 = 0.673, P = 0.007). Closed symbols and thick regression line represent the obese subjects (R2 = 0.454, P = 0.033). (b) The relation between change in daytime EE and BMI. Open symbols represent the lean subjects. Closed symbols and thick regression line represent the obese subjects (R2 = 0.610, P = 0.008). The dashed regression line is for the whole group (R2 = 0.306, P = 0.014).
Body temperature
In the baseline condition, obese subjects had a significantly lower mean skin temperature (0.51 °C, P < 0.05), proximal skin temperature (1.22 °C, P < 0.001), gradient proximal–distal skin temperature (2.25 °C, P < 0.001), and gradient forearm–fingertip temperature (1.14 °C, P < 0.001) compared to the lean subjects. The gradient core–mean skin temperature was significantly larger in the obese (0.59 °C, P < 0.05).
Upon mild cold exposure, the differences between lean and obese remained, like the lower proximal skin temperature in the obese. Additionally, in the cold, core temperature (0.35 °C, P < 0.05) and distal skin temperature (2.24 °C, P < 0.005) were significantly higher in the obese and the difference between lean and obese in the gradient core–mean skin temperature became larger and more significant (0.95 °C, P < 0.001, see Table 3).
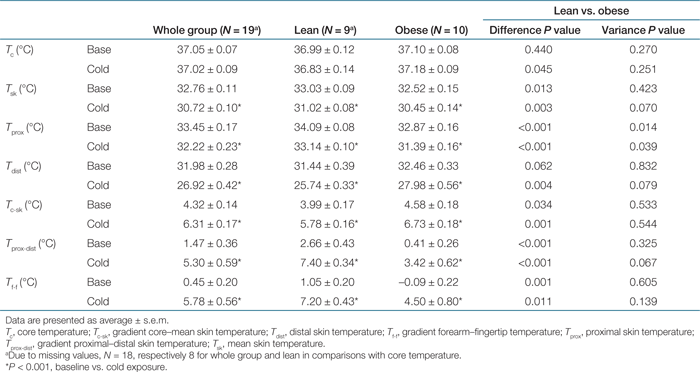 |
Skin temperatures (mean, proximal, and distal) decreased during mild cold exposure on whole group level and in lean and obese subjects (P < 0.001, see Table 3). Mean core temperature did not change significantly. Gradients between proximal and more distal parts (core temperature–mean skin temperature; proximal skin temperature–distal skin temperature; forearm–fingertip temperature) increased significantly on whole group level and in lean and obese subjects (P < 0.001, see Table 3). Furthermore, the obese subjects decreased distal skin temperature less (−1.22 °C, P < 0.05), but proximal skin temperature more (0.53 °C, P < 0.001) than lean subjects. Consequently, the gradient between proximal and distal skin temperature increased less in the obese subjects (−1.73 °C, P < 0.01).
The change in daytime EE correlated significantly to the change in mean skin temperature in the obese group only (R2 = 0.493, P < 0.05, see 2). In the whole group, during cold exposure, mean skin temperature correlated negatively to %BF (R2 = 0.447, P < 0.005) and distal skin temperature correlated positively to %BF (R2 = 0.266, P < 0.05, see 2). In both the baseline situation and upon mild cold exposure, proximal skin temperature correlated negatively to %BF (respectively R2 = 0.385, P < 0.01 and R2 = 0.583, P < 0.001, see 2) on group level. Furthermore, on group level, the change in proximal skin temperature upon mild cold exposure correlated positively to %BF (R2 = 0.546, P < 0.001, see 2).

(a) The relationship between change in daytime energy expenditure (EE) and change in mean skin temperature (Tsk) in the lean group (open symbols, no regression line) and the obese group (closed symbols, thick regression line, R2 = 0.493, P = 0.024). (b) The relationship between body fat % and proximal skin temperature (diamonds, dotted regression line, R2 = 0.583, P < 0.001) and distal skin temperature (round symbols, dashed regression line, R2 = 0.266, P = 0.028), during mild cold exposure. Open symbols depict lean subjects, closed symbols depict obese subjects. (c) The relationship between body fat % and change in proximal skin temperature (dashed regression line, R2 = 0.546, P < 0.001). Open symbols depict lean subjects, closed symbols depict obese subjects.
Plasma and urine tests
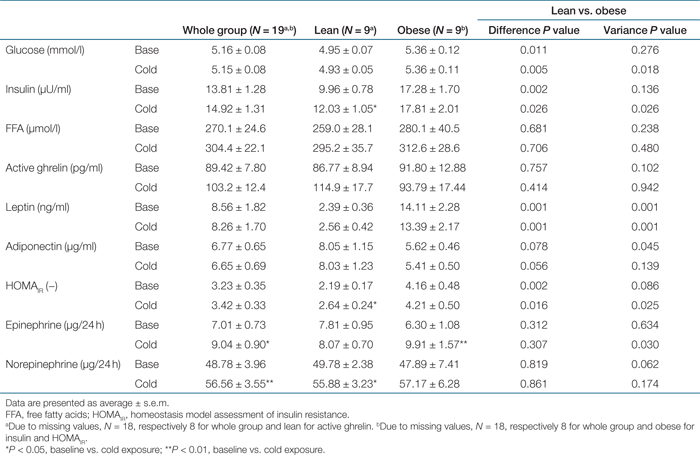
Obese subjects showed at baseline and mild cold exposure higher levels for plasma glucose (respectively P < 0.05 and P < 0.005), homeostasis model assessment of insulin resistance (P < 0.005 and P < 0.05), insulin (P < 0.005 and P < 0.05), and leptin (both P < 0.001) (see Table 4). Upon cold exposure, the concentration of 24-h urine epinephrine increased on whole group level (P < 0.05) and in the obese subjects (P < 0.01) (see Table 4). The increase in 24-h urine epinephrine concentration upon mild cold exposure was significantly larger in the obese subjects than in the lean (P < 0.05). The 24-h urine norepinephrine concentration increased significantly on whole group level (P < 0.01) and in the lean subjects (P < 0.05) (see Table 4). In the obese subjects, plasma adiponectin concentration correlated positively to the change in daytime EE, both in baseline (R2 = 0.446, P < 0.05) and upon mild cold exposure (R2 = 0.514, P < 0.05), see 3.
 |
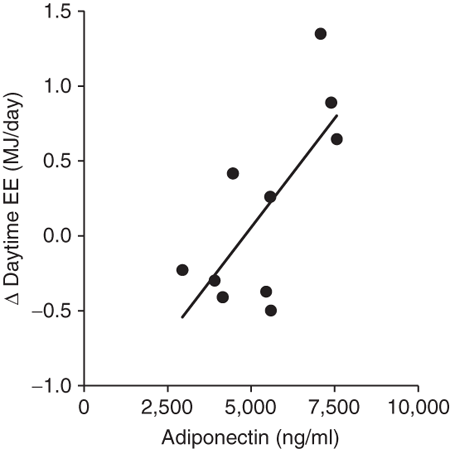
The relationship between change in daytime energy expenditure (EE) and adiponectin concentration in baseline (R2 = 0.446, P = 0.028) in the obese group.
Discussion
EE in the cold increased significantly in the lean subjects, but did not in the obese subjects. In both groups, interindividual differences in EE changes were large. Furthermore, they correlated well to the interindividual differences in physical activity changes. Lean subjects had a larger decrease in distal skin temperatures than the obese, whereas obese subjects decreased proximal skin temperatures more prominently than the lean.
Upon cold exposure, mean daytime EE increased significantly in the lean subjects (P < 0.01, 0.44 MJ/day, range −0.11 to 1.01 MJ/day). This is in line with earlier studies on midterm cold exposure (2,4,5). The increase is smaller than in the other studies, probably because mild cold exposure was shorter (2 days instead of 3 days). The increase is also smaller compared to short-term cold exposure (6). However, in that study the ability for behavioral changes was smaller.
Interestingly, in the obese, no significant increase in thermogenesis was observed (P > 0.40, range −0.50 to 1.35 MJ/day). On group level there was no significant difference in mild cold-induced thermogenesis between lean and obese. However, the lack of increase in the obese contrary to the lean subjects points toward a difference in cold response. The observed larger variance in mild cold-induced thermogenesis in the obese implicates a higher inhomogeneity in the obese group than in the lean. One of the contributing factors might be the larger range in BMI in the obese subjects relative to the lean subjects. The significant negative relation between the change in EE and BMI in the obese subjects is in line with the observed trend between the groups. As can be seen from 1, the obese subjects at the lower BMI range (28.6–32.3 kg/m2) might belong to a different subpopulation more similar to the lean subjects, whereas the higher BMI obese subjects show less adaptive thermogenesis. This implicates that the regularly attributed BMI cutoff values to distinguish lean from obese subjects do not apply if thermoregulatory aspects are involved. The difference in the thickness of the subcutaneous fat layer might be responsible for this difference.
During baseline measurements, obese subjects had lower mean and proximal skin temperatures than lean subjects, wheras the distal temperature tended to be higher and the gradient between core temperature and mean skin temperature was significantly larger. This points toward a better insulation of the core of the body of the obese subjects, as has been shown before (7,20). On the other hand, the gradients between proximal and distal skin temperature and forearm and fingertip skin temperature are lower in the obese, showing less peripheral vasoconstriction or active vasodilation (20).
During mild cold exposure, the differences between the lean and the obese subjects became even more apparent. In general, skin temperatures decreased in all subjects. Although the proximal skin temperature stayed lower in obese than in lean, the distal skin temperatures were significantly higher in the obese. This indicates that in the obese even in the mild cold situation relatively much heat needs to be lost by the extremities. The increases in the proximal–distal and forearm–fingertip skin temperature gradients implicate an increased peripheral vasoconstriction (16), which is to be expected in the cold, although the level is lower in the obese subjects.
Furthermore, differences between the lean and obese have been verified by the correlations between the body fat percentage and the measured skin temperatures. From this, we conclude that in the obese subjects the core was better insulated proximally, due to the insulative properties from the body fat (21,22). Because heat loss is prevented in obese subjects, no increase in EE is needed in response to mild cold exposure. A relatively high peripheral subcutaneous blood flow, as shown by the higher distal skin temperature, is even necessary to maintain thermal balance.
Physical activity, measured via an ultrasound Doppler system, decreased significantly in both the lean and obese groups, which suggests that activity is not responsible for the cold-induced increase in EE in the lean subjects. A possible explanation for the decrease in EE is monotony, despite the standard daily protocol, due to the relatively long stay in the respiration chamber.
However, there is a positive relationship between the difference in activity and the difference in daytime EE. This means that those subjects with minimal or no decrease in physical activity had the largest increase in EE. In the obese group, this difference in activity could explain 45% of the interindividual differences in the change in EE, in the lean subjects even 67%. Together, BMI and the change in physical activity could explain 57% of the interindividual differences in the change in EE on whole group level.
This implicates a role of nonexercise activity thermogenesis, a concept introduced by Levine et al. (10) in their research involving diet-induced adaptive thermogenesis. Although it has been shown before that physical activity did not change upon short-term mild cold exposure in subjects that were instructed to watch videos and kept seated (23), it is possible that the longer exposure to mild cold and the extra freedom of movement in the respiration chamber introduced more changes in activity. In the present study, another mechanism is likely to explain the group wise increase in EE, but differences in nonexercise activity thermogenesis might compensate for the decrease in physical activity during the respiration chamber stay. This might evoke the interindividual differences in EE.
The remainder of the interindividual differences will be caused by other properties of the body (e.g., subcutaneous fat layer) or mechanisms (e.g., mitochondrial uncoupling in brown adipose tissue or muscle tissue). More mechanistic research is needed to address these factors and explain a larger part of the differences in adaptive thermogenesis between people.
The increased levels of glucose, insulin, and leptin in the obese subjects and the increased insulin resistance index, are a characteristic of their phenotype (24,25). On the other hand, 24-h urine norepinephrine did increase in the lean group and on whole group level, whereas it did not in the obese subjects. This might be explained by the smaller effect of the cold exposure on the obese subjects. Adiponectin level correlated significantly to the change in the daytime EE in the obese subjects, as well in the baseline situation, as during mild cold exposure. Because adiponectin is negatively correlated to BMI (26), this relation can be explained by the differences in BMI between subjects.
Keith et al. (27) published an interesting review relating putative mechanisms to the increase in obesity in the recent decades. One of the factors discussed is the reduction in the variability in ambient temperatures people experience in daily life. Our results verify that lean subjects, being outside the thermoneutral range, in this case below, can increase EE. If all other energy converting mechanisms in the body keep going at the same pace, this might protect people from growing obese. Furthermore, if a higher FM is already acquired, increased cold exposure might not have an effect anymore. Therefore, mild cold exposure can be a measure to prevent increases in body weight, but not to treat obesity.
In conclusion, this study on midterm mild cold exposure shows that lean subjects increased EE significantly, whereas obese did not. However, in both groups interindividual differences were large. For a large part, these interindividual differences could be explained by interindividual differences in cold-induced reduction of physical activity. Furthermore, although a large part of the lean subjects counteracted the cold by increasing EE, the obese subjects showed on average a better proximal skin insulation. These results may have consequences for long-term energy balance and weight control that should be considered for lifestyle interventions and indoor climate control.
Acknowledgments
We thank Paul Schoffelen and Loek Wouters for their assistance with the respiration chamber measurements, and Jos Stegen and Wendy Sluijsmans for the laboratory tests.
Disclosure
The authors declared no conflict of interest.


