Effects of Adiposity and 30 Days of Caloric Restriction Upon Protein Metabolism in Moderately vs. Severely Obese Women
Abstract
Protein metabolism adapts during caloric restriction (CR) to minimize protein loss, and it is unclear whether greater fat stores favorably affect this response. We sought to determine whether protein metabolism is related to degree of obesity and whether the response to CR is impacted by pre-CR adiposity level. Whole body protein metabolism was studied in 12 obese women over a wide range of BMI (30–53 kg/m2) as inpatients using [1-13C]leucine as a tracer following 5 days of a weight-maintaining diet and then after 30 days of CR (1,400 kcal deficit with maintained protein intake). When expressed as total rates, per body weight (BW) or per fat-free mass (FFM), leucine rate of appearance (Ra), and nonoxidative leucine disposal (NOLD) were significantly higher in the individuals with a greater degree of obesity (P < 0.05). Leucine oxidation (Rox) was also higher in more highly obese women when expressed as a total rate (P < 0.05) but not if expressed per BW or FFM. CR reduced BW, FFM, and fat mass (P < 0.001), and declines were relatively similar between individuals. CR reduced Ra (P < 0.001), NOLD (P < 0.01), and Rox (P < 0.05), and the relative decline was not affected by differences in fat mass. CR-induced declines were significant even when Ra and NOLD were normalized to BW or FFM. We conclude that fat mass, like FFM, is a key determinant of protein turnover. However, during CR, higher fat mass does not favorably alter the response of protein metabolism and does not mitigate the loss of FFM.
Introduction
Protein turnover can be reasoned to have a physiological benefit as it promotes the remodeling process, and protein synthesis may promote retention of body proteins during stress. To improve knowledge of the regulation of amino acid partitioning between tissue remodeling and loss by oxidation, studying effects of adiposity and energy balance on protein metabolism should be helpful. In weight loss programs for obese individuals, it is of substantial interest to develop strategies to promote loss of fat but retention of lean tissue. Furthermore, it can be reasoned that the response of amino acid kinetics to caloric restriction (CR) may be the primary determinant of the changes in fat-free mass (FFM).
Protein turnover is closely related to the amount of FFM, but also fat mass could play some additional role (1), though the relationship between fat mass and protein turnover is not fully understood. Some reports (2,3,4,5), but not all (6,7,8,9), showed elevation of whole body protein turnover per FFM in obese individuals. Complete fasting in obese individuals is known to alter whole body amino acid kinetics (10,11), but it has been unclear whether there is an effect of CR that is only a partial restriction of dietary intake. Four months of mild CR and lifestyle advising in obese women led to a reduction in whole body leucine rate of appearance (Ra) (12). In agreement with these findings and extending them to include situations even where energy balance is restored to neutral levels after weight loss, with gastric banding in severely obese (SO) men and women, after massive weight loss, total leucine Ra, nonoxidative leucine disposal (NOLD), and rate of oxidation (Rox) were reduced, but the rates were not significantly reduced per FFM (13). Furthermore, in another study, 4 months of moderate CR led to no change in leucine Ra, NOLD, or Rox per FFM (14). In a study in which obese women undertook CR until achievement of ideal body weight (BW), total leucine Ra, NOLD, and Rox were reduced and were even reduced when expressed per FFM (3). Considering the literature as a whole, it seemed clear that CR would reduce total protein turnover but not as clear whether this would be independent of FFM changes. Furthermore, it is unknown whether there is heterogeneity within obesity in which amino acid kinetics in individuals with different levels of adiposity would respond differently to CR. Therefore, we tested the response of protein turnover to a fixed level of CR in two groups of obese individuals (moderately obese (MO) women; SO women) that spanned a broad range of adiposity. As protein intake per se can affect amino metabolism (15,16), we maintained constant protein intake, yet reduced energy intake by 1,400 kcal/d below that required for weight maintenance.
In designing a CR program, one must decide whether to reduce energy intake by a relative proportion or by a fixed amount of energy. It is possible that reducing by a percentage of intake would lead to a relatively similar level of stress upon people of different body sizes and habitual energy intakes, but there would be wide variability in the absolute amount of negative energy balance. Alternatively, we chose to reduce intake by the same absolute amount of energy in all individuals and were cognizant of the fact that this might generate a relatively greater stress on energy balance in the women with lower habitual energy intakes such as the women with a lesser degree of obesity. However, in all participants, this approach would be consistently less severe than application of a traditional very-low-calorie diet (17,18). For the purposes of studying CR in individuals for whom weight loss is advised, we studied women who were slightly above the obesity threshold (MO) and women who were SO. Indeed, class 1 obese individuals (BMI 30–35) do have significantly lower disease risk compared with individuals of greater levels of obesity (19), and therefore, though we studied a broad range of BMI, MO and SO can be seen as distinct groups. We sought to determine whether CR-related changes in FFM and protein metabolism are related to the level of adiposity, and specifically, whether SO would be protected from loss of FFM and reduction in protein turnover as expressed as absolute kinetic rates and when expressed per FFM. We hypothesized that SO would exhibit higher total rates of protein turnover than MO and also higher rates when normalized to FFM, and that 30 days of a 1,400 kcal energy deficit would reduce protein turnover and FFM in both SO and MO, but to a lesser extent in SO.
Methods and Procedures
Study participants
Following approval by the University of Vermont Institutional Review Board and receipt of written informed consent, six MO women with a BMI <35 (range 30–32), and six SO women with a BMI >35 (range 36–53) participated in the study. Previous work from our laboratory has demonstrated that with these sample sizes, statistically significant and physiologically relevant group differences can typically be assessed (10,20,21). Participants were between the ages of 21 and 59 years. Study participants were disease-free as determined by physical examination and health history questionnaire, and were not taking medications known to affect metabolism. We excluded individuals with predominantly lower body obesity (obese based upon BMI but waist circumference <88 cm).
Experimental design
Utilizing stable isotope tracer methodology, whole body amino acid kinetics were measured on two occasions, once at baseline and then after 30 days of consuming a diet of reduced energy content (CR). Participants resided in the General Clinical Research Center as inpatients for the entire duration of the study. Dietitians administered weighed meals and confirmed compliance with the prescribed diets. Habitual prestudy dietary composition was not assessed, but rather a weight-maintaining diet for the 5 days prior to the first tracer infusion trial was individualized for each study participant, and macronutrient composition was made similar between individuals for carbohydrate (55%), lipid (35%), and protein (10%) (MO, 2,303 ± 71 kcal/day; SO, 2,769 ± 104 kcal/day). During the CR phase (30 days), energy intake was reduced by 1,400 kcal as a reduction of fat by 600 kcal and carbohydrate by 800 kcal, and protein intake was not changed. Before and after CR, body composition was assessed by hydrostatic weighing. On the morning of tracer infusion trials, participants were studied in the overnight-fasted, postabsorptive state. Resting energy expenditure (REE) and energy substrate partitioning were measured using open-circuit indirect calorimetry. The arm vein catheter, to be used for tracer infusion, was placed on the evening prior to tracer infusion trials and was kept patent with 0.9% saline infusion. Participants stayed overnight in the General Clinical Research Center, and on the morning of tracer infusion trials, after collection of background blood and breath samples, primed-continuous infusions of [1-13C]leucine were begun between 6 and 7 am, and continued for 3 h. Priming doses of [13C]bicarbonate (0.2 mg/kg) and [1-13C]leucine (1 mg/kg) were given immediately prior to continuous infusion of [1-13C]leucine at an infusion rate of 1 mg/kg/h.
Blood and breath sampling
On the day of tracer infusion trials, arterialized blood samples were drawn from a heated hand vein at 120, 135, 150, 165, and 180 min after starting tracer infusion, and expired breath samples were simultaneously taken at these time points during assessment of pulmonary gas exchange. Additionally, as stated above, blood and breath samples were taken immediately prior to administration of tracer priming boluses and commencement of tracer infusion to obtain background isotopic enrichments (IEs). Blood for measuring concentration of metabolites and hormones was collected immediately prior to and at 150 min of tracer infusion, and values for the two time points were averaged. Blood for insulin and insulin-like growth factor-I was collected as serum, for β-hydroxy butyrate as whole blood in 30% perchloric acid, and as plasma for α-ketoisocaproate (α-KIC) and the remaining metabolites and hormones.
Sample analyses
Amino acid concentrations were measured by high performance liquid chromatography of the ortho-phthalaldehyde derivative with fluorescence detection. Leptin was measured by a radioimmunoassay kit (Linco Research, St Charles, MO), and insulin, glucagon, and growth hormone were each also measured by radioimmunoassay kits (Diagnostic Products, Los Angeles, CA). Insulin-like growth factor-I was measured by a published radioimmunoassay method (22), and catecholamines (epinephrine and norepinephrine) were measured by a radioenzymatic assay (23). Metabolites were measured spectrophotometrically. IEs of [13C]α-KIC were measured in plasma as their trimethylsilyl quinoxalinol derivatives by gas chromatography/mass spectrometry (GC/MS) under electron impact ionization conditions as previously described (24). Selected ion abundances were compared against external standard curves for calculation of IE. α-ketovalerate was used as internal standard for measuring α-KIC concentration.
Calculations
We used a steady-state reciprocal pool model (25) in which plasma α-KIC IE is assumed to represent the whole body intracellular leucine IE. Amino acid flux rates were calculated using the average IEs from the final 45 min of tracer infusion, a time at which isotopic steady state had been achieved. We used standard equations, as reported previously (26), to calculate leucine Ra, Rox, and NOLD. A bicarbonate correction factor was used to account for retention of 13CO2. The bicarbonate correction factor (k) has been reported to be unaffected by gender (27) or adiposity (28), and is not affected by restriction of dietary intake (29), and therefore, we used the standard k value of 0.81 (ref. 28) that has been commonly used. Any error in estimation of the k value would directly impact estimated rates of leucine Rox and would also impact apparent rates of NOLD through the impacts upon Rox estimation. Calculations of leucine Ra are independent of 13CO2 measurements. REE and energy substrate partitioning were calculated from pulmonary gas exchange and timed urinary urea nitrogen excretion rates (30).
Statistical analyses
Results are presented as means with standard errors. Effects of obesity level (MO vs. SO), CR, and interactions were assessed by 2 × 2 mixed model ANOVA. Tukey's honestly significant difference post hoc test was performed when significant interactions were observed. Additionally, analysis of covariance, with baseline (pre-CR) values as covariates, was performed to compare groups for CR-induced incremental changes from baseline. Secondary analyses of results were also conducted by linear regression, and from Pearson correlation coefficients, we calculated R2 values. Analyses were performed using JMP 7.0 software (SAS, Cary, NC). Statistical significance was set at α = 0.05.
Results
Characteristics of study participants
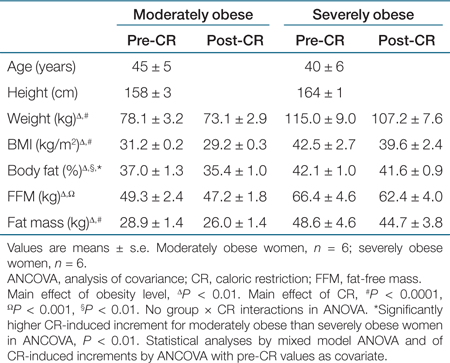
Selected characteristics of study participants are reported in Table 1. The absolute magnitude of fat loss and FFM loss was primarily related to starting adiposity level (1). As such, there was no significant difference for CR-induced fat loss between MO and SO when analyzed by analysis of covariance with pre-CR fat mass as the covariate. Similarly, there was no significant correlation between pre-CR fat mass and the percent change of each individual's fat mass (1). Though no statistically significant differences existed when analyzing relative loss of fat or FFM separately, the reduction of % body fat with CR was significantly greater for MO than SO (analysis of covariance of CR-induced increments with initial value as covariate, P < 0.01).
 |
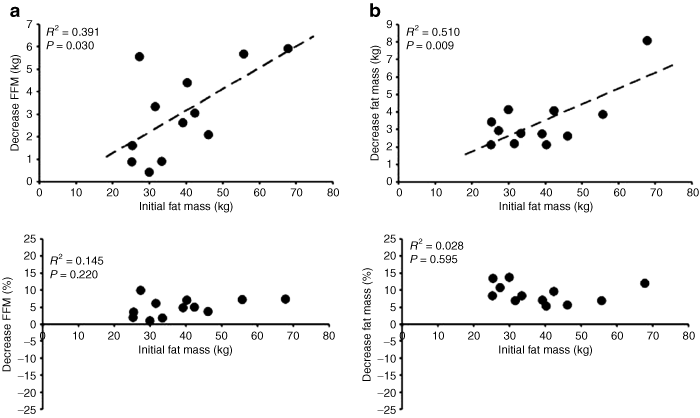
Correlations of initial fat mass (pre-CR) with CR-induced increments expressed as total change (post-CR subtracted from pre-CR) and as percent change. (a) Fat-free mass (FFM). (b) Fat mass. Positive value indicates decreased mass of tissue. Statistical analyses by linear regression. Regression line is only shown in instances of a statistically significant correlation. CR, caloric restriction.
Plasma amino acid concentrations
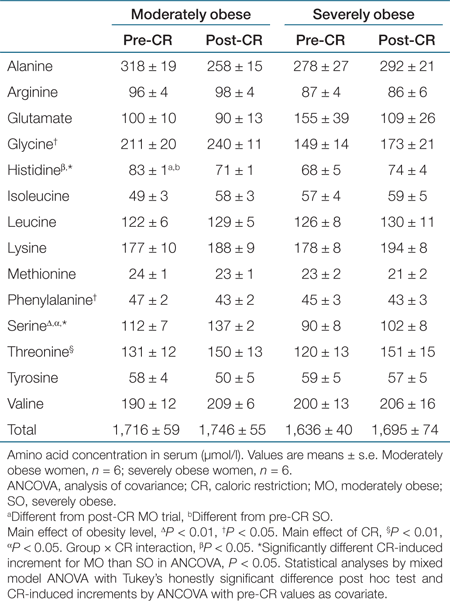
Amino acid concentrations in plasma are reported in Table 2. Additionally, we measured the concentration of the keto acid analogue of leucine, α-KIC, and there was a subtle but significant main effect of CR (P < 0.05) to raise circulating concentrations (MO from 24 ± 2 to 26 ± 1 µmol/l, and SO from 26 ± 2 to 30 ± 2 µmol/l). Of the 14 amino acids that we could resolve by the chromatographic separation, there was a significant impact of obesity level and/or CR upon glycine, histidine, phenylalanine, serine, and threonine. Despite these statistically significant effects upon concentrations of individual amino acids, neither obesity level (MO vs. SO) nor CR had any significant effect upon the total amino acid concentration or those of the branched-chain amino acids (BCAA) such as leucine.
 |
Metabolites
Glucose was not significantly different between groups/conditions, and glucose concentration values indicated that none of the participants were diabetic (MO pre-CR, 4.8 ± 0.2; MO post-CR, 4.9 ± 0.4; SO pre-CR, 4.6 ± 0.2; SO post-CR, 4.5 ± 0.2 mmol/l). β-hydroxy butyrate (MO pre-CR, 0.54 ± 0.04; MO post-CR, 0.65 ± 0.07; SO pre-CR, 0.86 ± 0.26; SO post-CR, 0.83 ± 0.18 mmol/l) and FFA (MO pre-CR, 710 ± 48; MO post-CR, 618 ± 25; SO pre-CR, 695 ± 39; SO post-CR, 640 ± 57 µmol/l) were also not different between groups/conditions.
Metabolic rate
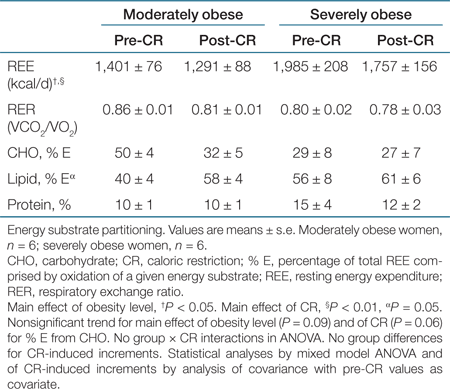
At baseline, total REE was significantly correlated with fat mass (R2 = 0.87, P < 0.0001), FFM (R2 = 0.89, P < 0.0001), but not % body fat (R2 = 0.03, P = 0.614). There was a main effect of obesity level (SO > MO, P < 0.05) and a main effect of CR (pre > post, P < 0.01) for total REE as reported in Table 3, but the differences were not statistically significant when rates were expressed per BW or FFM, indicating importance of body size.
 |
Leucine kinetics
Expressed as total rates, per FFM and per BW, leucine kinetics by obesity grouping are shown in 2. Leucine Ra (marker of proteolysis) and NOLD (marker of protein synthesis) were significantly higher in SO than MO (P < 0.01) and significantly reduced by CR (Ra, P < 0.001; NOLD, P < 0.01) (ANOVA main effects, no group × CR interaction). Like for Ra and NOLD, Rox was significantly higher in SO when expressed as a total rate, but unlike the other parameters, there was no significant effect of obesity level when data were normalized to BW or FFM. Like Ra and NOLD, Rox was reduced significantly by CR when expressed as a total rate and per FFM (P < 0.05), and it approached significance when expressed per BW (P = 0.069). Total Ra, NOLD, and Rox were significantly correlated with fat mass at baseline (3), and when expressed per BW or per FFM, this correlation was still significant for Ra and NOLD but not Rox (data not shown). Leucine kinetics were also significantly associated with REE as displayed in 3. The CR-induced decreases of Ra and NOLD were correlated with baseline fat mass (4), but not when starting values were used as a covariate (data not shown) and not when expressed as a percentage change from baseline (4). The CR-induced decline in Rox was not associated with fat mass (4) but was significantly correlated with CR-induced decline of REE (R2 = 0.48, P = 0.012).

Leucine kinetics. (a) Leucine Ra (proteolysis) as total rate, per unit body weight, and per unit fat-free mass. (b) Nonoxidative leucine disposal (protein synthesis) as total rate, per unit body weight, and per unit fat-free mass. (c) Leucine oxidation as total rate, per unit body weight, and per unit fat-free mass. Values are means ± s.e. Moderately obese women, n = 6; severely obese women, n = 6. Main effect of obesity level, ΔP < 0.01, †P < 0.05. Main effect of CR, ΩP < 0.001, §P < 0.01, αP < 0.05. No group × CR interactions in ANOVA. Statistical analyses by mixed model ANOVA and of CR-induced increments by ANCOVA with pre-CR values as covariate. No significant differences in ANCOVA analysis. Leucine oxidation per body weight: nonsignificant main effect of CR (P = 0.0691). ANCOVA, analysis of covariance; CR, caloric restriction; NOLD, nonoxidative leucine disposal; Ra, rate of appearance; Rox, rate of oxidation.
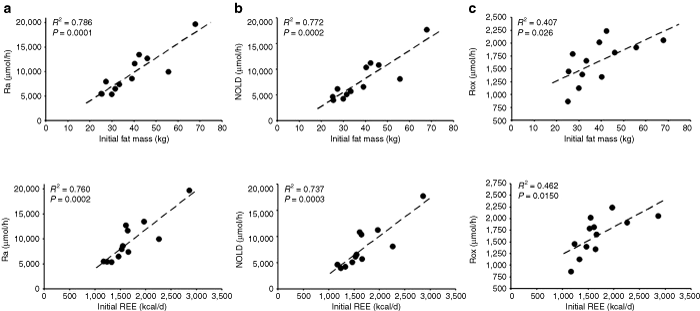
Correlations of pre-CR fat mass and pre-CR REE with pre-CR leucine kinetics. (a) Leucine Ra (proteolysis). (b) Nonoxidative leucine disposal (protein synthesis). (c) Leucine oxidation. Statistical analyses by linear regression. CR, caloric restriction; Ra, rate of appearance.
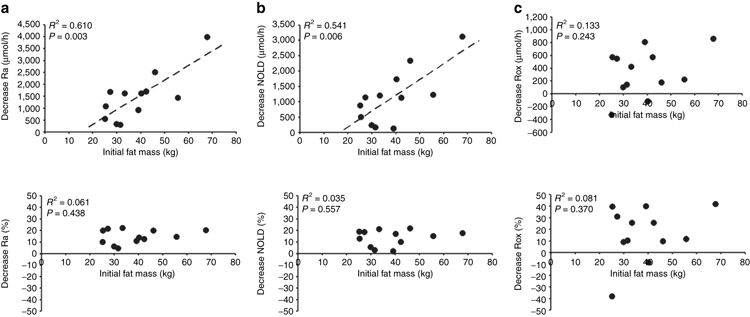
Correlations of initial fat mass (pre-CR) with CR-induced increments expressed as total change (post-CR subtracted from pre-CR) and as percent change. (a) Leucine Ra (proteolysis). (b) Nonoxidative leucine disposal (protein synthesis). (c) Leucine oxidation. Positive value indicates decreased rate of leucine kinetics. Statistical analyses by linear regression. Regression line is only shown in instances of a statistically significant correlation. CR, caloric restriction; Ra, rate of appearance.
Hormones
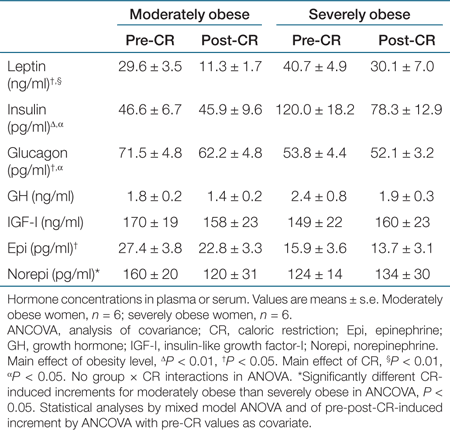
We report group differences in Table 4, and additionally here in the text, we report results from linear regression analyses. There was a strong trend for insulin to be positively correlated with total leucine Ra (R2 = 0.32, P = 0.055) and total NOLD (R2 = 0.32, P = 0.056). Glucagon was negatively correlated with total leucine Ra (R2 = 0.37, P < 0.05) and total NOLD (R2 = 0.37, P < 0.05). Epinephrine was negatively correlated with total leucine Ra (R2 = 0.41, P < 0.05) and total NOLD (R2 = 0.43, P < 0.05). Of the hormones that were significantly correlated with parameters of leucine kinetics at baseline (pre-CR), CR-induced increments in hormones were not correlated with CR-induced increments in leucine kinetic rates.
 |
Discussion
We hypothesized that protein turnover would be related to obesity level, and our results did reflect such a relationship. In fact, our present results indicate that a higher BMI and higher amounts of body fat are associated with higher rates of protein turnover even when one accounts for the higher levels of FFM that accompany higher levels of body fat. We had also hypothesized that the individuals with higher degrees of obesity would lose less FFM during identical CR and that the response of leucine kinetics could provide a mechanism for the observation. However, our results did not affirm the second hypothesis. Thus, as discussed below, SO women, though with different baseline protein metabolism than those who are only MO, are equally or perhaps even more sensitive to effects of CR upon protein metabolism.
Protein intake was unchanged during CR in our study, and so changes in FFM and body protein content would be directly related to changes in endogenous amino acid metabolism rather than supply of exogenous amino acids. Because of the impact of dietary protein intake upon leucine kinetics (15), if protein intake on the standardized baseline diets was different from participants' habitual intakes, we might have attained somewhat different values for leucine Ra and Rox in comparison to rates that would have been attained if diet was not standardized. However, the purpose of diet standardization at baseline was to factor away interindividual variation of protein intake such that effects of obesity level per se could be studied. Thus, we are confident that protein metabolism is inherently different between MO and SO. Furthermore, in this case of unchanged dietary protein intake during CR compared with the standard baseline diets, we did not observe superior protection against loss of FFM in SO vs. MO. We had originally hypothesized that SO, compared to MO, might better tolerate the CR based upon previous reports that obesity protects against loss of FFM during fasting (31) and partial restriction of energy intake (32,33). Also, another reason to have expected support for the second hypothesis was that the same absolute caloric deficit was achieved for both MO and SO, and therefore, this was a smaller relative reduction in food intake for SO in relation to their level of adiposity and estimated energy requirement. However, even despite relatively less reduction of energy intake, relative loss of FFM was similar between groups, and the most obese individuals actually lost more absolute amount of FFM. The mechanism to explain this finding is uncertain and not readily apparent from our results for leucine kinetics. However, we should acknowledge that amino acid metabolism during meal absorption would be important in addition to that which we measured in the postabsorptive state. Group differences in postprandial amino acid metabolism could possibly explain the results for loss of FFM, but unfortunately, we did not conduct tracer infusion trials in the fed state in this study.
There is some support for an effect of adiposity upon whole body protein turnover, though results are not completely unequivocal. Obese people have been reported to have elevated whole body protein turnover even when rates were expressed per FFM (2,3,4,5), and, in support of these findings, higher protein synthesis rates were demonstrated in various organs of obese rats (34). Elevated protein turnover rates in obese people could be caused by the large fat tissue mass (including adipocytes and other cell types such as macrophages) through effects upon the endocrine milieu, or even via proteolysis and protein synthesis within the fat tissue. However, such effects of obesity upon protein metabolism have not been certain and have remained unresolved because in some other studies, investigators did not observe this effect of obesity upon whole body protein metabolism in humans (6,7,8,9). Our aim here was not simply to compare lean to obese because we primarily sought to study a therapeutic intervention (CR) in individuals for which dieting is advised because of excessive adiposity. However, we did compare different levels of obesity, and severe obesity, vs. a moderate level of obesity, was accompanied by a large elevation of protein turnover both when expressed as total rates and when expressed per FFM. However, in SO the protein turnover declined substantially with CR, even though they were challenged with the same caloric deficit as the individuals who are only slightly obese. That is, even in the most SO individuals, protein metabolism is still sensitive to effects of diet even if the same level of CR is applied as used in the less obese people. Obesity is heterogeneous, and our results are that obesity level does affect protein turnover, and we hope that this will reconcile some of the uncertainty that comes about from reviewing the literature in which lean was compared to one level of obesity (2,3,4,5,6,7,8,9).
We observed no significant effect of obesity level or CR upon total plasma amino acid concentrations or concentrations of the BCAA. However, it has been proposed that obesity may lead to higher plasma concentrations of BCAA (35) and that the elevated BCAA may lead to obesity-related insulin resistance (36). In the study that we present here, though the higher proteolysis in the more obese individuals would release amino acids (including BCAA such as leucine), the higher proteolysis was accompanied by similarly higher simultaneous protein synthesis with thus a high rate of leucine clearance. Therefore, amino acids must have been cleared rapidly for protein synthesis, and the plasma leucine concentration thus did not reflect its flux rate. So, though we cannot corroborate reports of elevated plasma leucine concentrations, we did find elevated leucine flux.
As we found significant effects of CR upon circulating levels of some hormones, we then explored correlations between hormone concentrations and leucine kinetics, though for the sake of maintaining conciseness of this report, we have limited the data presentation to text rather than adding additional figures. Insulin tended to be positively correlated with leucine Ra and NOLD, and there was a statistically significant negative correlation between glucagon and epinephrine with leucine Ra and NOLD. Though increment of change in these hormones did not correlate with changes in leucine kinetics, there are some published reports supporting a relationship between these hormones and protein turnover. It has been shown that epinephrine is antiproteolytic (37,38) that is supportive of its negative correlation with protein turnover in this study. Additionally, we have previously shown the positive correlation of insulin with protein turnover (39) and conditions of high insulin without suppressed amino acids are considered to be anabolic (40,41). Although, unlike insulin and epinephrine, glucagon is not generally considered to be a hormone with significant control over protein synthesis and degradation, some evidence is available to support glucagon's negative association with systemic protein synthesis (26,42). It is conceivable that the effect of obesity level upon amino acid kinetics is driven simply by a sum effect of circulating hormone concentrations, but we cannot exclude the possibility that various other factors such as inflammation also play roles as well.
As a whole, it can be said that the more obese individuals experienced more rapid tissue remodeling, and that CR reduced the rate of tissue remodeling to a relatively similar extent between individuals of differing obesity level. Contrary to the popular belief, we find that SO individuals are not resistant to CR-induced alterations in protein turnover or FFM loss. In fact, as more obese individuals have more FFM and more protein turnover to start with, for their similar relative declines, they experience even greater absolute declines compared to MO individuals. Future work may address ways in which different CR regimens may alter amino acid kinetics in ways that will promote better maintenance of FFM during CR in SO people such that alterations of body composition are more favorable and metabolic rate does not decline substantially during CR.
Acknowledgments
We thank the study participants for their time and compliance with the protocol. We additionally thank Dr Basu, and members of the University of Vermont GCRC nursing and dietetic staff. This work was supported by funding from Univite Corporation, NIH grant RO1 DK412973 to K.S.N., NIH grants UL1 RR024150-01 and GCRC RR109, and G.C.H. was supported by NIH grant T32 DK07352.
Disclosure
The authors declared no conflict of interest.


