Prevalence of Unhealthy Lifestyle Patterns Among Overweight and Obese Adults
Abstract
This study determined the prevalence of unhealthy eating, exercise, and coping pattern traits among a large sample of overweight and obese adults. We analyzed responses to a 53-item lifestyle pattern questionnaire posted on a commercial weight loss program Web site collected from 2004 through 2008. Subjects included 446,608 healthy weight, overweight, and obese adults, 18–65 years old, average age 31.9 (s.d. = 11.8), average BMI 30.5 kg/m2 (s.d. = 7.5). Categorically, 25.5% were healthy weight, 29.0% were overweight, 33.7% were class I–II obesity, and 11.8% class III obesity. A stratified random sample was used to estimate the prevalence of the 21 lifestyle patterns (7 eating, 7 exercise, and 7 coping) in the general population, and the prevalence of patterns in the complete dataset was further analyzed by gender, age, and BMI. Finally, we analyzed the odds ratio of the pattern prevalence for each BMI category. We found that unhealthy lifestyle patterns in diet, exercise, and coping were highly prevalent among this population. In general, the prevalence of these patterns rose with increasing BMI and is correlated with advancing age. Gender differences were seen with many of the patterns, most noticeably among the coping patterns. The odds ratio for 18 of the 21 patterns was >1.0 and steadily increased with higher BMI categories. We conclude that unhealthy lifestyle patterns in diet, exercise, and coping are highly prevalent among the overweight and obese population. Pattern recognition represents a new method to analyze the cluster of behaviors, attitudes, and traits seen among this population.
Introduction
Lifestyle counseling approaches for weight management among overweight and obese adults include education, goal setting, and behavior change strategies. Clinicians strive to “tailor” their recommendations based on multiple factors, including the patient's medical history, knowledge, culture, preferences, values, and attitudes among many other factors. This tailoring approach has recently been termed “patient-centered care” (1). Numerous behaviors have been identified as potential obstacles to successful weight management and/or attention to self-care including skipping meals and eating at irregular mealtimes (2), night eating (3), consuming large portion sizes (4), physical inactivity (5), low confidence in ability to undertake an exercise program (6), lack of time to exercise (7), emotional stress (8), procrastination (9), and excessive caregiving responsibilities (10) among other factors. Several reviews have identified personal behavioral correlates and traits that are associated with successful weight reduction (11,12,13), Thus far, current counseling techniques do not allow rapid recognition of these personal characteristics.
A lifestyle pattern approach that incorporates diet, physical activity, and coping variables was previously developed (14). The self-assessment questionnaire characterizes three major behavioral domains—eating, exercising, and coping—each associated with seven individual patterns (1). We chose to describe the personal characteristics as “patterns” because they describe a specified style or form of behavior. Unlike empirically derived pattern analysis in which statistical methods (factor or cluster analysis) are used to generate patterns a posteriori; this questionnaire was theoretically derived a priori, i.e., patterns were conceptualized from experienced clinical practice. Patterns were labeled qualitatively for easy patient recognition. The patterns characterize behaviors, attitudes, or traits that are considered to be potentially important topics for discussion during weight management counseling and may serve as goals for targeted treatment strategies in clinical practice. A 12-month prospective weight loss study was previously conducted where the lifestyle pattern approach was used in a group format (15). The purpose of this study is to determine the prevalence of lifestyle pattern traits among a large sample of overweight and obese adults, and to assess trends that can be applied for clinical counseling.

Lifestyle pattern organizational chart and nomenclature. The three major behavioral domains—eating, exercising, and coping—are each associated with seven individual patterns. Patterns are labeled qualitatively for easy patient recognition. The patterns characterize behaviors, attitudes, or traits that are considered barriers to successful weight management.
Methods and Procedures
A convenience sample of 100 overweight and obese patients was asked to complete two questionnaires. The pattern questionnaire, a 70-item self-report measure conceptually developed on the basis of professional expertise, was composed of statements generated to identify seven eating, seven exercise, and seven coping patterns (14). Patients responded according to their level of agreement using a 6-point Likert scale. The second questionnaire was used to validate the pattern questionnaire by assessing patient ability to identify lifestyle patterns in themselves. Patients were provided with brief descriptions of all 21 lifestyle patterns and asked to identify their top three eating, exercise, and coping patterns. Internal consistency reliabilities for the 21 subscales were analyzed using Cronbach's coefficient α and ranged from 0.34 to 0.88 (mean 0.73). Agreement between the pattern questionnaire and valid measure was performed using χ2 test for each lifestyle pattern. Agreement was observed for 14 of the 21 lifestyle patterns. Statistically significant positive correlations were seen between BMI and number of eating, exercise, and coping lifestyle patterns scored by both questionnaires. On the basis of this analysis, a revised 53-item questionnaire was generated that is used in this study (see Supplementary Table S1 online).
Since 2004, the lifestyle pattern questionnaire has been posted free online on the commercial weight loss program Web site, http:www.diet.com. Individuals are asked to complete the 53-item self-reported questionnaire (see Supplementary Table S1 online) along with their age, gender, height, and weight. For each item, respondents are asked to rate their level of agreement using a 4-point Likert scale ranging from “agree on occasion or disagree” to “agree all of the time.” Each pattern is represented by responses to 2–4 items. A percent pattern score is then calculated by assigning a numerical value to the Likert scale responses; 0 = agree on occasion or disagree, 1 = agree much of the time, 2 = agree most of the time, and 3 = agree all of the time, such that % pattern score = respondents score/total possible score × 100. A percent score of ≥66 was considered a positive identification of a pattern. For this study, all data (N = 740,442) collected from May 2004 through March 2008 were obtained for subsequent analysis. After excluding duplicate entries due to returning respondents and entries with missing responses or demographic/biological information, we identified a subset of complete records that comprised first-time takers, ages between 18 and 65, and BMI (kg/m2) between 18.5 and 60.0 (n = 446,608). The average age of the respondents in this subset was 31.9 (s.d. = 11.8); the average BMI was 30.5 (s.d. = 7.5; categorically 25.5% were 18.5–24.9, 29.0% were 25–29.9, 33.7% were 30–39.9, and 11.8% were ≥40) and 87.7% were female. The vast majority of the data were from participants in the United States (78.2%), followed by Canada (6.1%), United Kingdom (4.5%), and Australia (1.8%). The total dataset included participants from over 200 countries. The majority of the participants were young (<30 years old) females.
We decided to create a subsample in order to simulate the distribution of age and gender in the general US population. A stratified random sample (n = 10,000) was drawn from the subset to match the 2000 US census distributions of age (from 18 to 65) and gender (http:www.census.govmainwwwcen2000.html). The subsample was drawn irrespective of the country of the participants and hence included respondents from many different countries assuming that the age and gender distributions would not be significantly different among the top four countries (Australia, Canada, United Kingdom, and United States) representing over 90% of the entire data. The stratified random sample was used to estimate the prevalence of the 21 lifestyle patterns in the general population. The relationship of the pattern prevalence and BMI was examined statistically and graphically. We also examined the odds ratio of the pattern prevalence for BMI categories using BMI 18.5–24.9 as baseline reference.
Statistical methods
Effect size was computed using three different effect size measures (Cohen's d, h, and η2) for comparing differences in proportions. Cohen's d is the difference between proportions divided by the standard deviation of the variable in the data. Effect size h transforms (linearizes) the proportions before taking the difference. Cohen's d and h are useful for comparing two groups (e.g., gender) at a time. When comparing three or more groups simultaneously, i.e., BMI categories, we used η2, which is the proportion of the total variance that is attributed to an effect (e.g., BMI). For Cohen's d and h, an effect size of 0.2 is considered a “small” effect, around 0.5 a “medium” effect, and 0.8 a “large” effect. For η2, a comparable rule of thumb is as follows: small (0.01), medium (0.06), and large (0.14).
The study was approved by the Institutional Review Board from Northwestern University.
Results
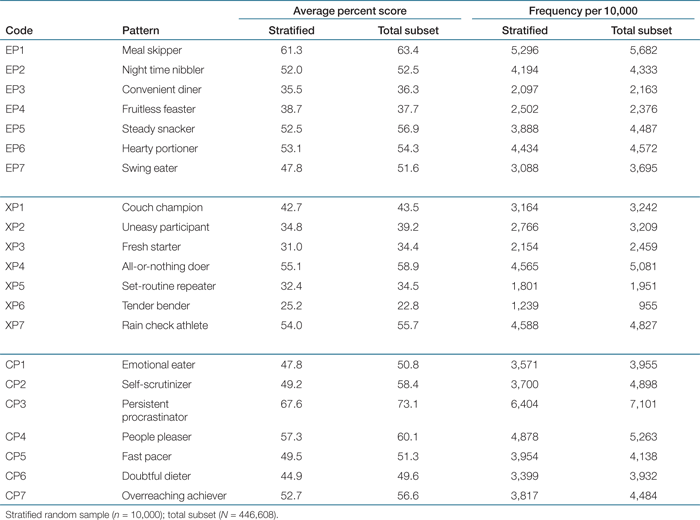
The percent scores and the prevalence of the lifestyle patterns calculated based on the stratified random sample and the total subset are displayed in Table 1. The prevalence is shown as the frequency of positive patterns per 10,000 people. The prevalence of the lifestyle patterns was calculated separately based on both the stratified random sample and the total subset. The prevalence based on the stratified sample reflected the marginal distribution of both age and gender. The stratified random sample and the total subset displayed somewhat different prevalence on some of the patterns. For example, the prevalence of the swing eater pattern was about 6% point higher in the total subset. This is because the pattern was more prevalent in young females who were heavily represented in the total subset.
 |
Prevalence of lifestyle patterns
The prevalence of all seven eating patterns was higher among the younger groups for both men and women, and decreased with advancing age. The most prevalent patterns were meal skipping, night time nibbling, steady snacking, and hearty portioning. In general, women endorsed swing eating (cycling between strict dieting and overindulgence) more than men (38.0% vs. 29.6%; Cohen's d = 0.174 and h = 0.178) whereas men endorsed convenient dining (eating fast food or dining out) more than women (26.6% vs. 20.9%; d = 0.139 and h = 0.134). A different picture emerged for the exercise patterns. The couch champion and tender bender (health-related concerns) patterns increased with advancing age. The prevalence for couch champion was greater for women than men (33.2% vs. 27.2%, d = 0.128 and h = 0.131), whereas no difference by gender was found for tender bender. In contrast, the prevalence for uneasy participant (uncomfortable exercising around others) and fresh starter (limited knowledge about how to exercise) diminished with advancing age. The all-or-nothing doer and rain check athlete (insufficient time to exercise) patterns remain relatively stable across the age bands and represent the most prevalent exercise patterns for both men and women. Regarding the coping patterns, clear gender differences emerged. The prevalence of five patterns is noticeably higher among women—emotional eater (41.1% vs. 28.7%; d = 0.254 and h = 0.261), self-scrutinizer (negative self-talk) (52.1% vs. 27.0%; d = 0.509 and h = 0.520), persistent procrastinator (72.5% vs. 60.5%; d = 0.265 and h = 0.255), people pleaser (low self-care) (54.4% vs. 40.3%; d = 0.284 and h = 0.283), and doubtful dieter (pessimistic thinking) (40.8% vs. 28.9%; d = 0.245 and h = 0.251)—and remain stable across the age bands except for self-scrutinizer that diminished with advancing age. The most prevalent coping pattern for both women and men was persistent procrastination. The effect size estimates as measured by Cohen's d and h indicate the gender differences are generally small with the exception of self-scrutinizer, which is considered medium. The effect of age bands on the prevalence of the patterns measured by η2 (η2 = SS effect/SS total) are small. The eating patterns with non-negligible age effects (η2 > 0.01) are meal skipper, convenient diner, steady snacker, hearty portioner, and swing eater. Two exercise patterns (fresh starter and tender bender) and two coping patterns (people pleaser and overreaching achiever) also show small age effects.
BMI and lifestyle patterns
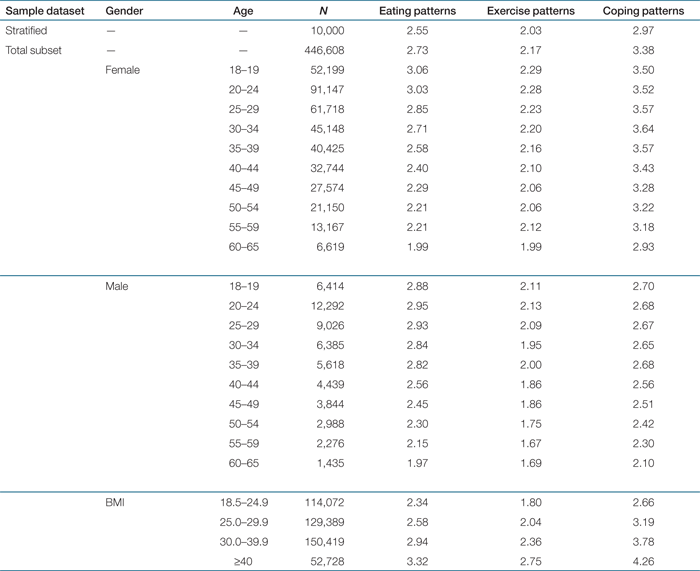
Regarding the effect of BMI on prevalence, one of the eating patterns (hearty portioner) showed a non-negligible (η2 > 0.01), systematic trend over BMI categories (18.5–24.9, 25–29.9, 30–39.9, and ≥40). Four exercise patterns (couch champion, uneasy participant, fresh starter, and tender bender) showed slightly larger effects (η2 ranged from 0.03 to 0.05; η2 of 0.06 is considered medium in size). Five coping patterns (emotional eater, self-scrutinizer, persistent procrastinator, people pleaser, and doubtful dieter) also showed systematic effects (η2 ranged from 0.03 to 0.05). The average number of endorsed patterns by gender, age, and BMI is displayed in Table 2. On average, individuals endorsed ∼2.5 eating patterns, ∼2 exercise patterns, and ∼3 coping patterns, and decreased with advancing age. The number of endorsed patterns is positively associated with increasing BMI categories. 2 display the prevalence of the patterns by BMI. The solid line is based on females and the dotted line is based on males. The prevalence of most patterns increased monotonically as a function of BMI. That is, people with a higher level of BMI are more likely to endorse the patterns. There were noticeable gender differences on all seven of the coping patterns. Furthermore, the magnitude of the differences on some of the patterns (e.g., self-scrutinizer) was rather substantial.
 |

Prevalence of (a) eating, (b) exercise, and (c) coping patterns by gender and BMI. The solid line is based on females and the dotted line is based on males.
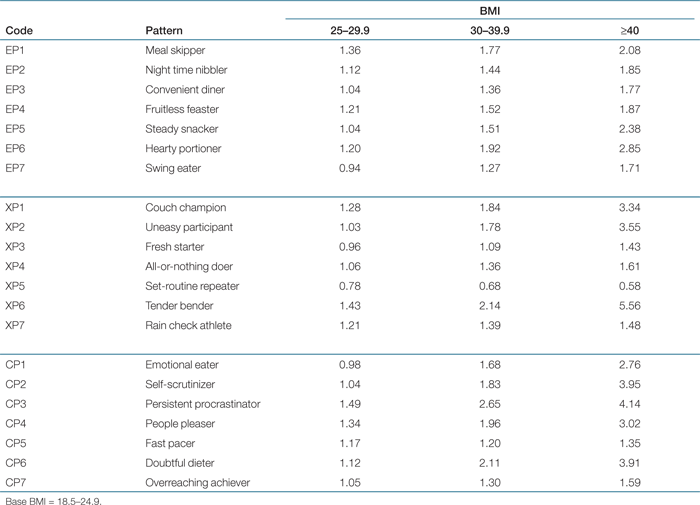
We further examined the effect of BMI on the prevalence of the patterns by computing odds ratios. Table 3 shows odds ratios of prevalence for the four BMI categories based on the stratified random sample (n = 10,000). The prevalence in the lowest BMI category (18.5–24.9) served as the criterion. The odds ratios were computed for the three representative samples. With the exception of swing eater (0.94), fresh starter (0.96), and emotional eater (0.98) among the overweight cohort (BMI 25–29.9), all odds ratios were >1.0 and steadily increased with higher BMI categories. The one additional exception was the set-routine repeater pattern where the odds ratio decreased for higher BMI categories. Some of the patterns (e.g., tender bender and persistent procrastinator) showed odds ratios approaching 4.0, i.e., four times more prevalent among people in the highest BMI category (≥40) in comparison with those in the base category (18.5–24.9). Odds ratio of 1.44 is roughly equivalent to a small effect size (i.e., d = 0.2); 2.46 to a medium effect size (d = 0.5); and 4.36 to a large effect size (d = 0.8). Using these criteria, the odds ratios for the third BMI category (30–39.9) in relation to the base category (18.5–24.9) can be considered to have small, systematic effects on most of the patterns. Furthermore, the odds ratios for the fourth BMI category (≥40) can be considered to have considerably larger effects (d = 0.5) on nine of the patterns (based on the combined sample).
 |
Discussion
The purpose of this study was to determine the prevalence of unhealthy lifestyle patterns among a large cohort of overweight and obese adults who voluntarily took the lifestyle patterns questionnaire on the commercial self-help Web site, http:www.diet.com. Although participants were primarily from the United States, over 200 countries were represented from 446,608 unique users. We identified clear population trends that were gender, age, and BMI dependent. In general, unhealthy eating patterns were highest among the younger age groups for both men and women. A different trend emerged for the exercise patterns. Here, there was an increase in sedentary behavior (couch champion) and physical hardship (tender bender) with advancing age. In contrast to the eating and exercise patterns, the coping patterns revealed distinct gender differences.
As seen from 2, the majority of eating, exercise, and coping patterns were positively correlated with BMI, although varying in slope and magnitude. Furthermore, the number of patterns reported by individuals rose progressively with increasing BMI categories. Noticeable differences were seen by gender particularly for the coping patterns. With the exception of one exercise pattern, set-routine repeater, the odds ratio for all of the unhealthy patterns steadily increased with each BMI category (Table 3). These data suggest that multiple individually identifiable domains or factors may need to be addressed when counseling obese patients. This concept is consistent with the new area of Multiple Health Behavior Research that posits that simultaneous counseling on several behavioral change targets may be more effective than sequential counseling in one health behavior at a time (16).
Pattern analysis has recently become a newly accepted method to analyze behavior. Traditionally, lifestyle modification counseling for obesity has utilized behavior and cognitive behavioral therapy that provides patients with a set of principles and techniques with which to modify eating and activity habits (17). However, knowing which set of habits, traits, or attitudes to focus on during counseling would provide more efficient “patient-centered” care. For example, there is little point in counseling an obese individual to reduce snacking and munching if her problem is eating large portions at meal time, or to counsel on the benefits of exercise when the patient's problem is lack of time. The value of pattern analysis is that it characterizes individual behaviors in real-world conditions. Groups or subgroups of individuals can be identified by these behavioral clusters and used to develop targeted treatment and assess health outcomes.
Preliminary studies from other investigators have also observed a relationship between unfavorable or less healthy lifestyle patterns, and increasing BMI. In their development of a health assessment tool, Chambers and Swanson (18) found that social and emotional influences toward eating and physical activity explained 40% of the variance in BMI. Ma et al. (19) reported positive associations between obesity and several eating patterns, such as skipping breakfast and eating three or fewer times daily. Colles et al. (20) observed that uncontrolled eating and grazing were identified as two high-risk eating patterns following bariatric surgery. More recently, Sanchez et al. (21) determined the prevalence and clustering patterns of four lifestyle risk behaviors (physical inactivity, sedentary behavior, fruit and vegetable consumption, and dietary fat intake) among 394 overweight women. Nine out of ten women in their study had two or more obesity-related behaviors, and a third had all four.
Identification of lifestyle patterns as used in this study represents the first step to provide personalized counseling based on one's personality characteristics as defined by Young et al. (22), “Personality determines specific patterns of social, motivational and cognitive-affective processes. It includes behavior, thought processes, emotional responses, and motivational needs.” Although some studies have previously assessed personality characteristics in obesity with variable results (23,24), many have noted distinct differences in traits between the obese and lean as well as among obese individuals (25,26,27,28,29,30,31,32). This area of research requires further investigation. Additionally, survey studies conducted among patients and physicians (33,34,35,36) show that, in general, less than half of obese adults are being advised to lose weight by health-care professionals. The low rates of treatment of obesity are thought to be due to multiple factors including limited time during office visits, lack of training in counseling, competing demands, and low confidence in ability to treat and change patient behaviors (37,38,39). Use of an efficient and tailored pattern-specific instrument may foster increased clinician obesity counseling.
The scope of the current study was limited to investigate the prevalence of lifestyle patterns derived in clinical settings using a large sample survey and to examine their associations with selected relevant covariates such as gender, age, and BMI. It is important to further investigate the factor structure of the questionnaire so as to refine the instrument with demonstrated construct validity. This will include identification of empirically relevant clusters of people with varying classifications of obesity based on a small number of well-defined and distinct factors.
The strength of this study is the extremely large database of nearly one half million individuals. Although the majority of users were young women, we analyzed the dataset by age cohorts from 18 to 65 years. A stratified random sample of 10,000 individuals was selected for analysis allowing a sufficiently large sample of males to be analyzed. The limitation of the study is that it represents a self-selected group of people who voluntarily logged onto a self-help weight loss program and all of the data are self-reported. We do not have race, ethnicity, or socioeconomic information to better characterize the subjects. Thus, our findings may not be generalized to other patient populations. Finally, because this was an observational study, the findings cannot be considered causal effects between the patterns and the demographic variables.
In summary, pattern recognition represents a new method to analyze the cluster of behaviors, attitudes, and traits seen among overweight and obese individuals. We have demonstrated that unhealthy lifestyle patterns in diet, exercise, and coping are highly prevalent among this population. In general, the prevalence of these patterns rose with increasing BMI and was correlated with advancing age. Gender differences were seen with many of the patterns, most noticeably among the coping patterns. It is hoped that better appreciation of unhealthy lifestyle patterns will lead to improved targeted treatment strategies for overweight and obese adults.
SUPPLEMENTARY MATERIAL
Supplementary material is linked to the online version of the paper at http:www.nature.comoby
Acknowledgments
We thank the Carl Greer Foundation for its generous grant to support funding for the analysis, to Dr Zhang, president of diet.com for making the subject data available, and to Dr. Mytko for development of the lifestyle patterns questionnaire.
Disclosure
R.F.K. serves as the medical director of the premium membership program for diet.com. S.W.C. declared no conflict of interest.