A Preliminary Candidate Genotype–Intermediate Phenotype Study of Satiation and Gastric Motor Function in Obesity
Abstract
Stomach motility contributes significantly to fullness sensation while eating and cessation of food intake in humans. Genes controlling adrenergic and serotonergic mechanisms (ADRA2A, GNB3, and SLC6A4) affect gastric emptying (GE), volume (GV), and satiation. Fat mass and obesity-associated gene (FTO) is linked with satiety. Our aim was to examine the association of these candidate genes with stomach functions that signal postprandial fullness: GE, GV, and maximum tolerated volume (MTV). These biomarkers constitute a component of the intermediate phenotype of satiation. A total of 62 overweight or obese participants underwent genotyping of the candidate genes, and validated measurements of GE of solids and liquids by scintigraphy, fasting and postprandial change in GV by SPECT (single photon emission computed tomography), and MTV by nutrient drink test. These markers of satiation were compared for 38 genetic variants in ADRA2A, ADR2C, ADRB3, uncoupling protein (UCP)-2 and -3, GNB3, FTO, and SLC6A4 using a recessive model of inheritance. ADRA2A, ADR2C, UCP-3, GNB3, and FTO loci were significantly associated with the intermediate phenotype markers of satiation: ADR2C (Ins-Del322_325) with accelerated GE; GNB3 (rs1047776) with delayed GE; ADRA2A (rs491589 and rs553668) and GNB3 (rs2269355, rs10849527, and rs3759348) with decreased postprandial GV; ADRA2A (rs3750625) and GNB3 (rs4963517 and rs1129649) with increased postprandial GV; UCP-3 (rs1685356) with increased MTV, and FTO (rs9939609) decreased MTV. Genetic susceptibility to postprandial satiation can be identified through intermediate phenotype markers. With independent validation, these markers may guide patient selection of weight-loss therapies directed at gastric motor functions.
Introduction
Obesity is a major health problem reaching epidemic proportions in the United States and in most industrialized countries (1) and leads to cardiovascular and metabolic diseases, as well as morbidity, mortality, and financial burden (2). The control of food intake (quantified by meal frequency and size) is a major determinant of an individual's weight status (3). Satiation is operationally defined by the symptoms experienced during feeding that results in cessation of eating (4). Satiation is influenced by oropharyngeal tactile, visual, olfactory, gustatory stimuli, by signals from postingestive processes and energy stores, (5) and by gastric motor functions. The stomach signals satiation in response to ingested volume and calories (6,7); the postprandial change in gastric volume (GV) is an independent predictor of maximum tolerated volume (MTV) and therefore satiation (8). In patients with functional dyspepsia and in obese subjects after administration of pharmacological perturbations to mimic dyspepsia, we demonstrated that gastric emptying (GE) of solids at 1 and 4 h postprandially, and fasting GV were associated with postprandial symptom scores such as fullness and bloating, reflecting satiation (9,10,11).
Intermediate phenotypes, which involve the same biological pathways as diseases, are considered to be less susceptible to confounding environmental influences than the phenotypes used to diagnose disease and therefore more relevant to the gene's actions (12) In our model (see 1), based on the concept of Huang et al. (12) obesity is the disease or clinical end point, satiation is the surrogate end point, and gastric motor functions and satiation volume are biomarkers or components of the intermediate phenotype. We are interested in identifying genes that determine decrease satiation, as this impacts the development of obesity. Because gastrointestinal hormones, such as cholecystokinin, glucagon-like peptide-1, ghrelin, and peptide YY, are associated with satiation (13), we plan to expand the intermediate phenotype markers of satiation in future studies.

The proposed conceptual pathogenetic model includes the disease of obesity as the clinical end point, satiation as the surrogate end point, and gastric motor functions and gastrointestinal hormones as biomarkers or endophenotype, subject to modulation by the genotype.
We examined common variants in candidate genes in an attempt to identify variants that alter satiation. The relevance of norepinephrine and serotonin to human gastrointestinal function and appetite is well established in the literature. We have shown that there is important α2-adrenergic modulation of gastric function by pharmacological studies (14), genotype–intermediate phenotype association (15) with gastric function, and we have documented the contribution of ADRA2A −1291C <G and GNB3 C825T or 5-HTTLPR with pharmacological response to sibutramine (16,17). These single-nucleotide polymorphisms (SNPs) may be simple biomarkers that are in linkage disequilibrium with the causative genetic variant that imparts differential function to the respective genes. Therefore, we evaluated further genotype–phenotype interactions in adrenergic mechanisms (including G protein) and serotonergic reuptake (SLC6A4) that may determine stomach function and satiation. Other genes associated with obesity (e.g., fat mass and obesity-associated gene, FTO; ref. 18) are also linked with satiety, but their association with gastric functions is unknown.
The aim of this study is to explore the hypothesis that genetic variations in the control of ADRA2A, ADR2C, ADRB3, GNB3, 5-HTTLPR, uncoupling proteins (UCP-2 and -3), and FTO are associated with changes in gastric function and satiation. This aim was pursued by comparing the associations with gastric functions for the three genotypes using the recessive model.
Methods and Procedures
Selection of participants
We used a database of 234 normal weight, overweight, or obese subjects who participated in previous studies in our laboratory in order to estimate the minor allele frequency (MAF) in a representative white population from the same geographic region of the upper mid-West of the United States. We obtained approval to use stored DNA by the Mayo Clinic's institutional review board. This approval was in accordance with written informed consent from the participants to use their stored DNA. The origination of this database through multiple studies has been described in detail elsewhere (15). As 10 participants in the DNA collection subsequently withdrew consent to use their medical records for research, the final sample was 224 people.
For the specific aim of this study, 62 white, normal weight, overweight (BMI: 25–29.9 kg/m2), and obese subjects (BMI >30 kg/m2) were included; they had previously participated in our studies of the pharmacogenetics of sibutramine (16) and our studies of gastric sensorimotor functions in obesity (8,15). Men and women between the ages of 18 and 65 years residing in Olmsted County, Minnesota who were not currently on treatment for cardiac, pulmonary, gastrointestinal, hepatic, renal, hematologic, neurologic, endocrine (other than hyperglycemia not requiring medical therapy), or unstable psychiatric disease were eligible. Participants were excluded if their weight exceeded 137 kg (because of a weight limit of the SPECT (single photon emission computed tomography) camera) and if they had a positive history of previous abdominal surgery other than appendectomy, cholecystectomy, cesarean section, or tubal ligation. They also were excluded if they had a positive history of any systemic disease that could affect gastrointestinal motility; or used medications that may alter gastrointestinal motility, appetite, or absorption (e.g., orlistat). Permissible medications were multivitamins, birth control pills, estrogen, and thyroxine replacement, all at stable doses for at least 30 days before the physiological studies. Women of childbearing potential (not postmenopausal/not surgically sterilized) had a negative pregnancy test within 48 h before the studies that included radioisotopes. The study was approved by the Mayo Clinic's institutional review board.
GE, accommodation and satiation data were available from the previous studies in 50 participants (46 with solid GE, 45 with liquid GE, 49 with GVs, and 50 with satiation test data). These studies were completed in the remaining 12 participants.
Experimental protocol
All participants gave written informed consent and on different days, they presented to the Mayo Clinic Clinical Research Unit at 7 am after an 8-h fasting period and underwent a GE scintigraphic study, a nutrient drink satiation test, and a gastric accommodation SPECT study in this order. GE and SPECT studies were performed at least 72 h apart in order to avoid interference by 111In from the meal ingested during the GE study with the measurement of GV by SPECT.
GE study with scintigraphy
A volume of 1.0 mCi 99mTc-sulfur colloid was added to two raw eggs during the scrambling, cooking process. The eggs were served on one slice of buttered bread with 240 ml of 1% milk (total calories: 296 kcal, 32% protein, 35% fat, 33% carbohydrate) labeled with 0.1 mCi 111In-DTPA. Anterior and posterior gamma camera images were obtained immediately after radiolabeled meal ingestion, every 15 min for the first 2 h, then every 30 min for the next 2 h (total 4 h after the radiolabeled meal) (8). Data were analyzed as in previous studies (19). Geometric mean of decay-corrected counts in anterior and posterior gastric regions of interest was used to estimate the proportion of 99mTc or 111In emptied at each time point. GE end points of analysis were t1/2 for solids and liquids.
GV and accommodation assessment with 99mTc-SPECT
We used a noninvasive method to measure GV during fasting and at 32 min after 300 ml of Ensure (316 kcal) using SPECT. The method has been validated in detail elsewhere (20). Intravenous injection of 99mTc sodium pertechnetate, which is taken up by the parietal and nonparietal cells of the gastric mucosa, allows visualization of the stomach wall. Tomographic images of the gastric wall are obtained throughout the long axis of the stomach using a dual-head gamma camera (SMV SPECT System; SMV America, Twinsburg, OH) that rotates around the body. This allows assessment of the radiolabeled circumference of the gastric wall rather than the intragastric content. Using the AVW 3.0 (Biomedical Imaging, Mayo Foundation) image-processing libraries, a three-dimensional rendering of the stomach is obtained and its volume (ml) calculated. There is high intraobserver reproducibility to measure GV with this technique (21). Intra- and interindividual coefficients of variation (at average 9 months) are ∼12% (ref. 22).
Nutrient drink satiation test
We used a standardized and validated nutrient drink test (23) to measure satiation and postprandial symptoms when drinking a liquid nutrient at constant rate (30 ml/min Ensure: 1 kcal/ml, 11% fat, 73% carbohydrate, and 16% protein). Every 5 min, subjects scored level of fullness or satiation using a horizontal scale combining verbal descriptors and numbers (0 = no symptoms; 5 = maximum or unbearable fullness/satiation). Nutrient intake was stopped when subjects reached the score of 5, and caloric intake to achieve maximum satiation was recorded. Postprandial fullness, nausea, bloating, and pain were measured 30 min after the meal using 100-mm horizontal visual analog scales, with the words “none” and “worst ever” anchored at the left and right ends of the lines for each symptom.
Rationale for selection of candidate genes
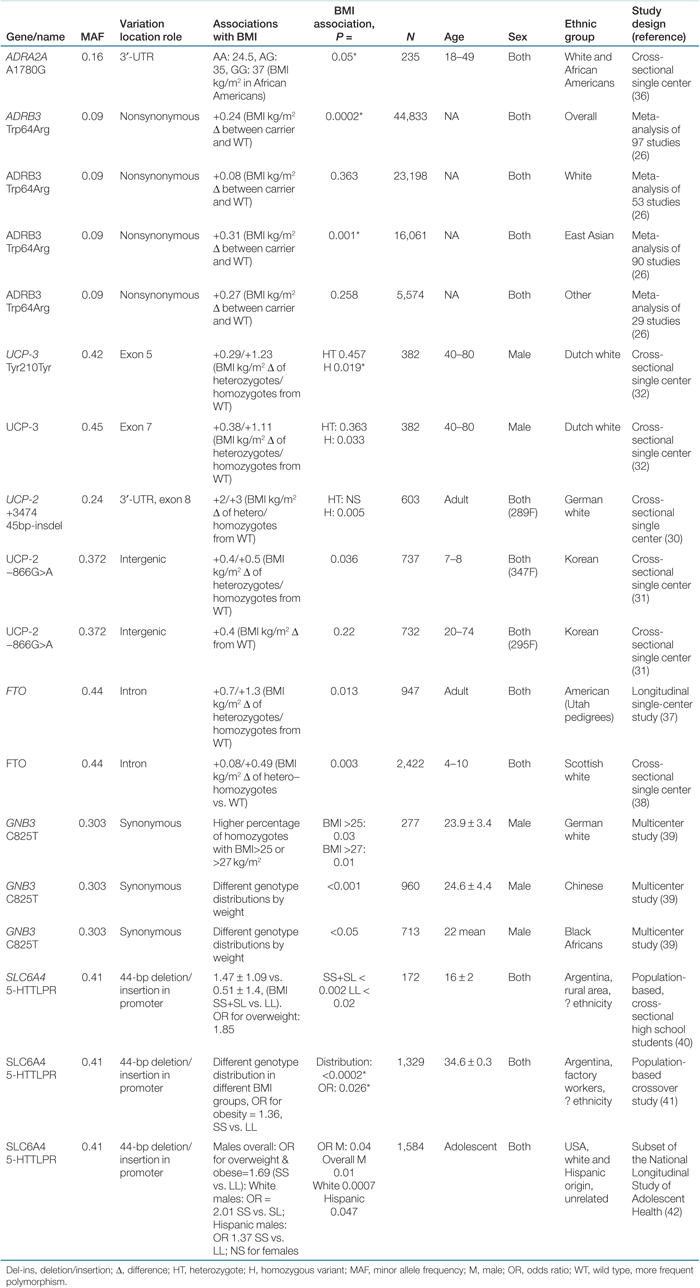
At least 17 loci have been reported to be associated with variation of BMI (24). We have previously studied the association of ADRA2A −1291C <G and GNB3 C825T or SLC6A4 with the intermediate phenotype of postprandial satiation and with pharmacological response to sibutramine (16,17). In Table 1, we include these and other genetic variations in ADRA2A, GNB3, and SLC6A4, and summarize a literature review of the main polymorphisms associated with BMI and obesity phenotypes in different populations.
 |
Indirect epidemiological and experimental data also support the hypothesis that other candidate mechanisms may be involved in control of gastrointestinal functions that lead to satiation. These mechanisms include:
1. β3-adrenoreceptor and the rationale for inclusion are based on tissue expression in gastrointestinal organs (25) and the association of Trp64Arg ADRB3 genetic variant with BMI in a meta-analysis 44,000 people (26).
2. Fat mass and obesity-associated gene (FTO), SNP rs1421085, which is significantly associated with childhood and adult onset obesity (27); SNP rs9939609 is also associated with satiety (18,28).
3. UCPs comprise a family of mitochondrial transporters that control the process of adaptive thermogenesis. Two proteins of relevance are UCP-2, which is widely expressed in human tissues including the stomach (29), and UCP-3 which is predominantly expressed in skeletal muscle, is involved in adaptive thermogenesis in humans, and interacts with norepinephrine. Variants in the genes controlling UCP-2 and UCP-3 are epidemiologically linked to BMI or satiation (30,31,32). Furthermore, the central hypothalamic effects of ghrelin appear to be mediated by a UCP-2-dependent pathway; as ghrelin affects gastric motility (33) and appetite in the short term, it is relevant to assess whether genetic variations in UCP-2 alter gastric function and satiation.
Because previous studies identified ADRA2A −1291C <G and GNB3 C825T in association with gastric motor functions (14,15,16,17), we used the Genome Variation Server sponsored by Seattle SNPS (http:gvs.gs.washington.eduGVS) to identify TagSNPs in the ADRA2A, GNB3, UCP-2, and UCP-3 genes expanding the amount of variation studied in those genes. TagSNPs for the genes of interest were selected to capture SNPs with a MAF of 10% with an R2 of 0.9. Analysis of linkage disequilibrium among the SNPs of the candidate genes was analyzed using HaploView 4.1 (ref. 34).
Genetic testing
Genomic DNA was isolated from peripheral blood leukocytes in previous studies (using the Gentra Purgene Blood Kit (Qiagen, Valencia, CA)). We used assays for 38 variations in the genes of interest.
Genotyping of α2C adrenoreceptor (Del322–325) polymorphism (ADRA2C (Del322-325)], 5-HTTLPR polymorphism was performed using previously published method (ref. 15). For UCP-2 +3474 45bp-insdel, the A 45-bp insertion/deletion was identified by PCR-based fragment length polymorphisms and confirmed by random direct sequencing. We used oligonucleotide primers flanking the polymorphic region forward (5′-CAG TGA GGG AAG TGG GAG G-3′) and reverse (5′-GGG GCA GGA CGA AGA TTC-3′) as used by Walder et al. (35).
Genotyping of the remaining 35 SNPs was performed by TaqMan SNP Genotyping Assays (Applied Biosystems, Foster City, CA) according to the manufacturer's instructions, using 10–20 ng DNA. Following PCR amplification, end reactions were read on the ABI 7500 Fast Real-Time PCR system using Sequence Detection Software, version 1.3.1 (Applied Biosystems).
Statistical methods
We assessed the associations of allelic subtype for 38 variations in the genes of ADRA2A, ADR2C, ADRB3, UCP-2, UCP-3, GNB3, FTO, and 5-SLC6A4 with intermediate phenotype using an analysis of covariance (adjusting for age and gender) separately for each gene. As some genes exhibited a low minor allele genotype (<5%), the analysis combined the homozygous minor genotype with the respective heterozygous allele type yielding the recessive gene model in the analysis of covariance analyses. The α level for testing genotype association was set at 0.05 in light of the exploratory hypothesis-generating nature of the analyses. Thus, no correction was made for multiple genes examined.
Statistical power
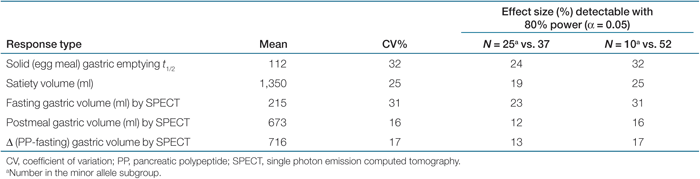
The univariate association of genotype with intermediate phenotype response can be considered via comparison of response values among the genotypes for a given gene (i.e., a comparison of group mean values). Table 2 summarizes data for primary response measures and uses the relative variation (coefficient of variation %) to estimate the effect size detectable with 80% power based on a two sample t-test at a two-sided α level of 0.05. The effect size is the difference in group means as a percentage of the overall mean for each response. The total number of subjects with specific physiological (intermediate phenotype) measurements varied between 49 and 62 depending on the measurement and the effect sizes detectable for any specific gene depend on the number in each subtype (minor homozygous plus heterozygous vs. major homozygous). In general, assuming roughly 10, or separately 25, in the minor allele/heterozygous subtype implies the remainder (52 or 37) are in the other subtype. The analysis of covariance models provided similar power for somewhat smaller differences by incorporating relevant covariates (e.g., gender in the case of GE and MTV). The data for satiety testing in healthy volunteers, for scintigraphic GE and for SPECT, have been published elsewhere (19,20,23). The observed variation (coefficient of variation %) among subjects in this study was very similar to those listed in Table 2.
 |
Results
Demographics of participants
The demographic data and flow of participants, all of whom were European Americans, are summarized in 2.

Study flow chart. Note that the age, gender, and BMI distributions of the 62 people who underwent intermediate phenotyping were similar to those of the entire cohort of people from southeastern Minnesota, USA.
Allelic frequency of candidate SNPs in people in southeastern Minnesota
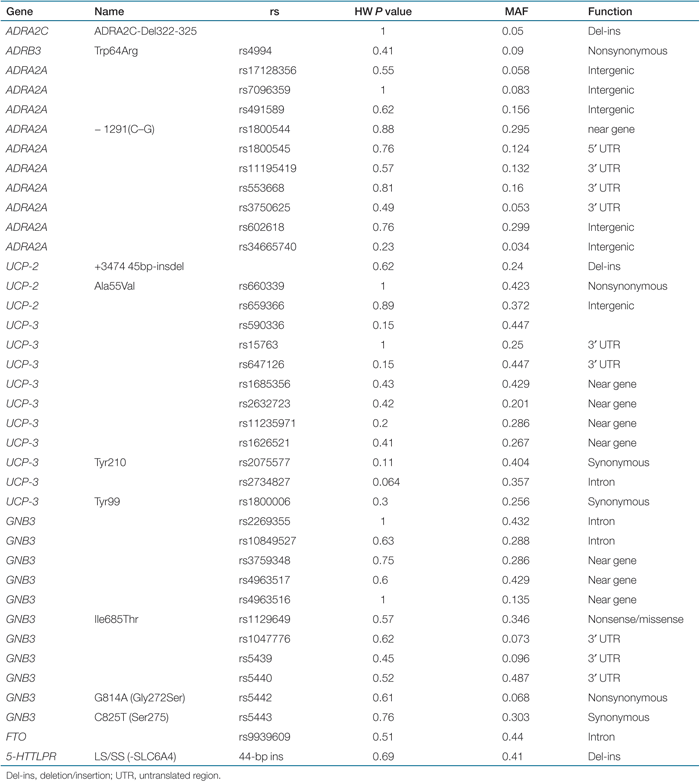
MAFs of 38 SNPs pertaining to the genes of ADRA2A, ADRA2C, ADRB3, GNB3, SLC6A4, FTO, UCP-2, and UCP-3 have been estimated in 234 adults (N = 5 normal weight, N = 55 overweight, and N = 164 obese). Data are summarized in Table 3. The allelic frequencies were in Hardy–Weinberg equilibrium (Table 3).
 |
Association of candidate genes with indexes of satiation and gastric motor function
In 62 of these people (5 normal weight, 28 overweight, and 29 obese), ADRA2A, ADRB3, UCP-2, UCP-3, GNB3, FTO, and SLC6A4A loci were significantly associated with altered gastric functions or satiation. Data for associations (adjusted for age and gender) for each SNP tested are summarized in Table 4.
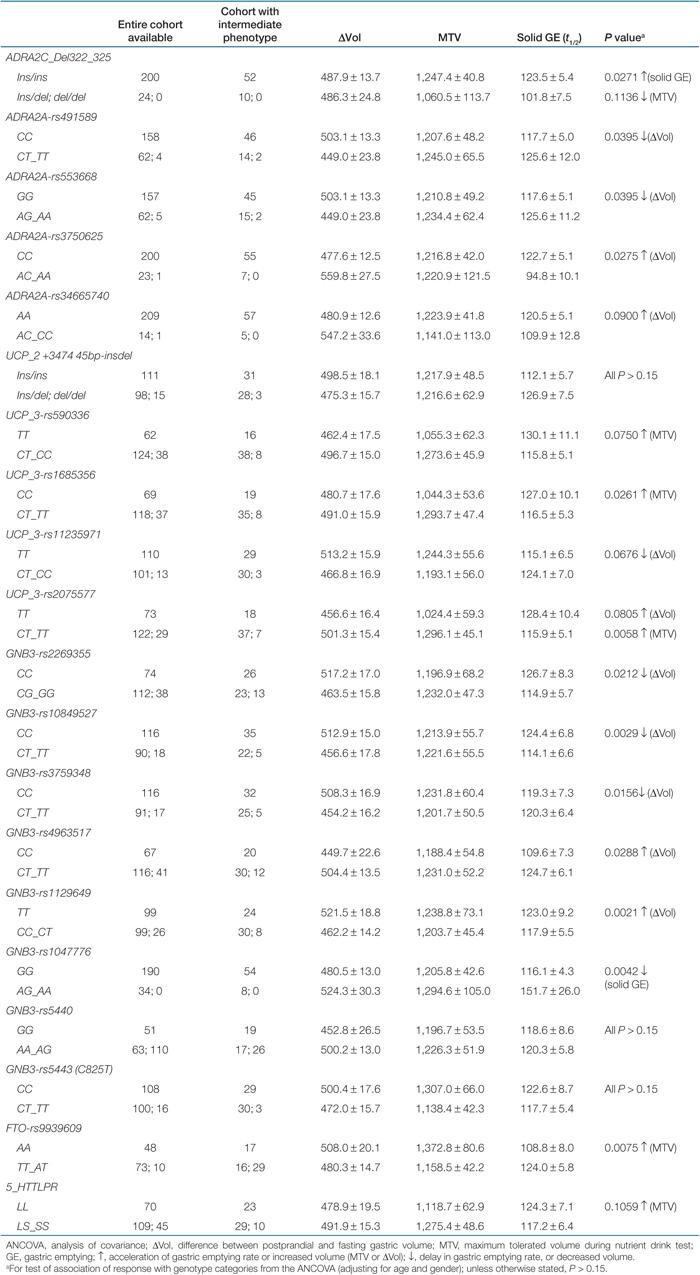 |
Using the recessive model, associations were identified between intermediate phenotypes and the following candidate genes:
1. ADR2C (Ins-Del 322_325) had accelerated GE of solids; and GNB3 (rs1047776) had delayed GE;
2. ADRA2A (rs491589 and rs553668) and GNB3 (rs2269355, rs10849527, and rs3759348) had decreased postprandial GV;
3. ADRA2A (rs3750625) and GNB3 (rs4963517 and rs1129649) had increased postprandial GV;
4. UCP-3 (rs1685356) had increased MTV;
5. FTO (rs9939609) had decreased MTV.
Linkage disequilibrium
Haploview was used to assess whether there was linkage disequilibrium of SNPs within the different candidate genes. These are illustrated in 3. Two haploblocks were identified within GNB3, three within the UCP-2/UCP-3 locus and one within ADRA2A. Note that there is expected linkage among TagSNPs selected for study within a gene (e.g., GNB3, ADRA2A). Of the SNPs listed in Table 4 which are associated (P < 0.10) with gastric motor function or satiation, the following also occur within a haplotype block: GNB3 rs10849527, and rs3759348 in block 1; UCP-3 rs590336 in block 4; UCP-3 rs1685356, rs11235971, rs2075577 in block 5; and ADRA2A rs491589, rs553668, rs3750625 in block 6.

Haploview analysis of haploblocks within the candidate genes studied. Two haploblocks were identified within (a) GNB3, (b) three within the UCP-2/UCP-3 locus, and (c) one within ADRA2A. (d) Population frequencies are shown next to each haplotype and lines show the most common crossings from one block to the next, with thicker lines showing more common crossings than thinner lines. Shown beneath the crossing lines is multilocus D′.
Whereas, GNB3 rs5439 and rs5440 were in linkage disequilibrium in block 2, and UCP-2 +3474 45bp-insdel and rs660339 were in linkage disequilibrium in block 3, none of these SNPs were associated with gastric motor function or satiation at P < 0.10.
Discussion
In this preliminary study, we explored the association between genetic variations of 38 candidate genes associated with obesity, and gastric motor functions and satiation in overweight and obese European Americans. We detected (Table 4) significant associations of certain genetic variations with the intermediate phenotypes of satiation and measures of gastric motor functions. These findings, which are not corrected for multiple comparisons, are preliminary and serve to generate hypotheses for future studies.
The number of genotype and genome-wide association studies with obesity has steadily increased during recent years; however, data on genotype–intermediate phenotype associations in obesity are lacking. This study provides new evidence on the potential relevance of genetic modulation of gastric motor functions that may determine satiation in obesity. These include slower GE, reduced fasting GV and postprandial (accommodation) GV, and lower MTV. We had previously demonstrated that these functions were associated with postprandial fullness and bloating in obesity and dyspepsia (9,10,11). These symptoms would be expected to lead to feeding cessation and hence impact on body weight through their effect on calorie ingestion.
Although the results of this study are promising, they should be regarded as hypothesis-generating and replication of the results in larger studies is warranted. It is also relevant to note that the magnitude of differences in the physiological end points (e.g., ins/del ADRA2C Del 322–325 was associated with faster t1/2 GE of solids by an average of 21 min) may not be sufficient to induce clinical symptoms, such as symptoms of dumping syndrome. However, this genetic variation may be relevant in the context of calorie intake, as Delgado-Aros et al. (10) showed that MTV changed by 78 ± 36 ml for each 10% change in the rate of GE. Being able to tolerate 150 kcal per fully satiating meal in patients with heterozygous variant of ADRA2C Del 322–325 may conceivably impact calorie intake and body weight.
The other genetic variants were associated with a single intermediate phenotype marker. Therefore, the precise physiological mechanism underpinning the lower MTV with genetic variations related to UCP-3 and GNB3 genes cannot be determined in the current studies. For example, it is conceivable that the association of UCP-3 and satiation is unrelated to gastric functions and is more closely or directly related to the effects of norepinephrine on adipocytes, which change appetite control and calories ingested. Despite these limitations, the current data provide the basis for future larger studies to address the genotype–intermediate phenotype of satiation. Such studies have the potential to identify susceptibility genes to select patients and identify targets for therapy in obesity and metabolic syndrome. Future studies will also include studies of association of the candidate genes with gastrointestinal peptides and hormones that mediate satiation or satiety, such as cholecystokinin, glucagon-like peptide-1, and peptide YY.
Limitations and strengths
In view of the small sample size, it is possible that there is a type 2 error, and underestimation of the association strength of some gene polymorphisms cannot be excluded. Moreover, the positive findings may be potentially spurious because of the multiple end points and the relatively large number of genetic variations evaluated. Rather than evaluating all the genetic loci linked to obesity in the literature, we limited our study to a comprehensive assessment of all the genetic variations of candidate genes that are associated with satiation or satiety based on epidemiological or experimental evidence. Use of validated physiological end points rather than clinical end points, like BMI or weight change, allows for much smaller sample sizes, and the current pilot study has provided important information to plan the size of future studies. Thus, we have estimated that for each candidate gene, we require 25 major genotype and 25 minor genotype to detect (with 80% power) gene associated effect sizes of 18% in solid GE t1/2, 14% in satiation volume, 18% in fasting GV, and 9% in postmeal GV by SPECT. The sample sizes are therefore practical in the setting of a single-center study employing comprehensive, specialized physiological testing to study genotype–intermediate phenotype associations.
In fact, the effect sizes demonstrable with the samples studied appear large when compared with the reported effect of disease-associated variants on disease predisposition. However, this study has used intermediate phenotypes with known clinical significance. For example, the 20% effect size demonstrable for the t1/2 GE of solids is in the range that differentiates health from gastroparesis.
One of the strengths of this study is the extensive use of validated, reproducible methods with known coefficients of variation in the assessment of gastric motor functions and satiation, supporting comparisons in relatively small samples of people of candidate genetic differences with previously demonstrated biological functions. The single-center design with the advantage of a uniform, European American group provides a reliable estimation of MAF for the genes of interest in southeastern Minnesota. These MAFs were also in Hardy–Weinberg equilibrium and consistent with allele frequencies in reports in the literature or publicly available databases. More importantly, this is the first study that addresses possible associations of ADRA2A, ADR2C, UCP-3, and FTO polymorphisms with gastric intermediate phenotype in obesity. The availability of original MAF data for the southeastern Minnesota population is also valuable for sample size estimation in these studies. Thus, with a relatively large MAF and associations with BMI from epidemiological studies, the intermediate phenotype approach allows study of selected polymorphisms to identify those that predispose to significant and clinically meaningful alteration of gastric motor function or satiation.
In conclusion, inherited variation in genes of ADRA2A, ADR2C, UCP-3, GNB3, and FTO are associated with changes in gastric motor functions and satiation. These data support the hypothesis that intermediate phenotype markers can be used to explore genetic predisposition to decreased satiation, and if confirmed, would identify susceptibility genes to select patients for peripherally targeted weight-loss therapies. These may include devices or medications that reduce gastric reservoir volume, or medications that alter GE.
Acknowledgments
M.C. is funded in part by grants RO1-DK-67071 and K24-DK-02638 from National Institutes of Health. These studies were facilitated by the patient care and Endoscopy and Imaging Laboratory of the Mayo Clinic CTSA grant RR0024150 from National Institutes of Health. A.P. was funded by an international grant of the Hellenic Society of Gastroenterology.
Disclosure
The authors declared no conflict of interest.