No Association of PTPN1 Polymorphisms With Macronutrient Intake and Measures of Adiposity
Abstract
The protein tyrosine phosphatase nonreceptor type1 (PTPN1) gene encodes for the protein tyrosine phosphatase 1B, which suppresses the signaling pathway of leptin. Variations of the PTPN1 gene may lead to changes in leptin sensitivity and thereby influence eating behavior and measures of obesity. This study investigated the association between single-nucleotide polymorphisms (SNPs) of the PTPN1 gene and eating behavior and different measures of obesity, including visceral fat. We used data from a population-based, cross-sectional study of 382 Dutch white men aged 40–80 years. Self-reported macronutrient intake was collected with a food frequency questionnaire. Anthropometrical measurements included BMI, waist and hip circumference, total lean and fat mass measured with dual-energy X-ray absorptiometry, and visceral and subcutaneous fat measured with ultrasound. Associations were studied using linear regression analysis. There were no statistically significant associations of SNPs in the PTPN1 gene with dietary phenotypes or measures of obesity.
Obesity is a major health problem, especially in populations with an increasing imbalance between energy intake and expenditure. The health problems associated with obesity are numerous and range from an increased risk for developing type 2 diabetes to certain types of cancer. Recent evidence suggests a key role for the brain in controlling both body fat content and glucose metabolism (1). Leptin, an adipocyte-secreted hormone, acts on different neurons in the hypothalamus, which ultimately results in inhibition of food intake and an increase in energy expenditure. Leptin levels increase in proportion to adiposity, however, most obese individuals become leptin-resistant (2,3).
Targeting molecules involved in the development of leptin resistance is a potentially powerful therapeutic approach for combating the obesity epidemic. One such target could be the protein tyrosine phosphatase 1B (PTP1B) encoded by the protein tyrosine phosphatase nonreceptor type1 (PTPN1) gene. PTP1B interferes with the leptin pathway as well as with insulin signaling through actions in the brain. PTP1B suppresses the signaling pathway of leptin and increased activity of PTP1B leads to increased stimulation of food intake (1,4). Hence, variations of the PTPN1 gene may lead to changes in leptin sensitivity and thereby influence eating behavior and measures of obesity.
Several studies (5,6,7,8,9) found an association between single-nucleotide polymorphisms (SNPs) in the PTPN1 gene and various measures of obesity, such as central fat, moderate obesity, BMI, and adiposity. However, each study analyzed the measures of obesity differently. For instance, Kipfer-Coudreau et al. (6) defined obesity as BMI >40 kg/m2, whereas others defined obesity as BMI >30 kg/m2 (5) or analyzed it as a continuous trait (7,8,9). This makes it hard to compare results from the different studies.
So far no studies have been performed on the relation between the PTPN1 gene and macronutrient intake, the amount of visceral fat, or the difference between visceral and subcutaneous fat. The amount of macronutrient intake is important for the development of obesity (10,11,12), whereas visceral fat is the type of fat that is causing most harm (13).
In this study, we investigated the association between four tag SNPs in the PTPN1 gene with macronutrient intake and different measures of obesity, including visceral fat.
Results
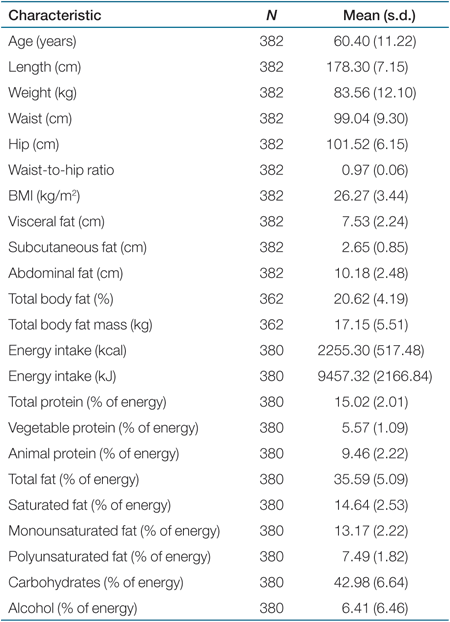
Typing of the four tag SNPs resulted in genotype success rates between 95.8 and 98.4%. None of the SNPs deviated significantly from Hardy-Weinberg equilibrium (P > 0.05). Anthropometrical and food intake characteristics of the participants are shown in Table 1.
 |
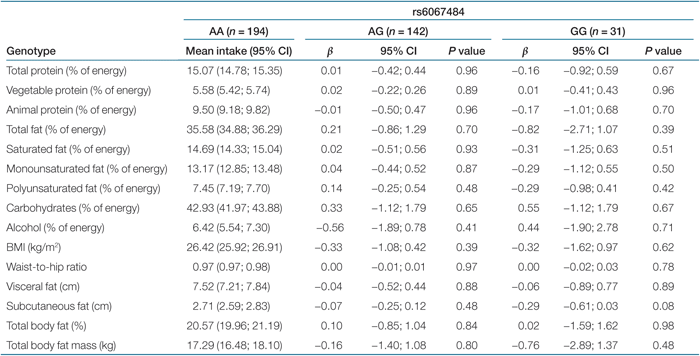
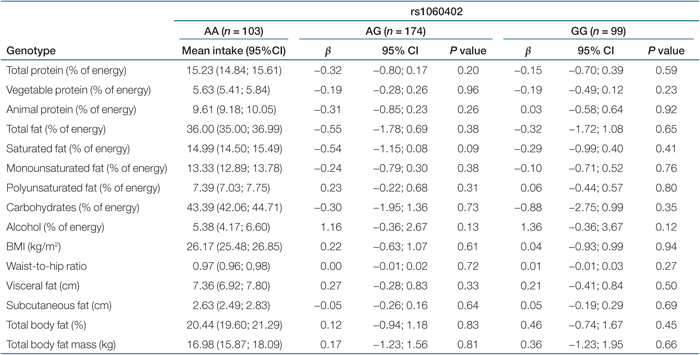
Results of the linear regression analyses of nine dietary phenotypes with PTPN1 tag SNPs are shown in Tables 2,3,4,5. We observed no statistically significant association of the four tag SNPs in the PTPN1 gene with dietary phenotypes. Tables 2,3,4,5 also show results of the association analyses of six obesity-related characteristics with the same four SNPs. The four tag SNPs in the PTPN1 gene were not associated with measures of obesity-related characteristics (like BMI, waist-to-hip ratio, visceral fat, and total body fat). P values for interaction ranged from 0.13 to 0.81. Consequently, no subgroup analysis was performed.
 |
 |
 |
 |
Discussion
We show that four tag SNPs, covering 95.5% of the genetic variation of the PTPN1 gene, are not associated with eating behavior or various measures of obesity in healthy Dutch males.
The strengths of our study comprise the population-based design and the thorough dietary information obtained with a validated food frequency questionnaire. The Pearson correlation's coefficient between the food frequency questionnaire and 12 monthly 24-h recall questionnaires ranged from 0.61 to 0.85 for the macronutrients, energy intake, and alcohol intake (14). Extensive anthropometric information, including a measure of visceral fat, was also available. Associations between dietary intake and adiposity measures have been published in large study populations, for example, the association between protein intake and BMI in the Greek segment of the EPIC study (12) and the association between dietary fat and weight gain among women of the Nurses' Health Study (11). In our data, correlations were comparable, with the strongest being between carbohydrate intake (%energy) and total body fat percentage (r = −0.31, P ≤ 0.01).
A limitation of our study might be the size of the study population. However, with a minimum minor allele frequency of 0.22, we had 80% power to detect differences in nutrient intakes of on average 4% at a significance level of 0.05 assuming a codominant model of inheritance. This means that the effects that we could pick up in our study are very small (see Supplementary Table S1 online). For example, we could detect a difference of 3.3% in percentage intake of energy from total protein. So, a difference in percentage intake of energy from protein between genotypes from 15.02% to 15.52% could be detected.
However, we cannot exclude that we might have missed smaller effects, because confidence intervals were wide and still compatible with the presence of small associations. In addition, the precision of nutrient intake measurement is less than perfect and could have reduced the power of this study, though the magnitude of this effect is difficult to quantify.
Use of food frequency questionnaires is associated with some measurement error, like many other tests and questionnaires. Regression calibration is a way to adjust for measurement error in dietary questionnaires (15). We were not able to apply regression calibration because we did not administer a repeat-food frequency questionnaire for assessment of the reliability coefficient. However, because our effect estimates relating SNPs to nutrient intake were very close to the null value, little change is to be expected when applying measurement error correction.
Furthermore, we used ultrasound for intra-abdominal fat measurement instead of computed tomography, which is the gold standard. However, ultrasound is also a good and validated measurement compared to both computed tomography and magnetic resonance imaging (16). We also looked at a single gene, thereby ignoring potential interaction between other genetic and nongenetic factors in the leptin/eating behavior/obesity pathway.
Five previously studied PTPN1 SNPs have been associated with obesity traits (5,6,7,8,9). However, only for the SNP rs2038526 associated with BMI (7) (P < 0.05) and the SNP rs941158 associated with moderate obesity (odds ratio = 1.2 (1.01–1.43), P = 0.04) (5) we could check for linkage disequilibrium with our four tag SNPs selected by using Hapmap SNP Genotyping data and Haploview version 3.2. The other three SNPs associated with body fat, subcutaneous fat, or obesity (6,8,9) were not in the Hapmap data, and rs2038526 was in strong linkage disequilibrium with rs6020611 (r2 = 0.92, D′ = 0.96) and in moderate linkage disequilibrium with our other three tag SNPs (r2 < 0.60, D′ ≤ 1). However, rs2038526 was genotyped in a Chinese and Japanese population. This might be an explanation for inconsistency in study results, and rs914458 was not in linkage disequilibrium with any of our SNPs (r2 < 0.01, D′ ≤ 0.23). Another complication that makes it hard to compare previous associations is the difference in study populations and study designs (5,6,7,8,9). They consisted either of the subjects with morbid obesity (BMI >40 kg/m2) (6), hypertension (7), different ancestry (7,9), or females(8).
Our study could not confirm these previously reported associations in an unselected population. To our knowledge, no other studies have looked at the relation between the PTPN1 gene and macronutrient intake.
Obesity is a complex trait that results from the contribution of several genetic and nongenetic risk factors acting together. The findings in this study do not support the presence of an association between PTPN1 and measures of obesity and eating behavior. However, we cannot exclude the possibility that variants in PTPN1 may contribute to variation in eating behavior when investigated in combination with other contributing genetic and nongenetic factors in the pathway.
Methods
Design
This was part of a cross-sectional, single-center study on 400 men aged between 40 and 80 years; this study has been described elsewhere (17). In brief, participants filled in questionnaires on lifestyle and dietary intake and visited the study center twice for physical examination. Fasting blood samples were obtained, and DNA was isolated using standard methods. Data were collected between March 2001 and April 2002. All participants gave written informed consent before enrollment in the study, which was approved by the institutional review board of the University Medical Center Utrecht.
We excluded two men from the study for whom DNA was not available. In addition, 16 nonwhite men were excluded. The final study population comprised 382 white men.
Food frequency questionnaire
The food frequency questionnaire contained questions about the amount and average consumption of 178 food items during the 12 months before enrolment in the study. The questionnaire allows estimates of the daily consumption of different food groups. The food frequency questionnaire was validated in pilot studies prior to the start of the study (14).
The 1996 Dutch food composition table was used to calculate energy and macronutrient intakes (18), and all macronutrient density values were calculated as a percentage of total energy intake.
Anthropometric measurements
Height and weight were measured and the BMI (kg/m2) calculated. Waist circumference was measured at a level midway between the lower rib margin and iliac crest, and hip circumference was measured at the level of the greater trochanter. The average of two readings was used in the analyses. Waist-to-hip ratio was calculated from these two measurements.
Visceral and subcutaneous fat were measured using a HDI 3000 (Philips Medical Systems, Eindhoven, the Netherlands) C 4–2 ultrasonographic transducer (16). For all images, the transducer was placed on a straight line drawn between the left and right midpoints, between the lower rib and iliac crest. Visceral fat comprised the distance between peritoneum and lumbar spine. Subcutaneous fat comprised the distance between the skin and the linea alba. For the measurement of visceral fat mass, we measured distances from three different angles (medial, left, and right). For the subcutaneous fat mass, the distance from the medial angle was measured three times. The mean of the three different measurements was calculated and used in our analyses. Total body fat mass was calculated using dual-energy X-ray absorptiometry (Hologic QDR 1000 densitometer; Hologic, Waltham, MA). Calibration of the densitometer was performed every morning, using the standard provided by the manufacturer.
Genotyping
We selected tag SNPs to optimally cover the genetic variation in the PTPN1 gene. Information about SNPs in the PTPN1 gene was obtained from the international HapMap project (www.hapmap.org, HapMap data Rel#21/phase II Jul 06). Tag SNPs were selected using the program Haploview version 3.2, which is based on Tagger software (www.broad.mit.edumpgtagger) (19) so that all SNPs with a minor allele frequency of ≥0.10 were captured with r2 ≥ 0.8.
Four tag SNPs were genotyped using Taqman assay-on-demand (Applied Biosystems, Foster City, CA) (assays C__29542758_10; rs6020611, C___3244384_10; rs1060402, C___3244371_10; rs6067484, C__27501003_10; rs3787348) and a Taqman 7900HT (Applied Biosystems, Foster City, CA) according to the manufacturer's specifications on 6–8 ng/µl DNA in 384 wells plates. Approximately 10% of all samples (n = 44) were measured in duplo, and all plates included negative controls.
Data analysis
Population characteristics were described using means with standard deviations for continuous, normally distributed variables and frequencies with percentages for categorical variables. The genotype frequencies were tested for Hardy-Weinberg equilibrium using a χ2 test with 1 degrees of freedom.
Linear regression analysis was used to analyze the association between genotypes of the tag SNPs and different measures of obesity. To investigate the association between the genotypes and the amount of food intake, the contribution of different macronutrients to total food intake and food-intake patterns linear regression was used.
In case of significant findings at the α = 0.05 level, we adjust our analyses for multiple comparisons using the Benjamini Hochberg method for controlling the false discovery rate (20).
As obese individuals may become leptin resistant, effects of PTPN1 SNPs may be restricted to nonobese individuals. Therefore, we stratified the analysis according to the median BMI (<26 kg/m2 and ≥26 kg/m2). First, an interaction term between the SNP and BMI was added to the models also containing the individual variables. When the interaction P value was <0.10, a subgroup analysis of men according to BMI was performed.
All statistical analyses were performed using SPSS, version 14.0 for Windows.
SUPPLEMENTARY MATERIAL
Supplementary material is linked to the online version of the paper at http:www.nature.comoby
Acknowledgment
This study was financially supported by SenterNovem (IOP Genomics IGE05012). We thank Jackie Senior for editing the manuscript.
Disclosure
The authors declared no conflict of interest.