TOF-SIMS Analysis of Lipid Accumulation in the Skeletal Muscle of ob/ob Mice
Abstract
Skeletal muscle lipid accumulation is associated with several chronic metabolic disorders, including obesity, insulin resistance (IR) and type 2 diabetes. The aim of this study is to evaluate whether static imaging time-of-flight-secondary-ion mass spectrometry (TOF-SIMS) equipped with a Bismuth-cluster ion source can be used for studying skeletal muscle lipid accumulation associated with obesity. Mouse gastrocnemius muscle tissues in 10-week-old obese ob/ob (n = 8) and lean wild-type C57/BL6 (n = 6) mice were analyzed by TOF-SIMS. Our results showed that signal intensities of fatty acids (FAs) and diacylglycerols (DAGs) were significantly increased in skeletal muscle of the obese ob/ob mice as compared to the lean wild-type mice. These differences were revealed through a global analytical approach, principal component analysis (PCA) of TOF-SIMS spectra, and ion-specific TOF-SIMS images. Region-of-interest (ROI) analysis showed that FA signal intensities within the muscle cell were significantly increased in ob/ob mice. Moreover, analysis of the ratio between different FA peaks revealed changes in monounsaturated FAs (MUFAs) and polyunsaturated FAs (PUFAs), which is in agreement with previous reports on obesity. These changes in FA composition were also reflected in the ratio of different DAGs or phosphatidylcholines (PCs) that contain different FA residues. Imaging TOF-SIMS together with PCA of TOF-SIMS spectra is a promising tool for studying skeletal muscle lipid accumulation associated with obesity.
Introduction
Skeletal muscle lipid accumulation is associated with several chronic metabolic disorders, including obesity, insulin resistance (IR), and type 2 diabetes (1,2,3). Current interest in these disorders has motivated the development of imaging techniques to evaluate the importance of muscle lipid accumulation and to discover abnormal patterns of fatty acids (FAs) within skeletal muscle in those disease states. Individual lipids in the skeletal muscle are usually characterized using high-performance liquid chromatography, thin-layer, or gas chromatography (4,5,6). However, these techniques require extraction steps and lipid derivatization from tissues, which are both time consuming and require relatively large amounts of tissues. Moreover, these techniques cannot reveal the heterogeneous distribution of lipids in the skeletal muscle because different skeletal muscle fibers have different amount of lipids and lipids can accumulate between skeletal muscle fibers.
Using imaging time-of-flight-secondary-ion mass spectrometry (TOF-SIMS), it is possible, without chemical pretreatment of the tissue, to measure directly the intensity of, and map the localization of, specific signals from different biomolecules within the skeletal muscle fiber (7,8,9). The novel use of cluster primary ions, such as Bismuth (Bi3+), has enhanced the emission of larger molecules and causes less fragmentation, as compared to the atomic primary ions (10,11,12,13,14).
The aim of this study is to evaluate whether imaging TOF-SIMS can be used for studying skeletal muscle lipid changes associated with obesity. Homozygous ob/ob mice, which lack functional leptin, exhibit an obesity syndrome that is phenotypically similar to type 2 diabetes (15,16). Here, we compared the profile of different lipids, such as FA, diacylglycerol (DAG), and phosphatidylcholine (PC) of gastrocnemius skeletal muscle from two groups of animals, namely, the obese ob/ob mice and lean wild-type C57/BL6 mice.
Methods and Procedures
Animals
Ten-week-old male ob/ob mice (n = 8) and wild-type C57/BL6 mice (n = 6) were purchased from Harlan (Horst, the Netherlands). The mice were housed in environmentally controlled conditions with a 12-h light/dark cycle. The animals had free access to standard mouse chow and water. The ob/ob mice weighed approximately twice as much as the wild-type mice (ob/ob mice: 41.3 ± 2.3 g; wild-type mice: 21 ± 1.6 g, P < 0.001). All experiments were approved by the regional animal ethics committee in Gothenburg, Sweden.
Sample preparation for cluster-TOF-SIMS imaging
Mice were anaesthetized with isofluran, and gastrocnemius skeletal muscle was extirpated and frozen immediately. The skeletal muscle was sectioned into 16-µm thick slices with a cryostat at −20 °C. The sections were placed on glass plates and briefly stored at −80 °C until analysis (1–2 days). Before TOF-SIMS analysis, the sections were freeze dried in a vacuum chamber overnight.
TOF-SIMS data acquisition and processing
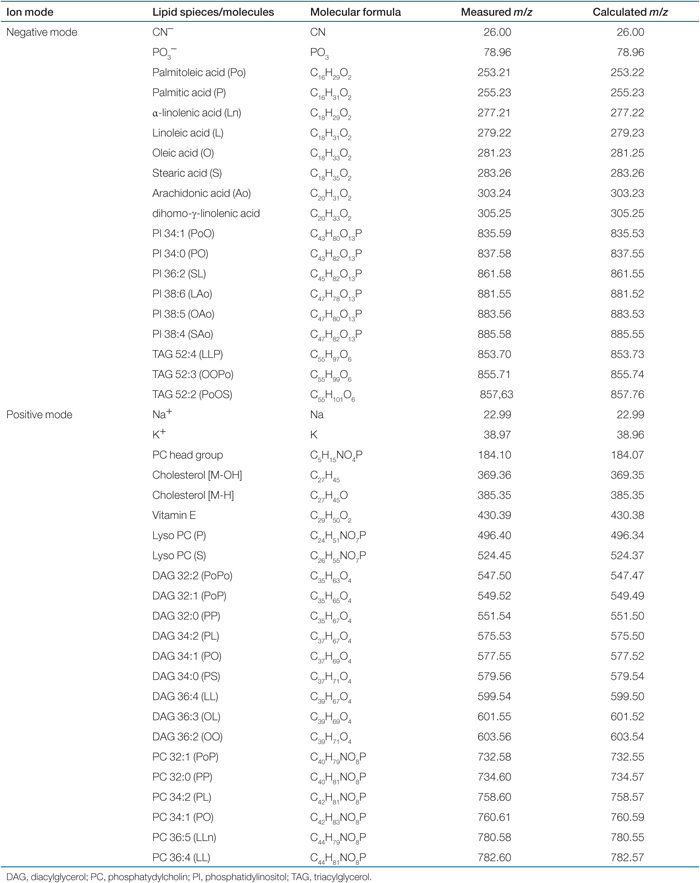
The TOF-SIMS experiments were carried out in a TOF-SIMS IV instrument (ION-TOF GmbH, Münster, Germany) equipped with a Bi-cluster liquid metal ion source. Spectra of positive and negative ions were recorded using 25 keV Bi3++ primary ions and low-energy electron flooding for charge compensation. Spectra were recorded with the instrument optimized for maximum mass resolution (bunched mode: m/Δm = ∼3,000–6,000, beam diameter ∼5 µm, pulse width 1 ns, repetition rate 6.7 kHz). Ion images were recorded with the instrument optimized for maximum image resolution (burst alignment mode: m/Δm = ∼350, beam diameter 0.2–0.3 µm, pulse width 100 ns, repetition rate 9.1 kHz). The average primary ion current was 0.16 pA in the bunched mode and 0.04 pA in the burst alignment mode, and the primary ion dose in all analyses was <5 × 10¹¹ ions/cm2. This is well below the so-called static limit of 1013 ions/cm2, which means that the measurement was terminated before the surface had been significantly damaged by the primary ion beam. The sample surface was observed continuously during the analysis using an integrated video camera. Analysis of the peak intensities and peak-intensity ratios from selected molecule-specific ions was carried out using secondary-ion spectra recorded in the bunched mode at an analysis area of 500 × 500 µm2 (256 × 256 pixels). The peak assignments were based on the measured mass of the ions (as compared to the calculated mass, see Table 1), and in comparison with previously published spectra and with reference spectra from pure lipids. The isotopic contributions (from both one 13C- and two 13C-containing ions) were taken into account in the calculation of lipid ion intensity. TOF-SIMS images were obtained in the burst alignment mode at an analysis area of 249 × 249 µm2. The image resolution during acquisition was 256 × 256 pixels but was compressed to 128 × 128 pixels to increase the contrast, leading to a pixel size of ∼2 µm. Spectra and images were extracted from the recorded data using the instrument software Ion Spec and Ion Image (ION-TOF GmbH, Münster, Germany).
 |
Region-of-interest analysis
Region-of-interests (ROIs) were manually delineated and mass spectra within the defined regions were extracted to obtain ion signals from intramyocellular areas.
Statistics
Variance patterns within the TOF-SIMS peak intensities were analyzed by principal component analysis (PCA), described in detail elsewhere (17), using PLS_Toolbox 4.0 (Eigenvector Research, Wenatchee, WA) for MATLAB version 7.1.0.246 R14 (The MathWorks, Natick, MA). Spectral variations between samples are visualized in score plots, in which each dot represents an individual sample. The loading plots show the contribution of each original variable (ion peak) to the new variables, principal components (PCs). All significant peaks with intensities >50 counts in the m/z region of 200–900 in the negative ion spectra and of 300–900 in the positive ion spectra were selected for analysis. Peak intensities were normalized to total ion intensities, and the data was autoscaled before analysis. To further elucidate the differences between two groups, the data were analyzed with Student's unpaired t-test. Values are presented as means ± s.d. A P value <0.05 was considered statistically significant.
Results
Representative negative and positive TOF-SIMS spectra from skeletal muscle of ob/ob and wild-type mice are shown in 1. In the negative spectra (1), peaks from fragment ions such as CN− and PO3− were detected below m/z 100. In the m/z region of 200–350, we detected signals from FA carboxylate ions, which have been well described by others (7,9,18). In the m/z range of 830–900, we observed peaks corresponding to molecular ions of phosphatidylinositols and triacylglycerol ions that have been identified previously (19). In the positive spectra (1), we observed strong peak at m/z 184 corresponding to the phosphocholine ion, a fragment originating from both sphingomyelin and PC. This peak was used for the localization of phosphocholine-containing phospholipids in the skeletal muscle. In the intermediate region, we found significant peaks representing cholesterol [M-OH]+ at m/z 369, vitamin E at m/z 430, and lysophosphatidylcholine ions at m/z 496 and 524. Peaks corresponding DAG ions, [M-OH]+, were detected within the m/z range of 550–640. These ions can be derived from the native DAG molecules (8) and/or the fragmentation of the triacylglycerol molecules (20). In the m/z region >700, signals of PC ions were detected. Table 1 shows identified ions in the positive and negative ion spectra.
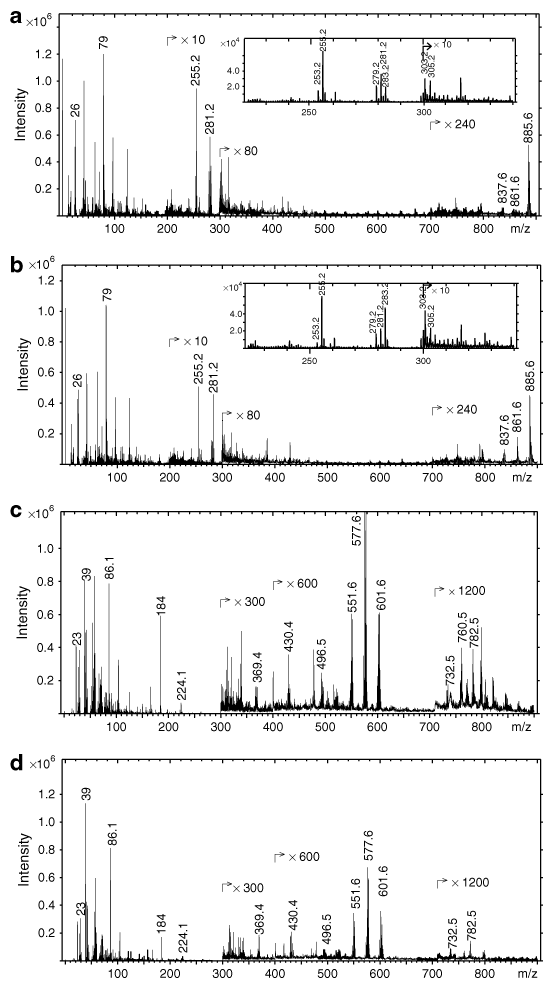
TOF-SIMS mass spectra from frozen and freeze-dried skeletal muscle section in the m/z range of 0–900. Representative negative-ion TOF-SIMS mass spectra, with a close-up of m/z range of 220–340 (inlets), from (a) obese ob/ob mice and (b) lean wild-type C57/BL6 mice. Representative positive-ion TOF-SIMS mass spectra from (c) obese ob/ob mice and (d) lean wild-type C57/BL6 mice. TOF-SIMS, time-of-flight-secondary-ion mass spectrometry.
PCA was used to compare spectra from the ob/ob and wild-type mice. The first three PCs in the PCA models are shown in 2 and 3 as three-dimensional score and loading plots. 2 shows the score plot for negative spectra from the skeletal muscle, where the ob/ob mice can be distinguished from the lean wild-type mice mainly on the PC2 and PC3 axis. 2,2 shows the corresponding loading plots, where palmitoleic, oleic, and linoleic acids can be identified as the main contributors to the cluster of the ob/ob mice. 3 shows the score plot for positive spectra from the skeletal muscle. Here the ob/ob mice can be distinguished from the wild-type mice, mainly on the PC2 and PC3 axis. 3–3 shows the corresponding loading plots, where the main contributors are some of the DAG peaks and cholesterol. The cholesterol ion intensities were higher in the skeletal muscle of the ob/ob mice than the wild-type mice, but according to the t-test, the difference was not significant (data not shown).
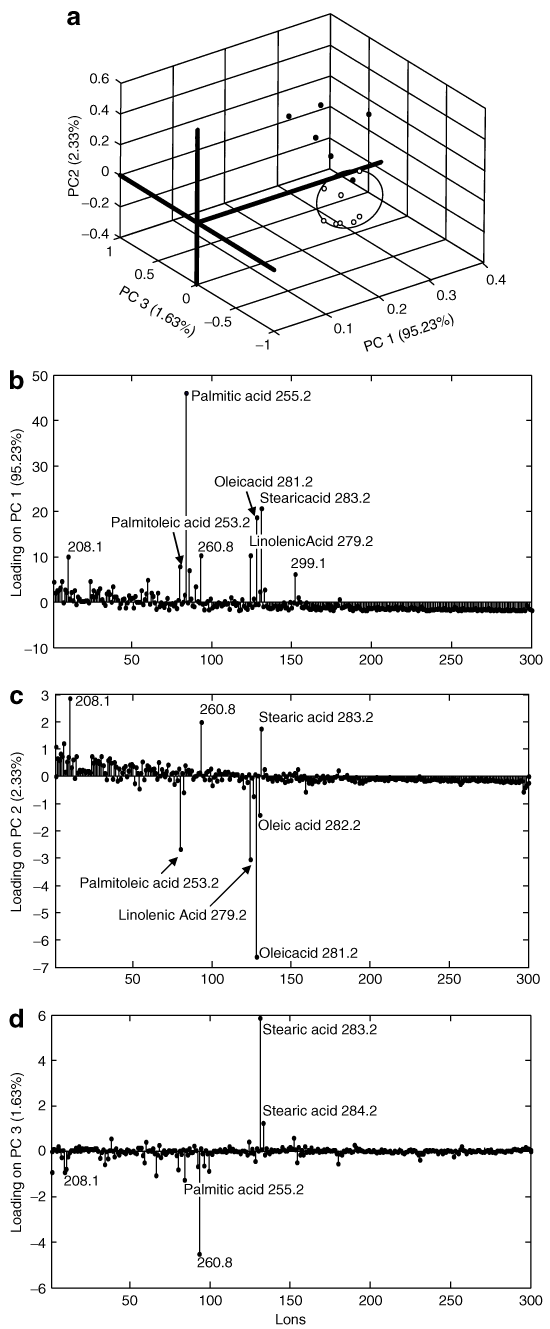
(a) PCA three-dimensional score plot generated using a combination of PC1, PC2, and PC3 and loadings on (b) PC1, (c) PC2, and (d) PC3 of negative spectra with a m/z range of 200–900 from fresh-frozen and freeze-dried skeletal muscle sections from obese ob/ob mice (opened circles) and lean wild-type C57/BL6 mice (filled circles). PCA, principal component analysis.

(a) PCA three-dimensional score plot generated using a combination of PC1, PC2, and PC3 and loadings on (b) PC1, (c) PC2, and (d) PC3 of positive spectra with a m/z range of 300–900 from fresh-frozen and freeze-dried skeletal muscle sections from obese ob/ob mice (opened circles) and lean wild-type C57/BL6 mice (filled circles). DAG, diacylglycerol; PCA, principal component analysis.
4 shows that FA signal intensities were higher in the obese ob/ob mice than the lean wild-type mice. Significant differences were observed for monounsaturated FA (MUFA): palmitoleic (C16:1) and oleic (C18:1) acids, as well as for polyunsaturated FA (PUFA): linoleic (18:2), alpha-linoleic (18:3) and arachidonic (C20:4) acids, but not for saturated FA: palmitic (C16:0) or stearic (C18:0) acids. 4 shows calculated ratios of different FA peaks. The ratios of C16:1/C16:0, C18:1/C18:0, and C20:4/C20:3 were significantly higher, whereas the ratios of C18:2/C18:1 and C20:3/18:2 were significantly lower in the skeletal muscle of the obese ob/ob mice than the lean wild-type mice.
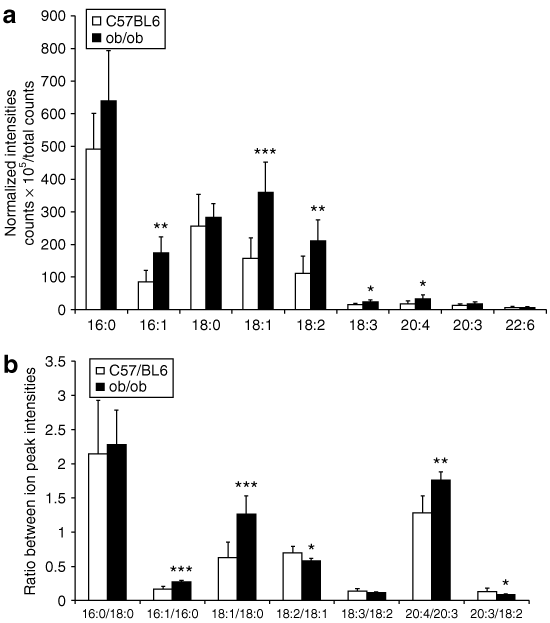
Time-of-flight-secondary-ion mass spectrometry analysis of different fatty acid (FA) peaks from the negative spectra. (a) The ion intensity of FAs normalized to total ion counts; (b) ratios of different FA peaks. The data are presented as means ± s.d. for six lean wild-type mice (C57/BL6) and eight obese ob/ob mice. *P < 0.05; **P < 0.01; ***P < 0.001 compared to C57/BL6 mice.
5 shows that signal intensities of most DAG ions were significantly upregulated in the skeletal muscle of the obese ob/ob mice compared to the lean wild-type mice. 5 shows the ratio of different DAG peaks. The ratio of DAG with at least one MUFA residue (C16:1 or C18:1) over DAG with saturated FA residues (C16:0 or C18:0) was upregulated in the skeletal muscle of the obese ob/ob mice when compared to the lean wild-type mice. The ratio of DAG with PUFA residues (C18:2) over DAG with at least one MUFA residue (C18:1) was significantly reduced in the skeletal muscle of the obese ob/ob mice compared to the lean wild-type mice. 5 shows the ratio of PCs with different FA residues: the ratio of PC 32:1 (16:1, 16:0) to PC 32:0 (16:0, 16:0) was significantly upregulated in the skeletal muscle of the obese ob/ob mice. The ratio of PC 34:2 (16:0, 18:2) to PC 34:1 (16:0, 18:1) was significantly decreased in the skeletal muscle of the obese ob/ob mice. Thus, changes in DAG ratios and PC ratios imitated the changes in FA ratios.
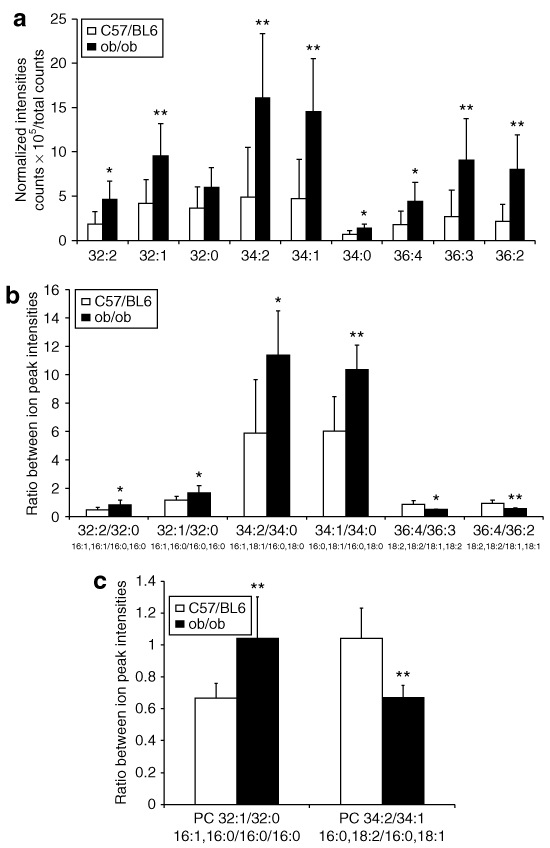
Time-of-flight-secondary-ion mass spectrometry analysis of different diacylglycerol (DAG) and phosphatidylcholine (PC) peaks from the positive spectra. (a) The ion intensity of DAGs normalized to total ion counts; (b) ratios of different DAG peaks; (c) ratios of different PC peaks. The data are presented as means ± s.d. for six lean wild-type mice (C57/BL6) and eight obese ob/ob mice. *P < 0.05; **P < 0.01 compared to C57/BL6 mice.
To further investigate whether the increased signal intensity of lipids in the skeletal muscle of the obese ob/ob mice was due to lipid accumulation within the skeletal muscle cell, 20 skeletal muscle cells from each 500 × 500 µm2 area were delineated and mass spectra were obtained. Our result showed that in the ob/ob mice FA signal intensities within the skeletal muscle cell were significantly increased to the same extent as the increment observed when the whole 500 × 500 µm2 surface area was analyzed (6).
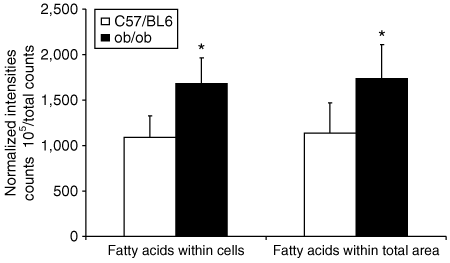
Time-of-flight-secondary-ion mass spectrometry spectra were extracted from a 500 × 500 µm2 area or 20 delineated skeletal muscle cells from each 500 × 500 µm2 area. Normalized intensity was calculated by adding up fatty acid ion counts, and then normalizing to total ion counts. The data are presented as means ± s.d. for six lean wild-type mice (C57/BL6) and eight obese ob/ob mice. *P < 0.05 compared to C57/BL6 mice.
To study the distribution of different lipids in the skeletal muscle, TOF-SIMS images showing the lateral distribution of specific lipid signals were obtained (7). In the lean wild-type mice, high signal of palmitic acid C16:0 was located in the edge of the skeletal muscle cell (7), which possibly comes from the muscle fascicle membrane, while in the obese ob/ob mice high C16:0 signal was widely scattered over the surface of the skeletal muscle cell (7). The signal distribution of palmitoleic acid C16:1 (7), linolenic acid C18:2 (7), oleic acid C18:1 (7), and stearic acid C18:0 (7) was scattered throughout the skeletal muscle fiber area, and skeletal muscle fibers of the ob/ob mice had stronger FA signals (7) than those of the wild-type mice (7). Overlay images of C18:0 and C18:1 (7) show that there was an uneven distribution of these FAs. To obtain more precise information, we have selected different ROIs: cells containing high-signal intensities of C18:1 (red ROI) or C18:0 (green ROI) (7). From each ROI a mass spectrum was extracted and C18:1/C18:0 ratio was calculated (7). Our data showed that the red ROI had higher C18:1/C18:0 ratio than the green ROI.
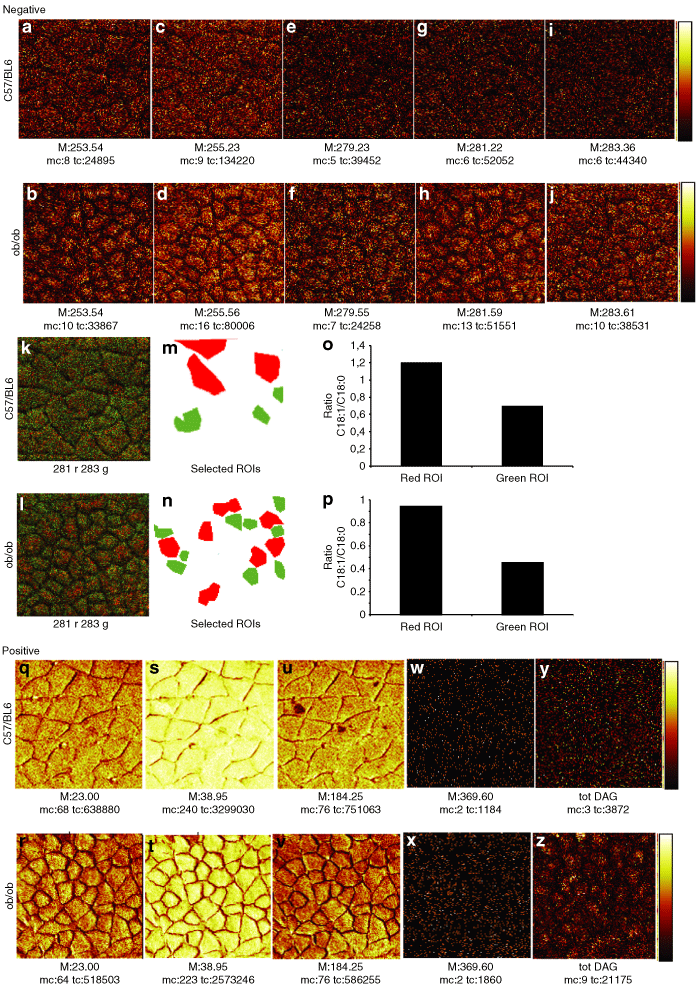
(a-p) Negative and (q-z) positive time-of-flight-secondary-ion mass spectrometry (TOF-SIMS) images from fresh-frozen and freeze-dried skeletal muscle section. Images for (a, b) palmitoleic acid, (c, d) palmitic acid, (e, f) linolenic acid, (g, h) oleic acid, and (i, j) stearic acid from (a, c, e, g, i) lean wild-type C57/BL6 mice and (b, d, f, h, j) obese ob/ob mice are presented in a color scale from black to red to bright yellow. Higher brightness corresponds to higher signal intensities. Overlay TOF-SIMS images of oleic (red) and stearic acids (green) are shown in k and l. The region-of-interest (ROI) analysis: selected cells containing high amount of (m, n) oleic (red) or stearic (green) acids and (o, p) ratios of oleic acid over stearic acid. Images for (q, r) Na+, (s, t) K+, (u, v) phosphocholine, (w, x) cholesterol, and (y, z) total diacylglycerols (Tot DAG) from (q, s, u, w, y) lean wild-type C57/BL6 mice and (r, t, v, x, z) obese ob/ob mice are presented in a color scale from black to red to bright yellow. Higher brightness corresponds to higher signal intensities. Total counts (tc) correspond to the total ion signal from the specified ion. Maximum counts (mc) correspond to the maximal number of counts in a pixel. The field of view is 249 × 249 µm2.
Low Na+ and high K+ signal intensities were observed in both the ob/ob and wild-type mice (7). Low Na+ and high K+ concentrations are markers for the internal cell milieu in an intact cell (21). Moreover, bright Na+ signals appeared as dots located outside skeletal muscle cells, most likely corresponding to blood vessels. Signal from phosphocholine (m/z 184) was located at the edge of the skeletal muscle fiber (7), corresponding to the muscle plasma membrane (sarcolemma), and to blood vessels outside the muscle cell. Cholesterol (m/z 369) signal intensities were very low in both the ob/ob and wild-type mice (7). DAG signals, widely scattered within skeletal muscle fibers, were higher in the ob/ob mice (7) than in the wild-type mice (7).
Discussion
In the present study we investigated the possibility of using TOF-SIMS as a new method for detecting lipid changes in the skeletal muscle associated with obesity. Our data showed that the signal intensities of FA and DAG ions in the skeletal muscle were significantly higher in the obese ob/ob mice than in the lean wild-type mice. Moreover, ROI analysis showed that FA signal intensities within the muscle cell were significantly increased in ob/ob mice as compared with the lean wild-type mice. Thus, by using imaging TOF-SIMS, we were able to detect intramyocellular lipid changes in the obese ob/ob mice.
The observed increased FA signal intensities in the skeletal muscle of the ob/ob mice were mainly due to the increased MUFA signals, and to a less extent to the increased PUFA signals, whereas the saturated FA signals were similar between two groups. These results are in agreement with earlier studies that have shown increased FA deposits in tissues of ob/ob mice (22,23,24,25,26,27,28) and, in addition, that MUFA is increased in ob/ob mice, mainly due to the increased palmitoleic acid (22,24). Interestingly, increased C16:1 has been found in children with abdominal adiposity (29). Moreover, increased MUFA concentrations in muscle phospholipids are positively correlated with fasting insulin concentrations and IR (30). One of the reasons for the MUFA accumulation can be the increased stearoyl-CoA desaturase-1 activity, a rate-limiting enzyme catalyzing the MUFA synthesis (31). Moreover, it has been shown that in obese humans elevated stearoyl-CoA desaturase-1 expression in skeletal muscle contributes to abnormal FA partitioning, which means increased intramyocellular triacylglycerol synthesis and reduced β-oxidation in skeletal muscle (32).
In this study, we observed that the C18:2/C18:1 ratio was decreased in the skeletal muscle of the obese ob/ob mice when compared with the lean wild-type mice. In line with this, decreased proportion of C18:2 has been reported previously in obese adults (33) and obese adolescents with metabolic syndrome (34), and may contribute to the development of IR and type 2 diabetes. We also found that the C20:4/C20:3 ratio was increased in the skeletal muscle of the obese ob/ob mice. The increased C20:4/C20:3 ratio and its relation to obesity and IR are controversial because both increment and decrement have been reported in obese subjects (35,36).
Interestingly, the changed FA composition was also reflected in the ratio of different DAGs and PCs that contain different FA residues. We observed a reduced relative abundance of DAGs and PCs with PUFA chains and an increased relative abundance of DAGs and PCs with MUFA chains in the skeletal muscle of the ob/ob mice when compared with the lean wild-type mice. These changes may contribute to the decreased insulin sensitivity reported in the ob/ob mice because decreased abundance of PUFA in skeletal muscle phospholipids can lead to changes in the membrane fluidity (37) and, therefore, changed insulin actions (38).
We also detected increased DAG signals in the skeletal muscle of the obese ob/ob mice when compared with the lean wild-type mice. Because the DAG signal can originate from fragmentation of triacylglycerol, it is not possible to conclude whether the increased DAG signal is in fact due to an increased DAG concentration in the tissue. An increased DAG concentration would be in agreement with an earlier study that showed increased DAG in the skeletal muscle of the ob/ob mice (39). The increased DAG may contribute to IR by the activation of protein kinase C family (40,41).
To semiquantify ion intensities of TOF-SIMS spectra is still controversial, largely due to different factors that can influence ion intensity, such as chemical composition of sample matrix, topography, matrix-primary ion interactions, instrumental transmission, and detector response (42). Moreover, an internal standard of known concentration is difficult to achieve for tissue preparations because the concentration of analyte molecules at the very surface must be known, and, typically, we only know the bulk concentration of a reference sample. To reduce this problem, the analysis was to a large extent done on peak ratios between similar ions, and ion intensities of individual peak were normalized to the total ion count. The normalization can reduce topography-induced intensity differences between the individual spectra (43). Moreover, the topographic effect was considered as low due to the microtome sectioning that makes the sample surface smooth. The total ion image revealed no major influence of topographic features. This is supported by the fact that similar results were obtained even without normalizing individual peaks with total ion counts (data not shown).
The TOF-SIMS images also showed increased signal intensities from FAs and DAGs in the skeletal muscle of the obese ob/ob mice when compared with the lean wild-type mice, thus confirming the results obtained from the comparisons of TOF-SIMS spectra. Moreover, we found that the C16:0 and C18:1 signals were higher in some muscle fibers, whereas the C18:0 signal seemed to be higher in other fibers. Oxidation of C18:0 has been shown to be significantly less than that of C18:1 in both the fed and fasted states (44). It is intriguing to speculate that C16:0 and C18:1 may be located to the oxidative type-1 fiber whereas C18:0 is located to the type 2 fiber.
In summary, by using imaging TOF-SIMS, we were able to demonstrate increased FA and DAG signal intensities in the skeletal muscle of the obese ob/ob mice as compared to the lean wild-type mice. These changes were revealed through a global analytical approach, namely, PCA of peak intensities in TOF-SIMS spectra. Moreover, analysis of the ratio of FA, DAG, and PC peaks revealed changes in saturated FA, MUFA, and PUFA, in agreement with previously reported results. Thus, imaging TOF-SIMS together with PCA of TOF-SIMS spectra is a promising tool for studying lipid changes associated with obesity.
Acknowledgment
We thank Dr Wallenius for providing ob/ob mice. This study was supported by the Swedish National Research Council, the Medical Society of Gothenburg, the Swedish Medical Society, Sahlgrenska University Hospital, and the Swedish Agency for Innovation Systems (VINNOVA).
Disclosure
The authors declared no conflict of interest.


