Differentiation of atrial tachycardia from other long RP tachycardias by electrocardiographic characteristics
Abstract
Background
The incidence and electrocardiographic characteristics of atrial tachycardia (AT) among long RP tachycardias have not been fully elucidated.
Methods and results
Thirty-six patients with 37 long RP tachycardias were classified as having AT (n=23) or non-AT (n=14). We analyzed the electrocardiographic features, including the ratio between the RP and PR intervals (RP/PR ratio), P-wave morphology, and P-wave duration. The RP/PR ratio was higher in AT than in non-AT (2.01±0.54 vs. 1.57±0.24, P<0.001). A negative P wave in the inferior leads was less common in AT (4/23 vs. 13/14, P<0.01). The P-wave duration was longer in AT than in non-AT (105±13 ms vs. 84±10 ms, P<0.001). The fulfillment of any 2 of the following had a specificity and a positive predictive value of 100% for AT: RP/PR ratio of ≥1.65, absence of negative P wave in the inferior leads, or a P-wave duration of >96 ms.
Conclusion
AT accounted for nearly two thirds of long RP tachycardias in this cohort. Electrocardiographic features, including the RP/PR ratio, polarity of the P wave, and P-wave duration were useful in the differentiation of AT.
1 Introduction
Long RP tachycardia is an uncommon form of supraventricular tachycardia (SVT) that exhibits a longer RP interval than PR interval on 12-lead electrocardiograms (ECG). The differential diagnosis of a long RP tachycardia includes the uncommon form of AV nodal reentrant tachycardia (AVNRT), the permanent form of reciprocating tachycardia (PJRT), and atrial tachycardia (AT). AT accounts for majority of long RP tachycardia cases [1], [2]. In addition, although there are some P-wave features associated with differential diagnosis, we are unaware of studies giving clear numeric guidelines that can differentiate AT from other tachycardias. Therefore, the aim of the present study was to investigate the incidence and electrocardiographic features of long RP tachycardias.
2 Methods
2.1 Study subjects
The study population comprised a consecutive series of 298 patients (49% male; mean age, 51±18 years) who underwent electrophysiological (EP) study for SVT at the Tokyo Medical and Dental University between January 2006 and August 2011. Twelve-lead ECGs were selected for inclusion in this study if they met the following criteria: regular tachycardia at a rate of ≥100 bpm and long RP tachycardia. A tachycardia was defined as long RP if the interval from the R wave to the next P wave was longer than the interval from that same P wave to the next R wave (RP/PR>1) during the tachycardia on 12-lead ECG. Of the 298 patients, 36 (12% of 298 patients; 20 men; mean age, 55±17 years) with 37 long RP tachycardias satisfied the above criteria. Patients with long RP tachycardia were divided into 2 groups on the basis of the results of the EP study: patients with AT (n=23) and patients with uncommon AVNRT or PJRT (non-AT) (n=14). The incidence of AT among long RP tachycardia cases, and the ECG features differentiating AT from other tachycardias, were examined.
2.2 Electrophysiological study
All patients underwent an EP study and catheter ablation after providing written informed consent. Patients were studied in the fasting awake state without sedation. All antiarrhythmic drugs were discontinued for a minimum of 5 half-lives prior to the EP study. The EP study included an assessment of sinus cycle length, and atrial and atrioventricular (AV) conduction properties. Overdrive pacing and extrastimuli from both the right atrium and ventricle were performed to induce the tachycardia. If these procedures failed to induce the tachycardia, or if the tachycardia was not sustained (i.e., <30 s with spontaneous termination), intravenous isoproterenol was administered (1–3 µg/min), and repeat pacing was performed to induce the tachycardia. Standard electrophysiologic criteria were used to diagnose focal AT; these included the inability to demonstrate entrainment at 2 locations in the circuit of the tachycardia that were 2 cm apart [3]. The origin of focal AT was assessed by point mapping performed with an ablation catheter to locate the site of earliest endocardial activation relative to a fiducial point on a stable intracardiac electrode. The site of successful ablation was defined as the origin of focal AT. Uncommon AVNRT is defined as tachycardia in which the fast pathway serves as the anterograde limb of the circuit, whereas the slow pathway is the retrograde limb (i.e., fast–slow AVNRT) in an EP study [1]. Electrophysiologic criteria for the diagnosis of PJRT include the following: transient interruption of PJRT by programmed stimulation with resumption of tachycardia after a few sinus beats; either advancement or delay of the atrial electrogram with an identical atrial activation sequence during PJRT via ventricular extrastimulus when the His bundle is refractory; atrial activation sequence during ventricular pacing that is identical to the pattern during tachycardia; and no anterograde conduction through the accessory pathway, but slow and decremental retrograde conduction through the accessory pathway [4].
2.3 Electrocardiographic assessment of long RP tachycardia
The following 3 ECG features of long RP tachycardia were assessed: (1) the ratio between the RP interval and the PR interval (RP/PR ratio); (2) P-wave morphology; and (3) P-wave duration during the tachycardia. The RP interval was measured from the onset of the R wave to the onset of next P wave, whereas the PR interval was measured from the onset of the P wave to the onset of next R wave. The P-wave duration was measured from the onset of the P wave to its end (Fig. 1). A negative P wave in the inferior leads is frequently observed in uncommon AVNRT and PJRT, and thus, we compared the incidence of a negative P wave in the inferior leads between the AT and non-AT groups. A negative P wave in the inferior leads was defined as a P wave in which the first component was negative and greater in magnitude than the positive component in all of the inferior leads (i.e., II, III, and aVF; Fig. 2). Furthermore, the incidence of a positive P wave in leads I, aVL, and V1 was compared between the AT and non-AT groups. A positive P wave was defined as a P wave in which the first component was positive and greater in magnitude than the negative component. Since the P-wave duration may differ in AT according to the site of AT origin and the atrial conduction time [5], we also compared P-wave duration between the AT and non-AT groups. All of the parameters, including the RP and PR intervals and the P-wave duration, were analyzed using ECG recordings from lead II in all patients. Since the onset of the P wave occurs from the end of the T wave, the P-wave duration and the polarity of the P wave is sometimes indistinct in patients with long RP tachycardia; we took an average of measurements taken by 3 observers who were blinded to the diagnosis of long RP tachycardia. The presence of a negative P wave was assessed by consensus of more than 2 out of 3 observers. The statistical significance of interobserver differences in RP/PR ratio, P-wave duration, and the incidence of P wave was assessed. The 12-lead ECG was recorded at a paper speed of 25 or 50 mm/s and a gain setting of 10 mm/mV. The ECGs were stored in a computer-based digital amplifier/recorder system (Labsystem Pro, Bard EP, Lowell, MA, USA) and assessed by 3 observers.
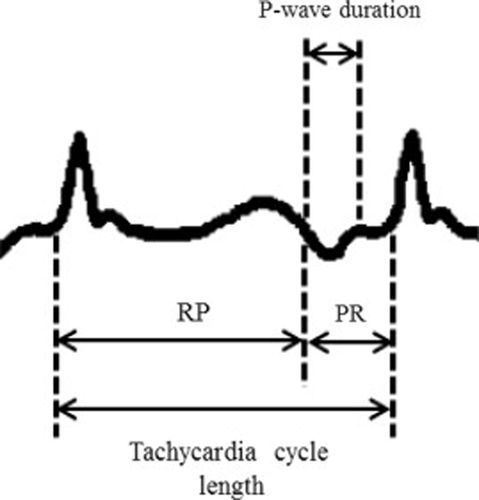
Measurement of the RP interval, PR interval, and P-wave duration in 12-lead ECG.
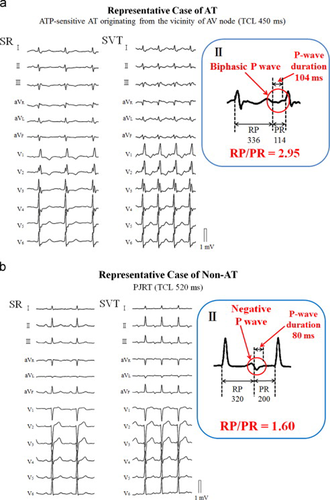
Twelve-lead ECG from a patient with typical features of atrial tachycardia (a) and 1 with a permanent form of junctional reciprocating tachycardia (b).
2.4 Statistical analysis
Continuous variables are expressed as mean±standard deviation. Comparisons between groups were performed using Student's t-test or the Wilcoxon rank-sum test, as appropriate. For categorical data, Fisher's exact test was applied. The RP/PR ratio and the P-wave duration were compared between the AT and non-AT groups, and cutoff values were assessed. The optimal cutoff point was chosen as the combination with the highest sensitivity and specificity using the receiver–operator characteristic (ROC) curve in each group. Interobserver differences in the RP/PR ratio and P-wave duration between 3 observers were assessed with the Kruskal–Wallis test. Interobserver differences in P-wave polarity were analyzed by Fisher's exact test. All statistical analyses were performed using commercially available computer software (JMP version 9, SAS Institute Japan, Tokyo).
3 Results
Among 36 patients with 37 long RP tachycardias, there were 22 patients with 23 ATs (62%) and 14 patients with 14 non-ATs (10 uncommon AVNRTs and 4 PJRTs). Age, sex, and AV Wenckebach cycle length at baseline in the EP study were not significantly different between the 2 groups (Table 1). Tachycardia cycle length had a tendency to be longer in AT patients (p=0.06). Among the 23 ATs, all but 1 was a focal AT, whereas the remaining AT cases were macro-reentrant AT. The locations of the 22 focal ATs were right atrial in 18 of 22 (82%) cases, and left atrial in 4 of 22 (18%) cases. Right atrial sites included the crista terminalis (n=6), right septum (n=5), tricuspid annulus (n=3), coronary sinus ostium (n=2), in proximity to the sinus node (n=1), and the superior vena cava (n=1). Left atrial sites included the posterior wall (n=2), ostium of the right pulmonary vein (n=1), and the left atrial appendage (n=1). In the 4 patients with PJRT, the retrograde decremental accessory pathway was located in the right (n=3) and left posteroseptal regions (n=1). In 7 out of 37 long RP tachycardias (19%), intravenous isoproterenol infusion was administered to induce the tachycardia in 4 patients with AT and 2 with non-AT (18% vs. 14%, P=1.00). Catheter ablation was successfully performed in all patients with both AT and non-AT with no complications. However, 1 patient with AT and 2 non-AT patients had recurrence of arrhythmia after catheter ablation (P=0.544). The procedure times were 168±55 min in the AT group and 175±59 min in the non-AT group (P=0.76). Fluoroscopic times were 50±27 min in the AT group and 45±22 min in the non-AT group (P=0.73).
| AT (n=23) | Non-AT (n=14) | P-value | |
|---|---|---|---|
| Age (years) | 57.5±18.2 | 51.7±13.6 | 0.28 |
| Male gender (%) | 13 (57) | 7 (50) | 0.74 |
| Tachycardia cycle length (ms) | 443±99 | 384±65 | 0.06 |
| AV Wenckebach cycle length (ms) | 346±72 | 334±48 | 0.60 |
| RP interval | 293±75 | 234±45 | 0.01 |
| PR interval | 153±45 | 150±25 | 0.79 |
| RP/PR ratio | 2.01±0.54 | 1.57±0.24 | <0.01 |
| Negative P wave in inferior leads (%) | 4 (17) | 13 (93) | <0.01 |
| P-wave duration (ms) | 105±13 | 84±10 | <0.01 |
- AT=atrial tachycardia; AV=atrioventricular. ECG parameters were measured from 12-lead ECG during the EP study.
3.1 RP/PR ratio
The RP/PR ratio was higher in the AT than in the non-AT group (Table 1 and Fig. 3a; 2.01±0.54 vs. 1.57±0.24, P<0.01). The RP/PR ratios in the AT group measured by 3 observers were 2.04, 1.98, and 2.01 (P=0.98). The RP/PR ratios in the non-AT group measured by 3 observers were 1.57, 1.52, and 1.60 (P=0.71). Interobserver differences in the RP/PR ratio were not significant in both the AT and non-AT groups. For the association between RP/PR ratio and AT, the area under the curve (AUC) was found to be 0.7485 (Fig. 3b). The optimal cutoff value for the sensitivity and specificity of the RP/PR ratio predicting AT was 1.65 (sensitivity, 65%; specificity, 64%; positive predictive value, 75%).
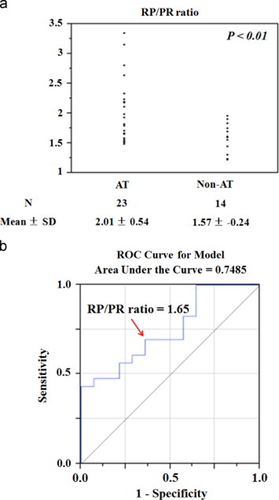
(a) RP/PR ratio in long RP tachycardia ECGs from patients with and without atrial tachycardia (AT). Mean±standard deviation (SD) of the RP/PR ratio are shown. (b) Receiver–operator characteristic (ROC) curve analysis of the RP/PR ratio and AT. The optimal cutoff value (red arrow) is shown.
3.2 P-wave morphology
A negative P wave in the inferior leads was observed less frequently in the AT group than in the non-AT group (4/23 vs. 13/14, P<0.001; Table 1). The incidences of negative P wave in the inferior leads reported by 3 observers were 4/23, 3/23, and 4/23 in the AT group (P=0.90). In the non-AT group, the incidences of negative P wave reported by 3 observers were 13/14, 13/14, and 12/14 (P=0.76). Interobserver differences in the incidence of negative P wave were not significant in either the AT or non-AT groups. The origin of 4 patients in the AT group with negative P wave were the right septum (n=2) and the coronary sinus ostium (n=2). The incidence of positive P wave in lead I (3/23 vs. 6/14, P=0.06), aVL (8/23 vs. 4/14, P=1.00), and V1 (6/23 vs. 7/14, P=0.17) were not different between the AT and non-AT groups.
3.3 P-wave duration
The P-wave duration during tachycardia was greater in the AT group than in the non-AT group (Table 1 and Fig. 4a; 105±13 ms vs. 84±10 ms, P<0.001). The P-wave durations in the AT group measured by 3 observers were 109, 103, and 104 ms (P=0.66). The P-wave durations in the non-AT group measured by 3 observers were 82, 86, and 84 ms (P=0.44). Interobserver differences in the P-wave duration were not significant in either the AT or non-AT group. For the association between P wave duration and AT, the AUC was found to be 0.9224 (Fig. 4b). The optimal cutoff value for the P-wave duration to predict AT was 96 ms (sensitivity, 78%; specificity, 93%; positive predictive value, 95%).
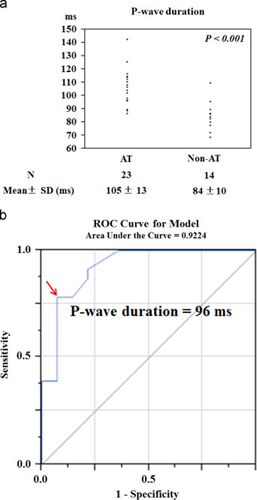
(a) P-wave duration in long RP tachycardia ECGs from patients with and without atrial tachycardia (AT). Mean±standard deviation (SD) of the P-wave duration is shown. (b) Receiver–operator characteristic (ROC) curve analysis of P-wave duration and AT. The optimal cutoff value (red arrow) is shown.
3.4 Sensitivity, specificity, and positive predictive value of electrocardiographic features
Table 2 summarizes the sensitivity, specificity, and positive predictive value of the ECG features that differentiated the AT group from the non-AT group using the optimized cutoff values determined from the individual receiver operating characteristic (ROC) curves as described above; i.e., RP/PR≥1.65, absence of negative P wave in the inferior leads, and P-wave duration of >96 ms. Table 2 also presents the sensitivity, specificity, and positive predictive value for all possible combinations of these 3 parameters. The presence of any more than 2 of the 3 features provided both a specificity and positive predictive value of 100% for AT.
| Sensitivity (%) | Specificity (%) | PPV (%) | |
|---|---|---|---|
| (1) RP/PR ratio ≥1.65 | 65% (15/23) | 64% (9/14) | 75% (15/20) |
| (2) Absence of negative P wave in the inferior leads | 83% (19/23) | 93% (13/14) | 95% (19/20) |
| (3) P-wave duration ≥96ms | 78% (18/23) | 93% (13/14) | 95% (18/19) |
| (1) and (2) | 57% (13/23) | 100% (14/14) | 100% (13/13) |
| (1) and (3) | 57% (13/23) | 100% (14/14) | 100% (13/13) |
| (2) and (3) | 70% (16/23) | 100% (14/14) | 100% (16/16) |
| (1), (2), and (3) | 43% (10/23) | 100% (14/14) | 100% (10/10) |
- PPV=positive predictive value.
4 Discussion
The main findings were as follows: (1) AT accounted for nearly two thirds of long RP tachycardia; (2) the RP/PR ratio was higher in the AT group than in the non-AT group; (3) a negative P wave in the inferior leads was observed less frequently in the AT group; (4) the P-wave duration during tachycardia was longer in the AT group; (5) the combination of any 2 ECG features (including RP/PR≥1.65, absence of negative P wave in the inferior leads, and P-wave duration >96 ms) had a specificity and positive predictive value of 100% for AT.
4.1 Incidence of AT among long RP tachycardia
Although AT generally exhibits long RP tachycardia [1], [2], the incidence of AT among patients with long RP tachycardia has not been fully clarified. There is 1 study in the literature that reported that 89% of ATs presented as long RP tachycardia [6], but that does not equate to a majority of long RP tachycardia cases being AT. Our results demonstrate that AT is a major cause of long RP tachycardia.
4.2 RP/PR ratio
In the present study, the RP/PR ratio of 2.01 in the AT group was higher compared with that of 1.57 in the non-AT group. Limited data have described the RP/PR ratio in previous studies of patients with AT. We believe our study is the first to quantify the RP/PR ratio in patients with AT and demonstrate that the RP/PR ratio is higher in patients with AT than in patients with uncommon AVNRT or PJRT. According to previous reports, the RP/PR ratios in patients with PJRT and uncommon AVNRT were 1.63–1.89 [7]-[9], which is similar to the results of this study. We believe electrophysiological factors underlie the high RP/PR ratio in patients with AT. The relationship between higher heart rate and correspondingly shorter PR intervals affects the RP/PR ratio [10]. A higher steady-state heart rate leads to a shorter PR interval. Carruthers et al. provide a numerical description of this negative linear correlation over the range of heart rates of 60–160 bpm in a recent study [11]. In the present study, the mean AT heart rate was 132 bpm (454 ms), which is within the range of heart rates at which the negative linear correlation is present. A faster AT heart rate would cause an atrioventricular (AV) block. AT with a heart rate of <160 bpm sustained a short PR interval irrespective of the sites of AT origin, which maintained the high RP/PR ratio.
4.3 Negative P wave in the inferior leads
Negative P wave was frequently observed in non-AT patients. In line with previous studies [12], the P-wave polarities in the inferior leads were negative in most cases of the uncommon form of AVNRT. Moreover, the P-wave morphologies in the inferior leads were negative in all patients with PJRT whose retrograde decremental accessory pathways were located in the right and left posteroseptal areas, which was consistent with the results of previous studies [7], [13], [14]. On the other hand, AT originating from higher locations in the atrium generally produces positive or biphasic P waves in the inferior leads [15], [16]. In the present study, there were a variety of focal AT origins reflected by various P-wave morphologies. Importantly, a negative P wave was observed in some patients with AT originating from the inferior part of atrium, which suggested that the presence of negative P wave could not solely differentiate non-AT from AT.
4.4 P-wave duration
The P-wave duration during tachycardia was significantly longer in patients with AT than those without AT in this study. Although there have been no studies evaluating P-wave duration in patients with PJRT and uncommon AVNRT, 1 previous study evaluated P-wave duration in AT. Marrouche et al. reported that P-wave duration during AT originating from the left septal atrium was shorter than the P-wave duration during the sinus rhythm (82 ms vs. 115 ms, P<0.05) [5]. They speculated that tachycardia originating from a septal focus had ready access to both the right and left atrium over interatrial connections such as Bachman's bundle, the region of the fossa ovalis, and the CS—resulting in narrow P-wave duration during AT. In the present study, 78% of ATs originated away from the atrial septum, which may be why the AT group exhibited longer P waves. In contrast, all of the non-ATs propagated from the atrial septum, resulting in a narrow P-wave duration.
4.5 Clinical implication
The results of the present study have several clinical implications. First, high RP/PR ratio, absence of negative P wave in the inferior leads, and a broad P-wave duration in 12-lead ECG are suggestive of AT. Moreover, if any 2 of these 3 features are present, the tachycardia can be diagnosed as AT with high accuracy. There was a certain amount of overlap in the range of measurements of RP/PR ratios and P-wave durations in patients with AT and non-AT, suggesting that these parameters may not be precise enough to differentiate AT from other tachycardias as the sole parameter. Therefore, the results of this study—demonstrating the diagnostic high accuracy of combinations of these parameters—had clinical significance. Secondly, the 12-lead ECGs were analyzed on a computer-based digital amplifier/recorder system that is only available in the EP study. The measurements of the RP/PR ratio and P-wave duration in surface ECG may differ in clinical practice. Again, because we demonstrated that the specificity for AT increased when any 2 of the electrocardiographical features were present, we believe that the specificity for AT would not decrease by using surface ECG. Third, the results of this study would help guide the decision to use 3D electroanatomical mapping systems before EP study and catheter ablation to achieve efficient procedural success in patients with AT [17], [18].
4.6 Limitations
First, our study was small, retrospective, and an observational cohort study. It is premature to construct an algorithm to differentiate AT from other tachycardias. Prospective studies with large numbers of patients with long RP tachycardia are required to validate our results. Second, there were difficulties in identification of the onset and duration of the P wave during tachycardia in some patients. Although we took an average of the measurements determined by 3 observers to minimize the interobserver difference in this study, the RP/PR ratio and P-wave duration in such patients may vary by observer in clinical practice. Third, the tachycardia cycle length was longer in the AT group than in the non-AT group, which may affect the difference in the RP/PR ratio. Fourth, intravenous isoproterenol was used to induce tachycardia in 16% of patients. Isoproterenol may have had some effect on both the RP and the PR intervals. The present study focused on the relationship between the RP and PR intervals during the tachycardia. There were reports that isoproterenol has an equivalent effect on both the PR and RP intervals [19]. Furthermore, Tseng et al. demonstrated that the response to isoproterenol was similar between different age groups [20]. In addition to the fact that the number of the patients who required isoproterenol was similar between AT and non-AT patients (P=1.00), we believe that the results would not be affected by isoproterenol. Fifth, we regard the P-wave duration in AT as being diverse and related to the location of the AT origin. Due to insufficient number of patients with AT, we did not have sufficient statistical power to assess differences in P-wave duration in patients with AT originating from the atrial septum and other areas. This is a subject of future study. Finally, sensitivity using any 2 of the 3 AT ECG features highlighted in this study ranged from 57% to 70%. Therefore, the absence of these features does not exclude AT.
5 Conclusion
AT accounted for nearly two thirds of long RP tachycardia cases. Electrocardiographic features, including high RP/PR ratio, absence of negative P wave in the inferior leads, and broad P-wave duration, were indicative of AT and useful in differentiating AT from other tachycardias presenting with long RP.
Conflict of interest
There are no financial or other relationships leading to a conflict of interest.
Acknowledgments
The work originated from Tokyo Medical and Dental University.


