The extent of myocardial damage assessed by contrast-enhanced MRI is a major determinant of N-BNP concentration after myocardial infarction
Abstract
Aims:
To evaluate the relationship between N-terminal Pro-Brain Natriuretic Peptide (N-BNP) level and contrast-enhanced MRI in patients after acute myocardial infarction (MI).
Methods:
Eighty-two patients were studied. Venous blood samples were obtained 3 days after MI and MRI was performed from 2 to 7 days after MI, with determination of left ventricular function and acquisition of perfusion data after injection of gadolinium-DTPA. First-pass images (FPI) and Delayed contrast-enhanced (CE) images were analyzed using a 17-segment model, and the extent of transmurality was determined by a visual score.
Results:
Univariate analysis showed that age (P<0.001), sex (P<0.02), Left Ventricular Ejection Fraction (LVEF) <45% (P<0.002), creatinine (P<0.05) and delayed CE-MR images (P<0.006) were predictors of a supramedian N-BNP level. FPI was not a predictor in this univariate analysis (P<0.078). In a multivariate model, only age, LVEF <45% and delayed CE-MRI were associated with an increased N-BNP level.
Conclusion:
After MI, high N-BNP levels are dependent on the LVEF but also on the myocardial infarct size derived from the delayed CE-MR images.
1. Introduction
Reperfusion therapy has significantly improved survival after acute myocardial infarction, but it is clinically difficult to evaluate the efficacy of reperfusion, and thus the extent of non-viable myocardial tissue. In most of cases, myocardial perfusion and metabolism are abnormal despite restoration of a TIMI 3 flow 1. The extent of non-viable myocardial tissue could play a major role in long-term morbidity and mortality after myocardial infarction (MI).
Brain natriuretic peptide (BNP) and the N-terminal fragment of its prohormone, N-terminal pro-brain natriuretic peptide (N-BNP), have provided valuable prognostic information on short and long term mortality in patients with acute coronary syndrome 2,3. A recent work has suggested that the BNP level could also be linked to coronary artery disease and the extent of myocardium at risk 4.
Contrast-enhanced magnetic resonance imaging (CE-MRI) with a gadolinium-based contrast agent can quantitatively assess the extent of myocardial necrosis with transmural resolution, first pass perfusion providing assessment of the extent of microvascular damage. The objective of the present study was to examine the relationship between N-BNP level and the extent of myocardial damage assessed by contrast-enhanced MRI in patients after acute MI.
2. Methods
2.1. Patient population
We studied 82 patients (57 men and 25 women, mean age 59±14 years), hospitalized in our department for a first acute myocardial infarction (MI), diagnosed by increased serum MB fraction of creatine kinase (CK-MB) level or troponin (I or T, typical rise and gradual fall) at least twice that of the normal laboratory level, acute chest pain, characteristic electrocardiographic changes (pathologic Q waves, or ST segment elevation or depression, on at least two derivations), and angiographically demonstrated partial or complete occlusion of the related artery (TIMI 0 or 1) with restoration of a TIMI 3 flow. These criteria are in line with the new redefinition of MI by the European Society of Cardiology and the American College of Cardiology 5. To be included, patients had to be hemodynamically stable and have no contraindication to MRI. The Ethics Committee approved the study protocol and all participants gave written consent before entering the study.
2.2. Data collection
Demographic data, cardiovascular risk factors and history were collected as well as admission data (killip class, ECG and hemodynamic parameters).
2.3. Laboratory analysis
Blood samples were collected in EDTA (ethylenediamine-tetraacetic acid) containing tubes at 3 days after admission and stored at −20 °C until analysis (<3 days). Plasma N-BNP was determined using Elecsys N-BNP sandwich immunoassay on an Elecsys 2010 (Roche). The inter and intra assay coefficients of variation were <3.1% and the sensitivity of the assay was found to be 0.6 pmol/l. The cross reactivity with other natriuretic peptides (BNP, ANP and CNP) was <0.01%. The minimum and maximum quantities detectable ranged from 2.4 to 4130 pmol/l
2.4. MRI protocol
All patients were explored 2–7 days after MI. MRI was performed on a 1.5 T whole-body MR imager (Siemens, Magnetom Vision, GmbH, Erlangen, Germany), using a breath-hold technique and a phased array body coil. Coronal and left ventricular (LV) long-axis scout images were obtained to determine the orientation of the LV short axis imaging plane.
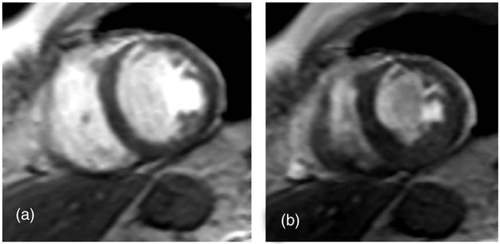
For LV function evaluation, cine-MRI was performed using an ECG-gated gradient echo sequence, with the following acquisition parameters; repetition time (TR) 9 ms, echo time (TE) 4.4 ms, pulse flip angle 15°, nine lines per segment, field of view (FOV) of 350–470 mm (Fig. 1). The acquisition matrix varied from 108×256, (12 cardiac cycles), to 144×256, (16 cardiac cycles), depending on the ability of patient to hold his breath 6. A series of short-axis slices (5-mm thick, 15 mm apart) was defined from the base of the heart to the apex. The position of the heart was taken into account at end-systole and end-diastole times. A temporal resolution of 50 ms was obtained with the ‘view-sharing’ technique 7.

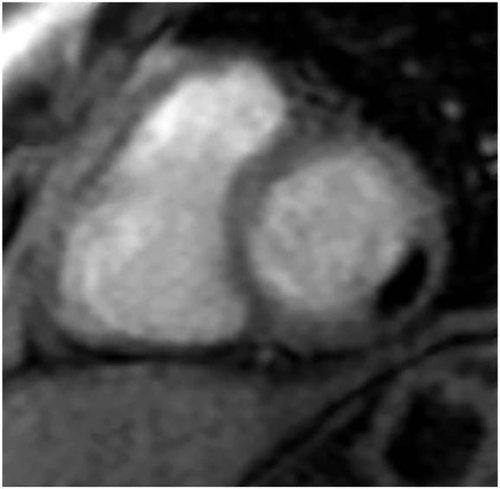
For LV perfusion evaluation, a first-pass ECG-gated gradient echo sequence was performed (turboFLASH sequence in T1-weighting), after manual injection of a bolus of gadolinium-DTPA (Magnevist) in a brachial vein at 0.1 mmol/kg with the following parameters; inversion time (TI) 400 ms, repetition time (TR) 3.5 ms, echo time (TE) 1.7 ms, FOV 400–470 mm, and matrix 96×128. A time delay buffer at the end of the sequence was adjusted in order to acquire one image every two cardiac cycles (Fig. 2). Three to five short-axis slices (12-mm thick, 3 mm apart) are obtained from the base of the heart to the apex 8.

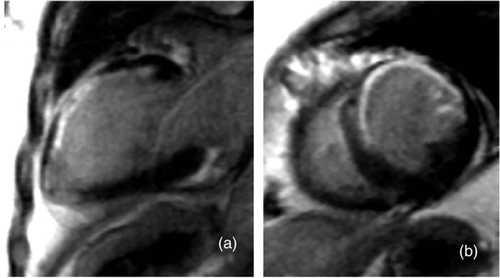
Ten minutes after bolus injection, delayed images were acquired using a segmented T1-weighted inversion-recovery turboFLASH sequence (Fig. 3) 9, with a variable TI delay adjusted for each studied patient 10. The TI was adjusted to obtain an optimal myocardial nulling by varying the TI from 250 to 400 ms. The chosen TI ranged between 250 and 350 ms.

2.5. MRI data analysis
A 17-segment model was used for data analysis of cine-MRI and perfusion studies 11. Left ventricular end-diastolic volume (EDV) and end-systolic volume (ESV) were calculated from short-axis views 6. Left ventricular ejection fraction (LVEF) was calculated with the following formula: LVEF=(EDV−ESV)/EDV.
For each patient, perfusion data were analyzed and a visual score was attributed by two observers. Two scores were also given based on the signal intensity observed on early images (First-pass images: FPI) for 16 segments (the apical segment was not evaluated on early images, because no long axis slices were obtained) and late images (delayed perfusion CE images, 10 min after injection) for each of the 17 segments (vertical and horizontal long-axis slices allows the evaluation of the apical segment). Early regional hypoenhancement and late regional hyperenhancement were scored independently of wall motion with a scheme based on the transmural extent of contrast-enhanced tissue within each segment (0=no hypo or hyperenhancement; 1=1–25% hypo or hyperenhancement; 2=26–50% hypo or hyperenhancement; 3=51–75% hypo or hyperenhancement; 4=76–100% hypo or hyperenhancement). The two scores, FPI and delayed CE images, were determined by the sum of the scores of all the segments (16 for FPI, 17 for CE). Thus, the scores ranged from 0 to 64 for FPI, and from 0 to 68 for CE images.
2.6. Statistical analysis
Continuous data were expressed as mean values±S.D. and dichotomous data as percentages. Quantitative parameters were compared by the Kruskal–Wallis one-way analysis of variance on ranks. To analyse the relation between N-BNP levels and other parameters, patients were subdivided according to the median value of N-BNP 2. The logistic regression model was chosen to assess the univariate relation between the variables. The test variables were: age, sex, Killip class >1, creatinine level, troponin level, creatine kinase (CK) and CK-MB level, end systolic volume, end diastolic volume, left ventricular ejection fraction, sum of the first pass image score and sum of the delayed contrast-enhanced image score. Multivariate analysis was performed and matched for sex and age, when univariate analysis showed a P<0.05. A P value <0.05 was considered to be significant.
3. Results
Median plasma level of N-BNP was 142 pmol/l. The characteristics of the patients, subdivided according to this median level, are listed in Table 1.
| Total | BNP<median | BNP>median | P | |
|---|---|---|---|---|
| Age (years) | 59±14 | 53±12 | 64±14 | <0.001 |
| Body mass index kg/m2 | 26±4 | 26±3 | 26±5 | NS |
| End systolic volume (ml) | 70±35 | 63±30 | 77±39 | NS |
| End diastolic volume (ml) | 142±50 | 143±52 | 141±48 | NS |
| LVEF (%) | 51±13 | 56±11 | 47±13 | <0.01 |
| Sum of the FPI score | 6.54±6.41 | 5.20±6.01 | 7.78±6.61 | NS |
| Sum of the delayed CE score | 14.44±10.02 | 11.15±8.30 | 17.56±10.60 | <0.01 |
| CK (UI/l) | 2874±2467 | 2045±1812 | 3703±2763 | <0.01 |
| CK-MB (IU/l) | 260±211 | 193±152 | 327±241 | <0.01 |
| Creatinine (μmol/l) | 89±22 | 84±15 | 95±27 | <0.05 |
| Troponin (μg/l) | 35±14 | 31±15 | 38±11 | <0.05 |
- a FPI: first pass images; CEI: contrast-enhanced images; LVEF: left ventricular ejection fraction.
The infarct localization was anterior in 39 cases (mean N-BNP=426±460), inferior in 38 cases (mean N-BNP=162±160) and lateral in five cases (mean N-BNP=308±266).
In an univariate logistic regression model (Table 2), predictors of N-BNP level >median value were age (P<0.001), sex (P<0.001), LVEF<45% (P<0.01), killip class >1, creatinine (P<0.05), troponin (P<0.05) and delayed CE-MR images (P<0.01). FPI score had no statistical significance.
| Odds ratio | CI (95%) | P | |
|---|---|---|---|
| Sex | 3.733 | 1.281–10.878 | 0.016 |
| Age | 1.072 | 1.033–1.113 | <0.001 |
| LVEF <45% | 5.56 | 1.923–16.046 | <0.002 |
| Killip >1 | 3.392 | 0.98–11.739 | 0.054 |
| End systolic volume | 1.013 | 0.999–1.027 | 0.068 |
| End diastolic volume | 1.000 | 0.991–1.008 | 0.936 |
| Sum of the FPI score | 1.067 | 0.993–1.147 | 0.078 |
| Sum of the delayed CE score | 1.074 | 1.021–1.131 | 0.006 |
| CK | 1.000 | 1.000–1.001 | 0.004 |
| CK-MB | 1.004 | 1.001–1.007 | 0.010 |
| Creatinine | 1.025 | 1.001–1.050 | 0.040 |
| Troponin | 1.039 | 1.004–1.075 | 0.030 |
Multiple logistic regression was undertaken to test for independent prediction of high N-BNP level. In this multivariate model, after adjusting for age and LVEF, delayed CE-MRI was still associated with an increased pro-BNP-level (Table 3).
| Odds ratio | CI (5–95%) | P | |
|---|---|---|---|
| Sex | 3.45 | 0.87–13.63 | 0.077 |
| Age | 1.19 | 1.05–1.19 | <0.001 |
| LVEF <45% | 4.47 | 1.04–19.14 | 0.044 |
| Sum of delayed CE score | 1.15 | 1.04–1.27 | 0.005 |
| Killip >1 | 0.739 | 0.127–4.314 | 0.737 |
| Creatinine | 1.020 | 0.983–1.059 | 0.293 |
4. Discussion
The major finding of the present study is that N-BNP level following MI appears associated not only with LVEF impairment but also with the extent of myocardial damage as assessed by CE-MRI.
Since its initial description by Sudoh et al., most studies have reported the role of BNP, and later, N-BNP as prognosis markers after MI, according to there relation with LVEF and LV remodeling 2,12. Our data are in agreement with previous studies, concerning several known determinants of BNP levels such as LVEF, age and sex 13–20.
After acute coronary syndrome, global hemodynamic changes seem to be involved in increased BNP secretion as well as increased regional ventricular wall stretch 13. These modulations could appear even in the case of minor myocardial damage and some authors recently suggested that the magnitude of the increase in N-BNP may also reflect the extent of the ischemic territory 2,21–23. Talwar et al. demonstrated a significant difference in N-BNP levels between anterior and inferior MI, and a strong relation between N-BNP and echocardiographic assessment of wall motion index early after MI 21.
Our study clearly demonstrates a relationship between N-BNP and delayed CE-MR images, which accordingly has a strong correlation with myocardial infarct size, even early after MI (2–7 days in our study) 10,24.
Extra-cellular contrast-agents accumulate in the myocardium due to increased capillary permeability causing oedema, increased extracellular space and slower kinetics in infarcted regions 25–27. As a consequence, delayed CE images early after MI reflect the sum of necrosis and a border zone of injured myocytes surrounding the acute infarct. Whatever the precise mechanism of contrast accumulation, using electron probe X-ray analysis in the rabbit, it has been shown that regional myocardial elevation in contrast agent is associated with irreversible ischemic injury 24,28. According to the correlation between N-BNP and CE-MRI in our study, the extent of the myocardial damage depicted by CE-MRI could have a direct role in prognosis, even early after myocardial infarction.
The results of the present study demonstrate that hyperenhancement, but not early hypoenhancement, is a predictor of N-BNP level, although early hypoenhancement has been shown to predict late irreversibility and bad prognosis 29–31.
The poorer accuracy of early hypoenhancement may be due to the underestimation of the amount of irreversibly dysfunctional myocardium 31.
Among the limitations of this study, it should be noted that LVEF is a global marker of left ventricular dysfunction and does not reflect the heterogeneity of the regional impairment of the left ventricle in a manner comparable to the gadolinium perfusion scores. Unfortunately, no widely accepted single index reflecting contraction heterogeneity is available to be compared with N-BNP level. Further studies should attempt to define such an index in order to make comparisons possible with perfusion indices.
In conclusion, this study demonstrates the value of delayed CE-MRI studies in initial evaluation of MI, recently after the symptom onset. The ability to combine direct measurement of infarct extent and the study of other prognosis factors (microvascular obstruction, LVEF and left ventricular volumes) illustrate the potential of MRI to define high-risk patients, in combination with N-BNP and clinical factors.
Acknowledgements
This work was supported by the Association de Cardiologie de Bourgogne and by grants from University Hospital of Dijon.


