Skeletal muscle quality predicts overall survival in advanced liver hepatocellular carcinoma treated with SIRT and sorafenib: A subanalysis of the SORAMIC trial
Alexey Surov and Andreas Wienke contributed equally for the work.
Abstract
Background and Aims
Our purpose was to assess the impact of muscle quality on overall survival (OS) in patients with advanced HCC.
Methods
This is a subanalysis of the SORAMIC trial. Overall, 363 patients were included. The SIRT/Sorafenib treatment group comprised 182 patients and the sorafenib group 181 patients. Myosteatosis was defined as skeletal muscle density (SMD) < 41 HU for patients with a body mass index up to 24.9 kg/m2 and <33 HU for patients with a body mass index ≥25 kg/m2. Albumin-gauge score was calculated as follows: serum albumin (g/dL) × SMD (HU). To assess the impact of muscle quality on clinical variables and OS, a Cox regression model was used. Hazard ratios are presented together with 95 % confidence intervals (95 % CI). Kaplan-Meier curves were used for survival analysis.
Results
In the SIRT/sorafenib cohort, low albumin-gauge score was an independent predictor of worse OS, HR = 1.74, CI 95% (1.16–2.62), p = 0.01. In the sorafenib cohort, muscle quality parameters did not predict OS. In alcohol-induced HCC (n = 129), myosteatosis independently predicted OS, HR = 1.85, CI 95% (1.10; 3.12), p = 0.02. In viral-induced HCC (n = 99), parameters of muscle quality did not predict OS. In patients with NASH/Non-alcoholic fatty liver disease (NAFLD) induced HCC, albumin-gauge score was a strong independent predictor of worse OS in the subgroup undergoing combined treatment with SIRT and sorafenib, HR = 9.86, CI 95% (1.12; 86.5), p = 0.04.
Conclusions
Myosteatosis predicts independently worse OS in patients with alcohol-induced HCC undergoing combined treatment with SIRT and sorafenib. In patients with NASH/NAFLD induced HCC undergoing treatment with SIRT and sorafenib, albumin-gauge score predicts independently worse OS.
Impact and implications
Associations between parameters of muscle quality and OS are different in accordance to the treatment strategy and etiology of HCC. These findings highlight the prognostic potential of skeletal muscle quality in patients with advanced HCC.
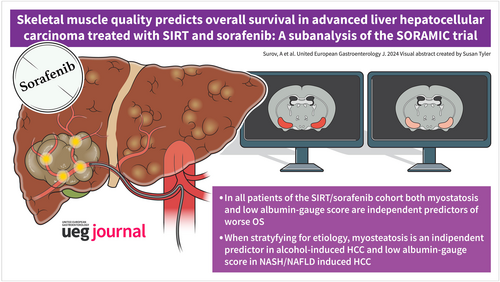
Graphical Abstract
Key summary
Summarise the established knowledge on this subject
-
In the overall sample and in the SIRT/sorafenib cohort, low albumin-gauge score was an independent predictor of worse overall survival (OS). In the sorafenib cohort, muscle quality was not associated with OS.
-
In alcohol-induced HCC, myosteatosis is an independent predictor of worse OS
-
In viral-induced HCC, there were no associations between muscle quality and OS.
-
In the NASH/Non-alcoholic fatty liver disease (NAFLD) induced HCC, in the SIRT/sorafenib cohort, a low albumin-gauge score was a strong independent predictor of worse OS.
What are the significant and/or new findings of this study?
-
The prevalence of myosteatosis is high in patients with advanced hepatocellular cancer (HCC). In the present study, the influence of low muscle quality on OS in 363 patients with advanced HCC was analyzed: 182 patients were treated with SIRT/Sorafenib and 181 patients received sorafenib alone.
-
In the SIRT/sorafenib cohort, myosteatosis was an independent predictor of worse OS. In the sorafenib cohort, muscle quality parameters did not predict OS.
-
In alcohol-induced HCC (n = 129), myosteatosis independently predicted OS. In viral-induced HCC (n = 99), muscle quality did not predict OS. In the NASH/NAFLD induced HCC, in SIRT/sorafenib cohort, a low albumin-gauge score is a strong independent predictor of worse OS.
INTRODUCTION
Hepatocellular carcinoma (HCC) is the most common primary liver cancer and one of the most common causes of cancer-related mortality worldwide.1
Computed tomography (CT) and magnetic resonance imaging play an essential role in the diagnosis and staging of HCC. Imaging parameters can also provide data about tumor prognosis. For instance, peritumoral hypointensity of HCC lesions in the hepatobiliary phase was shown as an imaging biomarker for increased recurrence risk.2
Besides tumor characterization, cross-sectional imaging can also provide information about patient's condition. Current literature suggests that some imaging parameters such as the status of the skeletal musculature and/or adipose tissue have great predictive values in several malignant tumors.3, 4 Indeed, sarcopenia predicts OS in most malignancies both in curative and in palliative setting.3 Sarcopenia is also associated with treatment related toxicity in patients receiving chemotherapy.5 Finally, sarcopenia predicts treatment response to anticancer drugs.6
Also in HCC, metaanalyses indicate that reduced muscle mass or sarcopenia is associated with relevant clinical outcomes.7, 8 Thus far, Guo et al. showed that sarcopenia predicts worse OS, higher risk of tumor recurrence, lower objective response rate, and more drug-related adverse events.7 However, some reports did not find any associations between sarcopenia and outcomes in HCC.9, 10 For instance, in the study of Labeur et al., there were no relevant relatioships between sarcopenia and OS in HCC patients, who were treated with sorafenib.9 Similar results were reported by Kobayashi et al. in HCC patients, who were treated with transcatheter arterial chemoembolization or transcatheter arterial infusion chemotherapy.11 Also, a recently published subanalysis of the SORAMIC trial showed that parameters of body composition, including low skeletal muscle mass or sarcopenia and visceral and subcutaneous adipose tissue, did not influence survival in patients with advanced HCC.10
Some previous reports indicated that low quality of the skeletal musculature, that is., fatty infiltration of the skeletal musculature or myosteatosis, plays a significant role in different malignancies.12, 13 Indeed, Aleixo et al. showed that patients with myosteatosis had 75% greater mortality risk compared to non-myosteatosis patients (HR 1.75, 95% CI 1.60–1.92, p < 0.00001).13 In HCC, only few studies analyzed the prognostic role of skeletal muscle quality.9, 12, 14, 15 Also, the reported data are controversial. While some authors found an association between myosteatosis and survival,12 others did not.9, 14
The aim of the present study was to analyze the prognostic role of the skeletal muscle quality in patients with advanced HCC from the SORAMIC clinical trial.
MATERIAL & METHODS
The present study is a subanalysis of the prospective multicenter SORAMIC clinical trial (EudraCT 2009-012576-27, NCT01126645) conducted at 38 clinical sites in 12 countries in Europe and Turkey.16
Patient selection
Subanalysis was performed within the palliative part of SORAMIC. The patients in this part were randomized to receive sorafenib monotherapy or SIRT and sorafenib.16 In short, patients were eligible if they had preserved liver function (Child-Pugh ≤ B7), an Eastern Cooperative Oncology Group performance status (ECOG PS) ≤ 2 and unresectable tumors not eligible for curative treatment or transarterial chemoembolization (TACE).16
- -
available baseline CT images;
- -
available data about OS;
- -
available serum albumin level;
- -
significant artifacts of CT images;
- -
missing data about OS.
Image analysis
For all patients, a CT scan at baseline before therapy was used. Measurement of skeletal muscle density (SMD) was performed in a semi-automatic fashion on axial images at the level of the third lumbar vertebra (L3) with the freely available Software ImageJ (version 1.53, National Institute of Health) (Figure 1). Any necessary adjustments were made by an experienced radiologist (AS), blinded to the clinical course of patients.10
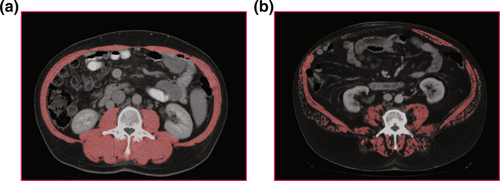
Representative cases of the patient sample. (a) Patient with high muscle mass and muscle density. (b) Patient with low muscle mass and density (myosteatosis).
Myosteatosis was defined as SMD <41 HU for patients with a body mass index up to 24.9 kg/m2 and <33 HU for patients with a body mass index ≥25 kg/m2, using the thresholds defined by Martin et al.17
Furthermore, the albumin-gauge score was calculated as follows: serum albumin (g/dL) × SMD (HU).18
Statistical analysis
SPSS Version 25 and R were used for statistical analysis. Mean and standard deviation as well as median and interquartile range (IQR) were calculated for continuous variables. To assess the impact of body composition values on clinical variables and OS, a Cox regression model was used. Hazard ratios are presented together with 95% confidence intervals (95% CI). Collected data were evaluated by means of descriptive statistics (absolute and relative frequencies). Overall survival was presented by Kaplan-Meier curves with group comparisons by the log-rank test. Because of the exploratory nature of this re-analysis of the data, all p-values are interpreted in an exploratory sense.
RESULTS
Overall sample
Overall, the present study comprised 363 patients. There were 47 women (12.9%) and 316 men (87.1%) with a mean age of 66.1 ± 8.6 years, median age, 66 years, range, 42–85 years.
The SIRT/Sorafenib treatment group comprised 182 patients and the sorafenib group 181 patients. Baseline patient characteristics are summarized in Table 1.
| Characteristic | All patients (n = 363) |
|---|---|
| Age, years, median (range) | 66 (42–85) |
| Female, n (%) | 47 (12.9) |
| Male, n (%) | 316 (87.1) |
| BCLC A, n (%) | 9 (2.5) |
| BCLC B, n (%) | 108 (29.7) |
| BCLC C, n (%) | 246 (67.8) |
| Cirrhosis, n (%) | 363 (100) |
| Etiology, n (%) | Alcohol: 132 (36.4) |
| Viral (HBV/HCV): 102 (28.1) | |
| NAFLD/NASH: 42 (11.6) | |
| Cryptogenic: 41 (11.3) | |
| Alcohol + Viral: 22 (6.1) | |
| HC: 11 (3.0) | |
| NS: 10 (2.7) | |
| AIH: 2 (0.5) | |
| A1D: 1 (0.3) | |
| ECOG 0, n (%) | 256 (70.5) |
| ECOG 1, n (%) | 102 (28.1) |
| ECOG 2, n (%) | 5 (1.4) |
| AFP level, ng/mL, median | 41.5 |
| Platelets, 103/μL, median | 168 |
| Presence of extrahepatic metastases | 75 (%) |
- Abbreviations: AFP, alpha fetoprotein; AIH, autoimmune hepatitis; A1D, alpha-1 antitrypsin deficiency; ECOG, Eastern Cooperative Oncology Group performance status scala; HBV, Hepatitis B Virus; HCV, Hepatitis C Virus; HC, Hemochromatosis; NAFLD, Non-alcoholic fatty liver disease; NASH, Non-alcoholic steatohepatitis; NS, not specified.
Myosteatosis was identified in 148 patients (40.8%), and 175 patients (48.2%) showed low albumin-gauge scores. Median OS was 9.9 months.
Patients with myosteatosis, had shorter OS in comparison to the patients with normal muscle density, 13.1 ± 0.97 months versus 17.6 ± 0.94 months, respectively (p < 0.01) (Figure 2a). Furthermore, patients with low albumin gauge values also had shorter OS in comparison to the patients with normal albumin gauge values, 13.6 ± 0.91 months versus 18.1 ± 1.05 months, respectively (p < 0.01) (Figure 2b).
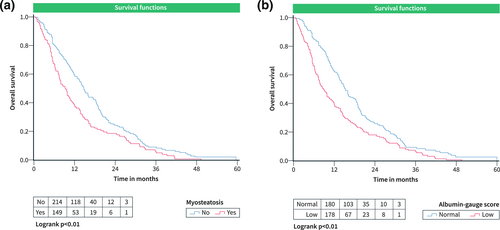
OS curves according to parameters of skeletal muscle quality in the total SORAMIC cohort. (a) OS in patients grouped according to the presence of myosteatosis. (b) OS in patients with low and normal albumin-gauge scores. OS, Overall survival.
Also, low albumin-gauge score was an independent predictor of low OS (Table 2).
| Univariable analysis | Multivariable analysis (adjusted for all variables in the table and age & sex) | |||||
|---|---|---|---|---|---|---|
| HR | 95% CI | p-value | HR | 95% CI | p-value | |
| Myosteatosis | 1.50 | 1.19–1.88 | <0.01 | 1.32 | 0.96–1.80 | 0.08 |
| Low albumin-gauge score | 1.58 | 1.26–1.98 | <0.01 | 1.43 | 1.07–1.91 | 0.02 |
| AFP level (>400 vs. ≤400) | 1.37 | 1.08–1.73 | 0.01 | 1.32 | 1.04–1.68 | 0.02 |
| Platelets (≤100 vs. >100) | 1.48 | 1.09–2.00 | 0.01 | 1.43 | 1.03–1.99 | 0.03 |
| ECOG, >0 versus 0 | 0.94 | 0.71–1.26 | 0.70 | 1.02 | 0.78–1.35 | 0.87 |
| BSLC stage, C versus A + B | 1.20 | 0.94–1.52 | 0.15 | 1.25 | 0.94–1.66 | 0.13 |
| Extrahepatic metastases | 1.10 | 0.84–1.45 | 0.49 | 0.99 | 0.73–1.33 | 0.93 |
- Note: Low albumin-gauge score means value less than the median (1472).
SIRT and sorafenib cohort
This subgroup comprised 182 patients. Median OS was 10.8 months. In this subgroup, myosteatosis was identified in 82 patients (45%), and in 90 cases (49.5%), low skeletal and low albumin-gauge scores were present. Patients with low skeletal muscle quality showed shorter survival time as follows: patients with myosteatosis versus patients with normal muscle density, 12.3 ± 1.1 months versus 17.7 ± 1.3 months, p = 0.01 (Figure 3a); patients with low albumin gauge score versus patients with normal albumin gauge score, 12.3 ± 1.1 months versus 18.8 ± 1.4 months, p < 0.01 (Figure 3b). Low albumin-gauge score was also an independent predictor of low OS (Table 3).
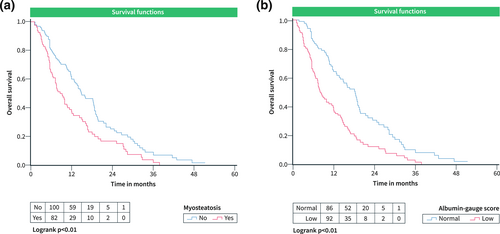
OS curves according to parameters of skeletal muscle quality in the cohort undergoing treatment with SIRT + sorafenib. (a) OS in patients grouped according to the presence of myosteatosis. (b) OS in patients with low and normal albumin-gauge scores. OS, Overall survival.
| Univariable analysis | Multivariable analysis (adjusted for all variables in the table and age & sex) | |||||
|---|---|---|---|---|---|---|
| HR | 95% CI | p-value | HR | 95% CI | p-value | |
| Myosteatosis | 1.67 | 1.22–2.30 | <0.01 | 1.29 | 0.86–1.94 | 0.22 |
| Low albumin-gauge score | 2.02 | 1.46–2.80 | <0.01 | 1.74 | 1.16–2.62 | 0.01 |
| AFP level (>400 vs. ≤400) | 1.57 | 1.13–2.19 | 0.01 | 1.55 | 1.07–2.25 | 0.02 |
| Platelets (≤100 vs. >100) | 1.60 | 1.04–2.46 | 0.03 | 1.58 | 1.00–2.50 | 0.05 |
| ECOG, >0 versus 0 | 1.35 | 0.96–1.90 | 0.08 | 1.20 | 0.82–1.75 | 0.34 |
| BSLC stage, C versus A + B | 1.16 | 0.83–1.64 | 0.39 | 0.96 | 0.64–1.46 | 0.86 |
| Extrahepatic metastases | 0.99 | 0.69–1.42 | 0.94 | 0.93 | 0.62–1.38 | 0.72 |
Sorafenib alone cohort
In this subgroup, 181 patients were involved. Median OS was 9.8 months. Myosteatosis was present in 66 patients (36.5%) and 85 patients (47%) had low albumin-gauge scores. There were no differences in OS between the patients with low and normal skeletal muscle quality: patients with myosteatosis versus patients with normal muscle density, 14.2 ± 1.7 months versus 17.4 ± 1.3 months, p = 0.08 (Figure 4a); patients with low albumin gauge score versus patients with normal albumin gauge score, 15.1 ± 1.5 months versus 17.3 ± 1.5 months, p = 0.12 (Figure 4b). Muscle quality parameters did not predict OS in this subgroup (Table 4).
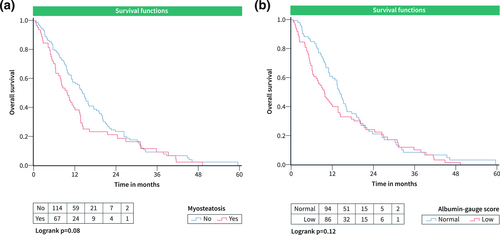
OS curves according to parameters of skeletal muscle quality in the cohort undergoing treatment with sorafenib alone. (a) OS in patients grouped according to the presence of myosteatosis. (b) OS in patients with low and normal albumin-gauge scores. OS, Overall survival.
| Univariable analysis | Multivariable analysis (adjusted for all variables in the table and age & sex) | |||||
|---|---|---|---|---|---|---|
| HR | 95% CI | p-value | HR | 95% CI | p-value | |
| Myosteatosis | 1.34 | 0.96–1.87 | 0.08 | 1.35 | 0.82–2.25 | 0.24 |
| Low albumin-gauge score | 1.29 | 0.93–1.78 | 0.12 | 1.17 | 0.75–1.81 | 0.49 |
| AFP level (>400 vs. ≤400) | 1.22 | 0.87–1.72 | 0.24 | 1.23 | 0.87–1.74 | 0.25 |
| Platelets (≤100 vs. >100) | 1.35 | 0.87–2.09 | 0.18 | 1.42 | 0.88–2.30 | 0.15 |
| ECOG, >0 versus 0 | 1.11 | 0.77–1.61 | 0.56 | 0.86 | 0.56–1.33 | 0.51 |
| BSLC stage, C versus A + B | 1.21 | 0.86–1.71 | 0.27 | 1.43 | 0.95–2.15 | 0.09 |
| Extrahepatic metastases | 1.24 | 0.82–1.90 | 0.31 | 1.06 | 0.68–1.67 | 0.78 |
Different etiology of HCC, muscle quality and overall survival
In alcohol induced HCC, myosteatosis predicted OS in the overall sample (Table 5). In patients undergoing treatment with SIRT and sorafenib, both myosteatosis and low albumin-gauge score were associated with worse OS in univariable analysis (Table 5). However, the parameters of muscle quality were not independent predictors of worse OS. In the subgroup that was treated with sorafenib alone, muscle quality did not influence OS (Table 5).
| Univariable analysis | Multivariable analysis (adjusted for all variables in the table and age & sex) | |||||
|---|---|---|---|---|---|---|
| HR | 95% CI | p-value | HR | 95% CI | p-value | |
| Overall sample (n = 129) | ||||||
| Myosteatosis | 1.82 | 1.26–2.64 | <0.01 | 1.85 | 1.10–3.12 | 0.02 |
| Low albumin-gauge score | 1.76 | 1.19–2.59 | 0.01 | 1.58 | 0.94–2.64 | 0.08 |
| AFP level (>400 vs. ≤400) | 0.89 | 0.60–1.32 | 0.56 | 0.92 | 0.59–1.42 | 0.70 |
| Platelets (≤100 vs. >100) | 1.58 | 0.99–2.52 | 0.06 | 1.74 | 1.06–2.86 | 0.03 |
| ECOG, >0 versus 0 | 1.02 | 0.66–1.57 | 0.92 | 0.88 | 0.53–1.46 | 0.62 |
| BSLC stage, C versus A + B | 1.11 | 0.75–1.63 | 0.61 | 1.52 | 0.92–2.52 | 0.10 |
| Extrahepatic metastases | 1.17 | 0.69–1.99 | 0.55 | 0.84 | 0.45–1.56 | 0.58 |
| Univariable analysis | Multivariable analysis (adjusted for all variables in the table and age & sex) | |||||
|---|---|---|---|---|---|---|
| HR | 95% CI | p-value | HR | 95% CI | p-value | |
| SIRT/Sorafenib cohort (n = 66) | ||||||
| Myosteatosis | 1.87 | 1.11–3.15 | 0.02 | 1.49 | 0.67–3.32 | 0.33 |
| Low albumin-gauge score | 2.05 | 1.18–3.58 | 0.01 | 2.24 | 1.01–4.94 | 0.05 |
| AFP level (>400 vs. ≤400) | 1.24 | 0.71–2.16 | 0.45 | 1.24 | 0.63–2.44 | 0.54 |
| Platelets (≤100 vs. >100) | 1.20 | 0.64–2.27 | 0.58 | 1.54 | 0.76–3.11 | 0.23 |
| ECOG, >0 versus 0 | 1.20 | 0.67–2.15 | 0.53 | 0.76 | 0.37–1.55 | 0.44 |
| BSLC stage, C versus A + B | 1.24 | 0.72–2.12 | 0.43 | 1.63 | 0.81–3.28 | 0.17 |
| Extrahepatic metastases | 1.18 | 0.60–2.34 | 0.63 | 0.74 | 0.31–1.77 | 0.49 |
| Univariable analysis | Multivariable analysis (adjusted for all variables in the table and age & sex) | |||||
|---|---|---|---|---|---|---|
| HR | 95% CI | p-value | HR | 95% CI | p-value | |
| Sorafenib cohort (n = 63) | ||||||
| Myosteatosis | 1.54 | 0.89–2.68 | 0.12 | 1.54 | 0.72–3.27 | 0.26 |
| Low albumin-gauge score | 1.53 | 0.87–2.68 | 0.14 | 1.26 | 0.59–2.70 | 0.56 |
| AFP level (>400 vs. ≤400) | 0.82 | 0.46–1.45 | 0.49 | 0.84 | 0.41–1.73 | 0.64 |
| Platelets (≤100 vs. >100) | 2.11 | 1.05–4.24 | 0.04 | 2.38 | 1.04–5.49 | 0.04 |
| ECOG, >0 versus 0 | 0.88 | 0.46–1.70 | 0.71 | 0.99 | 0.42–2.33 | 0.98 |
| BSLC stage, C versus A + B | 0.99 | 0.56–1.76 | 0.98 | 1.35 | 0.63–2.92 | 0.44 |
| Extrahepatic metastases | 1.08 | 0.46–2.54 | 0.86 | 0.95 | 0.35–2.58 | 0.92 |
In viral-induced HCC, neither myosteatosis nor low albumin-gauge score predicted OS in all subgroups (Table 6).
| Univariable analysis | Multivariable analysis (adjusted for all variables in the table and age & sex) | |||||
|---|---|---|---|---|---|---|
| HR | 95% CI | p-value | HR | 95% CI | p-value | |
| Overall sample | ||||||
| Myosteatosis | 0.82 | 0.50–1.34 | 0.42 | 0.72 | 0.36–1.43 | 0.35 |
| Low albumin-gauge score | 0.99 | 0.63–1.56 | 0.96 | 1.14 | 0.64–2.03 | 0.67 |
| AFP level (>400 vs. ≤400) | 2.04 | 1.31–3.19 | <0.01 | 2.51 | 1.49–4.23 | <0.01 |
| Platelets (≤100 vs. >100) | 1.20 | 0.71–2.04 | 0.50 | 1.19 | 0.66–2.14 | 0.57 |
| ECOG, >0 versus 0 | 1.17 | 0.73–1.88 | 0.51 | 1.45 | 0.85–2.48 | 0.17 |
| BSLC stage, C versus A + B | 1.27 | 0.75–2.18 | 0.38 | 1.30 | 0.73–2.30 | 0.38 |
| Extrahepatic metastases | 1.05 | 0.63–1.73 | 0.86 | 0.80 | 0.44–1.43 | 0.44 |
| Univariable analysis | Multivariable analysis (adjusted for all variables in the table and age & sex) | |||||
|---|---|---|---|---|---|---|
| HR | 95% CI | p-value | HR | 95% CI | p-value | |
| SIRT/Sorafenib cohort | ||||||
| Myosteatosis | 0.84 | 0.44–1.63 | 0.61 | 0.65 | 0.27–1.55 | 0.33 |
| Low albumin-gauge score | 1.12 | 0.59–2.10 | 0.74 | 0.88 | 0.33–2.30 | 0.79 |
| AFP level (>400 vs. ≤400) | 1.72 | 0.92–3.20 | 0.09 | 2.58 | 0.96–6.93 | 0.06 |
| Platelets (≤100 vs. >100) | 1.63 | 0.76–3.47 | 0.21 | 1.21 | 0.50–2.92 | 0.68 |
| ECOG, >0 versus 0 | 1.58 | 0.82–3.02 | 0.17 | 1.47 | 0.72–2.97 | 0.29 |
| BSLC stage, C versus A + B | 1.35 | 0.64–2.83 | 0.43 | 1.17 | 0.50–2.74 | 0.71 |
| Extrahepatic metastases | 0.88 | 0.44–1.75 | 0.71 | 0.70 | 0.29–1.68 | 0.43 |
| Univariable analysis | Multivariable analysis (adjusted for all variables in the table and age & sex) | |||||
|---|---|---|---|---|---|---|
| HR | 95% CI | p-value | HR | 95% CI | p-value | |
| Sorafenib cohort | ||||||
| Myosteatosis | 0.80 | 0.36–1.78 | 0.59 | 1.95 | 0.42–9.02 | 0.39 |
| Low albumin-gauge score | 0.83 | 0.42–1.64 | 0.59 | 1.08 | 0.34–3.38 | 0.90 |
| AFP level (>400 vs. ≤400) | 2.59 | 1.29–5.21 | 0.01 | 3.73 | 1.66–8.40 | <0.01 |
| Platelets (≤100 vs. >100) | 0.82 | 0.39–1.74 | 0.61 | 1.00 | 0.39–2.52 | 0.99 |
| ECOG, >0 versus 0 | 0.92 | 0.39–2.13 | 0.84 | 3.11 | 1.06–9.14 | 0.04 |
| BSLC stage, C versus A + B | 1.17 | 0.54–2.57 | 0.69 | 1.27 | 0.49–3.26 | 0.62 |
| Extrahepatic metastases | 1.43 | 0.64–3.20 | 0.38 | 1.01 | 0.40–2.54 | 0.99 |
Finally, in NASH/NAFLD induced HCC, myosteatosis and low albumin-gauge score were associated with worse OS in univariable analysis (Table 7). Low albumin-gauge score was a strong and independent predictor of worse OS in patients undergoing SIRT and sorafenib treatment (Table 7). In patients undergoing treatments with sorafenib alone, muscle quality did not influence OS (Table 7).
| Univariable analysis | Multivariable analysis (adjusted for all variables in the table and age & sex) | |||||
|---|---|---|---|---|---|---|
| HR | 95% CI | p-value | HR | 95% CI | p-value | |
| Overall sample | ||||||
| Myosteatosis | 2.75 | 1.30–5.82 | 0.01 | 1.70 | 0.59–4.92 | 0.33 |
| Low albumin-gauge score | 2.27 | 1.16–4.46 | 0.02 | 2.56 | 0.94–6.98 | 0.07 |
| AFP level (>400 vs. ≤400) | 1.98 | 0.98–3.99 | 0.06 | 3.13 | 1.18–8.28 | 0.02 |
| Platelets (≤100 vs. >100) | 1.57 | 0.48–5.22 | 0.46 | 0.38 | 0.07–1.98 | 0.25 |
| ECOG, >0 versus 0 | 1.52 | 0.68–3.37 | 0.31 | 3.48 | 0.90–13.4 | 0.07 |
| BSLC stage, C versus A + B | 1.01 | 0.51–2.00 | 0.98 | 0.36 | 0.11–1.20 | 0.10 |
| Extrahepatic metastases | 0.88 | 0.30–2.57 | 0.81 | 2.65 | 0.61–11.6 | 0.19 |
| Univariable analysis | Multivariable analysis (adjusted for all variables in the table and age & sex) | |||||
|---|---|---|---|---|---|---|
| HR | 95% CI | p-value | HR | 95% CI | p-value | |
| SIRT/Sorafenib cohort | ||||||
| myosteatosis | 4.72 | 1.40–15.9 | 0.01 | 2.11 | 0.27–16.6 | 0.48 |
| Low albumin-gauge score | 2.94 | 1.06–8.20 | 0.04 | 9.86 | 1.12–86.5 | 0.04 |
| AFP level (>400 vs. ≤400) | 1.11 | 0.38–3.26 | 0.86 | 2.73 | 0.29–26.0 | 0.38 |
| Platelets (≤100 vs. >100) | Analysis impossible* | |||||
| ECOG, >0 versus 0 | 1.97 | 0.59–6.56 | 0.27 | 39.6 | 2.22–708 | 0.01 |
| BSLC stage, C versus A + B | 0.73 | 0.26–2.03 | 0.54 | 0.04 | 0.01–0.68 | 0.03 |
| Extrahepatic metastases | 0.83 | 0.23–2.97 | 0.77 | 11.5 | 0.76–172 | 0.08 |
| Univariable analysis | Multivariable analysis (adjusted for all variables in the table and age & sex) | |||||
|---|---|---|---|---|---|---|
| HR | 95% CI | p-value | HR | 95% CI | p-value | |
| Sorafenib cohort | ||||||
| Myosteatosis | 1.83 | 0.62–5.43 | 0.28 | 1.77 | 0.22–14.5 | 0.60 |
| Low albumin-gauge score | 2.24 | 0.83–6.01 | 0.11 | 4.77 | 0.74–30.8 | 0.10 |
| AFP level (>400 vs. ≤400) | 5.54 | 1.62–18.9 | 0.01 | 6.62 | 1.46–30.0 | 0.01 |
| Platelets (≤100 vs. >100) | 1.53 | 0.43–5.43 | 0.51 | 0.13 | 0.01–1.63 | 0.11 |
| ECOG, >0 versus 0 | 1.05 | 0.34–3.30 | 0.93 | 1.23 | 0.25–6.02 | 0.80 |
| BSLC stage, C versus A + B | 1.70 | 0.65–4.45 | 0.28 | 1.67 | 0.40–7.00 | 0.48 |
| Extrahepatic metastases | 2.46 | 0.30–20.1 | 0.40 | 2.16 | 0.18–25.8 | 0.54 |
DISCUSSION
The present study demostrated that myosteatosis is a frequent event in patients with advanced HCC. Furthermore, muscle quality plays a relevant role in this patient group.
According to the literature, parameters of body composition are significant predictors in HCC.8, 19, 20 So far, sarcopenia predicts worse survival in HCC both in curative and in palliative settings.7, 8, 21 Also, visceral adiposity and/or high radiodensity of visceral adipose tissue predicts poor OS in HCC.20, 22 Finally, high density of subcutaneous adipose tissue correlates negatively with survival in patients with HCC.19 In contrast to other parameters of body composition, the prognostic role of low skeletal muscle quality in patients with HCC was investigated in only a few reports with conflicting results.9, 12, 14, 15 The present study showed that low muscle quality reflecting by myosteatosis and/or low albumin-gauge score is an independent predictor of worse OS in patients with advanced HCC.
Associations between myosteatosis and OS in patients with advanced HCC are multifactorial. Firstly, low muscle density reflects a state of malnutrition. Anemia and hypoalbuminemia are associated with low muscle density.23
Secondly, myosteatosis provokes several systemic effects. Thus far, accumulation of lipid within human skeletal muscle is associated with obesity-related insulin resistance.24
Thyrdly, the identified effects of myosteatosis may be related to the endocrine function of the skeletal musculature. Skeletal muscles synthesize, express, and secret several peptides (myokines) with anticancer effects.25 For instance, myokine irisin significantly decreases cell number, migration and viability in malignant cells.26, 27 Furthermore, irisin prevented epithelial-to-mesenchymal transition (EMT), a major driver of cancer metastasis.27 Myokine decorin is a small leucine-rich repeat proteoglycan that is also produced by the skeletal musculature. Decorin reduces proliferation, migration, and EMT marker expression in various types of cancer cells.28 Decorin significantly reduces angiogenesis and pulmonary metastasis in the tumor xenograft models.29
Another myokine, oncostatin M suppress cell growth in breast cancer, lung adenocarcinoma, and glioblastoma cells.30-32 Treatment with oncostatin M suppressed migration and invasion in human lung adenocarcinoma cell lines, and also blocked tumor metastasis in vivo.30
Finally, interleukin (IL)-15 is a myokine that activates natural killer cells and CD8+ T lymphocytes, which have an important antitumoral effect.33
We hypothesize that altered musculature with fat deposition may also have altered endocrine function, resulting in a smaller production of myokines.
There are also other pathophysiological mechanisms that explain the prognostic relevance of low skeletal muscle quality in HCC. Intramuscular adipose tissue is also a metabolic activator and secrets various substances (adipokines) such as leptin, tumor necrosis factor alpha, interleukin 1, and interleukin 6.34, 35 Moreover, these adipokines alter cell-mediated immune responses, trigger inflammation and stimulate tumor cells.35 For instance, in HCC, leptin promotes invasion and migration of tumor cells.36
On the other hand, the tumor microenvironment also produces pro-inflammatory cytokines such as interleukin 6.37 These cytokines may mediate the redistribution of adipose tissue and intramuscular fat infiltration by inducing the differentiation of muscle progenitor cells to an adipocyte-like phenotype.38, 39
These mechanisms can explain our results and show that associations between body composition, in partikular low skeletal muscle quality, and tumor behavior are very complex and harbor potential aspects for further investigations.
The present study identified another relevant phenomenon. Myosteatosis and low albumin-gauge score affected OS in patients with HCC, who were treated with SIRT/sorafenib but not in patients receiving sorafenib alone. This phenomenon is difficult to ascertain. We analyzed the reported data and found that some previous studies observed similar findings. Thus far, fat accumulation in skeletal muscle is predictive of worse OS after partial hepatectomy in patients with HCC.40 Furthermore, in HCC patients undergoing TACE, myosteatosis predicted treatment response.41 Moreover, patients with myosteatosis had a higher rate of mortality than patients without myosteatosis (93.18% vs. 83.58%, P < 0.0001).41 Similarly, in patients with HCC undergoing hepatic artery infusion chemotherapy, myosteatosis was an independent risk predictor for treatment failure, shorter progression-free survival and OS.42
However, in patients with advanced HCC undergoing treatment with sorafenib, myosteatosis did not predict OS.9 In patients who were treated with immunotherapy, myosteatosis had no significant influence on OS.43
As shown, myosteatosis affects OS in patients with HCC undergoing surgical tumor resection and interventional treatment approaches like SIRT and/or TACE, but not in patients receiving systemic therapy. This indicates that low skeletal muscle quality should be considered for the choice of treatment strategy in patients with HCC.
Importantly, we found that in different etiologies of HCC, associations between skeletal muscle quality and OS are also different. Indeed, myosteatosis predicted OS in patients with alcohol-induced HCC but not in viral-induced tumors. Furthermore, low albumin-gauge score was a strong and independent predictor of worse OS in patients undergoing treatments with SIRT and sorafenib. Consequently, also etiology of HCC should be included into the calculation of treatment strategy.
Our study also provides a purpose for future investigations. Low muscle density is a potentially modifiable factor. Some reports suggest that intensifying exercise and additional nutritional support with vitamin D and omega-3 fatty acids may also improve muscle mass and quality in cancer patients.44-46 Therefore, checking for myosteatosis and development of supportive regimes including exercise and nutrition may be beneficial for patients with advanced HCC.
There are some limitations to the present study. Firstly, patients without baseline abdominal CT scan were excluded, which might lead to selection bias. Secondly, sub-cohorts such as alcohol- and viral-induced HCC contain a small number of patients. However, the present work included the largest overall sample size to date. Furthermore, our results are based on the prospectively collected data within a clinical trial.
In conclusion, low muscle quality is highly prevalent in patients with advanced HCC. Myosteatosis and albumin-gauge score are independent predictors of OS in patients with advanced alcohol-induced HCC undergoing combined treatment with SIRT and sorafenib.
AUTHOR CONTRIBUTIONS
Study concept, study design, data interpretation, and drafting the manuscript: Alexey Surov. Data collection: all authors. Analysis and interpretation of data: Alexey Surov, Andreas Wienke. Critical revision of the manuscript and study supervision: Max Seidensticker. Drafting final manuscript: all authors.
ACKNOWLEDGMENTS
The authors received no financial support to produce this manuscript.
Open Access funding enabled and organized by Projekt DEAL.
CONFLICT OF INTEREST STATEMENT
The authors declare no conflicts of interest that pertain to this work. Please refer to the accompanying ICMJE disclosure forms for further details.
Open Research
DATA AVAILABILITY STATEMENT
The data that support the findings of this study are available from the corresponding author upon reasonable request.


