Prolonged cycling exercise alters neural control strategy, irrespective of carbohydrate dose ingested
Michael L. Newell, Lewis J. Macgregor, Stuart D. R. Galloway and Angus M. Hunter are contributed equally to this work.
Abstract
The interactions between CHO dosage and neuromuscular regulation following fatiguing endurance exercise are not well understood. Fifteen well-trained male cyclists completed 4 experimental trials of 120-min submaximal cycling (95% lactate threshold) during which water (0 g CHO·h−1) or CHO beverages (20, 39, or 64 g CHO·h−1) were consumed every 15 minutes, at a rate of 1 L·h−1, followed by a work-matched time trial ~30 minutes. Maximal voluntary contraction (MVC), M-wave twitch potentiation and torque, motor unit recruitment and firing rate were recorded pre- and post-cycling. Time trial performance improved following 39 and 64 versus 0 and 20 g CHO·h−1, with no effect of CHO dose on any pre- to post-neuromuscular function measures. Pre- to post-cycling exercise: (1) MVC, and M-wave amplitude and duration declined by −21.5 Nm, and −4.9 mV and −7.1 ms, respectively; (2) peak evoked torque remained unchanged; (3) Firing rate of early- and mid-recruited motor units increased by 0.93 pps and 0.74 pps, respectively, with no change in later-recruited motor units. Thus, central drive to early- and mid-recruited motor units increases as a result of endurance cycling, due to a likely fatigue compensatory mechanism. However, CHO availability does not appear to influence increased neuromuscular drive.
1 INTRODUCTION
Fatigue during endurance exercise becomes more central vs. peripheral in origin, as duration increases.1 This shift forms part of an overarching pacing strategy governing skeletal muscle recruitment to maintain homeostasis in an attempt to delay fatigue.2 A relationship between changes in central motor output and peripheral mechanisms of muscle fatigue has been theorized, such that increased motor unit firing rate can partially compensate for peripheral contractile fatigue, as has been illustrated by increased electromyographic activity during submaximal contractions to fatigue.3 Fatigue during prolonged exercise results in diminished force generating capacity of working muscles4; while effective pacing ensures that performance is maintained throughout an endurance task.5 Yet neuromuscular recruitment increases by steadily recruiting more motor units6 to compensate for fatigue-induced reduction of lower threshold motor unit firing rates.7
Centrally and peripherally derived sources of fatigue can be discerned experimentally8 by stimulation of specific sites along the pathway from the central nervous system (CNS) to muscle force production.9 Formation of M-wave following peripheral nerve stimulation is often used to investigate neuromuscular propagation and muscle fiber electrical conductance characteristics,10 while individual motor unit discharge onto the sarcolemma can be recorded using decomposition electromyography (dEMG). Adoption of these assessments in conjunction permits characterization of fatigue, based on origin of impairments. Previously, using dEMG, Stock et al11 and Harwood et al12 have demonstrated a reduction in mean motor unit firing rates following isometric and dynamic submaximal fatigue protocols, respectively. Such a reduction may be modulated by metabolically activated inhibitory afferent signals.13 Elsewhere, we have previously shown that eccentric exercise, which preferentially activates higher-threshold motor units,14-16 can reduce the firing rate specifically of later-recruited motor units, in both the absence17 and presence18 of force deficits. Taken together, these findings reinforce the understanding that fatigue-associated neural control strategy is task-dependent and therefore may be different following other exercise modalities such as endurance cycling. Accordingly, the mode, intensity, and duration of exercise may all influence neuromuscular alterations.
The development of fatigue in prolonged endurance cycling typically coincides with the depletion of endogenous carbohydrate (CHO) stores,19-21 which can be delayed with the consumption of exogenous CHO that modifies endogenous CHO utilization in a dose-dependent manner.22, 23 We have previously demonstrated in a parallel study of the same cohort that ingestion of CHO at a rate ≥39 g·h−1 leads to endogenous glycogen sparing during exercise.22 CHO ingestion also preserves neuromuscular drive, as reflected by reduced EMG amplitude, attenuating peripheral fatigue during steady-state cycling to exhaustion24; but there are few data that allude to what aspect of the neural strategy is altered in response to feeding CHO. Further research has proposed the existence of a muscle “glycostat” whereby chemoreceptor sensing of low glycogen stores could provide afferent feedback to the CNS to regulate the neural control strategy at the muscle, optimizing pacing strategy by regulating exercise intensity based on glycogen availability.25 It is possible that CHO ingestion during endurance exercise may modulate neural control strategy at the level of the muscle. Rauch et al25 manipulated pre-exercise muscle glycogen content prior to 120 minutes steady-state cycling followed by a maximal time trial performance; performance improved with elevated muscle glycogen content due to CHO loading, while pacing strategies were adjusted such that time trials were completed with similar depleted muscle glycogen levels irrespective of starting muscle glycogen content. Therefore, in a time trial or race task, optimal pacing for maximizing performance will ensure that, regardless of CHO availability, task completion will always occur with similar levels of fatigue.26 Yet, we have little understanding of the interactions between CHO availability and neural processes during endurance-based fatigue conditions.
As far as we are aware, there are no studies documenting motor unit firing behavior after endurance cycling activity with different CHO ingestion rates. According to the “glycostat” theory, it could be suggested that altered neural control strategies, dependant on CHO availability, would be adopted en route to a similar fatigue state upon task completion, with these varying strategies placing dissimilar demand on muscles, leading to differences in peripheral fatigue status. Therefore, the aim of the present study was to investigate the immediate motor unit firing pattern changes following fatiguing endurance cycling with different carbohydrate ingestion rates between 0 and 64 g·h−1. We hypothesized that during the steady-state portion of the protocol, increasing CHO dose would attenuate the increase in surface electromyography (sEMG) amplitude. Whereas, from pre- to post-exercise we hypothesized a reduction in firing rates from low threshold motor units, with no differences between the different CHO conditions, driven by the same end point of fatigue achieved through differentiated pacing strategies within the performance time trial, and thus leading to varying markers of peripheral fatigue.
2 MATERIALS AND METHODS
2.1 Participants
Fifteen well-trained male cyclists were recruited from regional cycling and triathlon clubs between January 2012 and January 2013. The mean ± SD characteristics of the participants were: age 33.1 ± 10.3 years, body mass 69.1 ± 8.5 kg, height 165.9 ± 6.5 cm, peak power output (PPO) 399 ± 39 W, and V̇O2max 64 ± 9 mL⋅kg−1min−1. Participants were required to have been training > 6 h/week for > 3 years. Each individual had the procedures and associated risks explained prior to providing written informed consent to participate in the study, which was approved by the departmental research ethics committee in accordance with the 2008 Declaration of Helsinki. Prior to their first laboratory visit, participants completed a 2-day food and activity diary, while following habitual dietary intake. Before each experimental trial, they were asked to replicate this dietary intake and activity as closely as possible. Additionally, participants were asked to completely refrain from exercise for 24 hours prior to visiting the laboratory.
2.2 Study design
In a double-blind, placebo-controlled, randomized cross-over design, participants visited the laboratory 6 times (2 preliminary visits and 4 intervention trials) over a 6-week period. Trials were completed 7 days apart with each visit commencing at the same time of day. During the first preliminary visit, following 10-h overnight fast, participants completed assessment of lactate threshold, V̇O2max, and PPO on a cycle ergometer (Lode Excalibur; Lode BV, Groningen, The Netherlands), exactly as described by Newell et al27 Mean ± SD lactate concentration at lactate threshold was 2.1 ± 0.4 mmol⋅L−1 (52% ± 6% of PPO). During the second visit, participants completed a full familiarization trial. The familiarization trial and 4 subsequent intervention trials were identical and are summarized in Figure 1A. Trials involved first the determination of compound motor unit action potential (M-wave), MVC, and individual motor unit firing characteristics. Following these initial assessments, participants completed 120 minutes steady-state submaximal cycling exercise at 95% of lactate threshold (197 ± 28 W). During familiarization, water was ingested every 15 minutes throughout the cycling bout, at a fluid ingestion rate of 1 L h−1. Thereafter, during intervention trials, participants consumed, in a randomized order, either a control (0%), 2%, 3.9%, or 6.4% CHO solutions, ingested at a rate of 1 L⋅h−1 giving a final ingestion rate of 0, 20, 39, and 64 g CHO⋅h−1. To ensure double blinding, all CHO solutions were flavor matched and prepared in advance by an independent researcher who was not present during intervention trials, drinks were delivered in identical opaque containers. At 15-min intervals throughout the 120 minutes, sEMG was captured from vastus lateralis for 30 seconds. The steady-state cycle was followed by a maximal performance task to induce exhaustive fatigue; this task involved a work target simulated time trial specific to each individual (538 ± 52 kJ). Immediately following completion of the time trial, participants repeated pre-exercise assessments in an identical order to before.

2.3 Methodology
On arrival to the laboratory, participants emptied their bladder and bowel prior to nude body mass measurement. Participants wore the same cycling attire for each of their trials, to reduce thermoregulatory variability. A pair of Ag/AgCl self-adhesive electrodes (PNS Dual Element Electrode; Vermed, VT, USA) were affixed to the skin over the vastus lateralis of the participant’s right leg, with an inter-electrode distance of 20 mm, in accordance with SENIAM guidelines.28 The site was first prepared by carefully shaving, cleansing with rubbing alcohol, and abrading. A reference electrode was secured to the elbow of the participant’s right arm. Immediately proximal to the bipolar electrode configuration, a surface array dEMG sensor (Delsys, Inc, Boston, MA, USA) was fixed to the skin; the sensor was first cleaned with rubbing alcohol, before adhering to the prepared skin with adhesive tape. The sensor consisted of 5 cylindrical pin electrodes, each 0.5 mm in diameter, protruding from the housing (2 × 3 cm). The pins are blunted, such that they make an indentation when pressed firmly against the skin, but do not puncture the epidermis. Four of the 5 pins are arranged at the corners of a 5 × 5 mm square; the fifth (reference) pin is in the center of the square, equidistant from each of the other 4, such that the inter-electrode distance is 3.6 mm.29 A 5-cm-diameter reference electrode (HE-R DermaSport Electrode; American Imex, Irvine, CA, USA) was secured over the patella of the right leg.
Participants were next coupled to an isokinetic dynamometer (Biodex System 3, Medical Systems, Shirley, NY, USA) for assessment of MVC and neuromuscular measures. All tests were performed on the right leg, with a knee joint angle of 60° (0° = full extension).30 The lateral femoral epicondyle was visually aligned with the axis of rotation of the dynamometer and the limb was secured using a strap positioned proximal to the lateral malleolus. Seat positions were adjusted to suit each individual participant’s anthropometric characteristics, and participants were secured in the required position with a single strap across the upper left leg. The final positioning of each participant was recorded during familiarization and replicated throughout each intervention trial, to ensure constancy.
For assessment of M-wave, a 2-cm-diameter self-adhesive cathode (Axelgaard Manufacturing Co., Ltd., Fallbrook, CA, USA) was affixed to the skin in the femoral triangle. Cathode position was determined by locating the pulse of the femoral artery and marking the site 1 cm laterally to this point along the inguinal fold. The anode (HE-R DermaSport Electrode; American Imex, Irvine, CA, USA) was placed over the gluteus maximus. Stimuli were 2.5 ms, square wave pulses delivered from a constant current variable voltage stimulator (STMISOL−1: Linear Isolated Stimulator; Biopac Systems Inc, Goleta, CA, USA). A progressive incremental stimulation protocol was adopted, commencing with a current amplitude of 10 mA and increased by 10 mA increments until no further increase in evoked twitch torque was observed despite increasing stimulation amplitude. A period of 15 s separated each stimulation, to avoid any potentiation effect. Peak evoked twitch torque and associated M-wave peak-to-peak amplitude and duration in response stimulation were measured.
Participants next performed knee extension MVC with the dynamometer positioning maintained as described above; additional straps were fastened across participants’ chest and pelvis, in accordance with the manufacturers’ instructions. Initially participants completed a standardized warm-up consisting of two sets of 3 × 5 seconds isometric contractions; with 30-s recovery between repetitions and between sets. For the first set, participants contracted at an intensity perceived to be 50% of maximum effort; for the second set, the intensity of contraction was 75% of perceived maximum,18 and visual feedback was available on a computer monitor positioned in front of the dynamometer seat, as an output guide. Following this warm-up, 3 × 5 seconds maximal effort isometric knee extensions were performed with 60-s recovery between each effort. Participants were instructed to contract maximally as quickly as possible, and consistent verbal encouragement was provided by the same investigator throughout, to ensure maximum effort.31 During contractions, participants were instructed to cross their arms in front of their chest. To maintain internal validity, the same investigator was present throughout all testing.32 The contraction eliciting the highest peak torque was designated MVC.
A 60-s recovery period followed MVC assessment, before participants performed a submaximal isometric muscle action tracing a trapezoidal template (TRAP) consisting of 7 seconds linear ramp up from 0% to 70% of pre-exercise MVC, followed by a 10-s steady force period maintaining 70%, then a 7-s linear reduction in force from 70% to 0% (Figure 1B). The template and output feedback trace were visible on a computer monitor positioned directly in front of the dynamometer. Participants were required to follow the template as closely as possible with their output trace and were provided with verbal encouragement to ensure they achieved and maintained the correct force level. This contraction provided a stationary signal, sufficiently long to allow reliable decomposition of the EMG signal via EMGworks® 4.0 Analysis software (Delsys, Inc, Boston, MA, USA). The knee extensors were completely relaxed for 3 seconds, before and after the contraction (Figure 1B); visual inspection of the quiescent portions at either end of the signal confirmed that vastus lateralis was relaxed during these periods.18 If required, the dEMG sensor position was amended to ensure a minimum 4:1 signal to noise ratio was attained prior to recording. The dEMG array recorded 4 separate bipolar EMG signals via a Bagnoli 16-channel EMG system (Delsys, Inc, Boston, MA, USA); analog signals were low-pass (fourth-order Butterworth, 24 dB/octave slope, 1750 Hz cut-off) and high-pass (second-order Butterworth, 12 dB/octave slope, 20 Hz cut-off) filtered prior to sampling at a rate of 20 KHz.33, 34 Analysis of dEMG is described in full in supplementum: dEMG analysis. Excluding warm-up, assessment lasted ~7 minutes. Assessments of M-wave, MVC, and TRAP were repeated immediately following the time trial performance task. Post-exercise measurement protocols were identical to those described above (including the number of attempted MVC repetitions), except for the number of stimulation intensity increments required to elicit a plateau in evoked twitch torque, and that no warm-up contractions were completed prior to MVC due to the short transfer time from cycle ergometer to isokinetic dynamometer.
Participants transferred from the isokinetic dynamometer to the cycle ergometer and first cycled for 45 seconds at 70% of PPO, maintaining a fixed, self-selected cadence. During this 45-s period, sEMG was captured using the bipolar electrode array described above, sampled via Acknowledge® 3.8.1 software (Biopac Systems Inc, Goleta, CA, USA) integrated with Biopac MP100 hardware (Biopac Systems Inc, Goleta, CA, USA) at a sampling rate of 2000 Hz and anti-aliased with a 500 Hz low-pass filter and a 10 Hz high-pass filter. The Biopac MP100 system had an input impedance and common mode rejection ratio of 2 MΩ and > 110 dB, respectively. During all subsequent sEMG sampling during cycling exercise, the same self-selected cadence was adopted and maintained (93 ± 4 rpm). All sEMG signals captured throughout this period were normalized to the activity recorded at 70% of PPO.35 Ergometer positions were adjusted to suit each individual participant; positioning was recorded during familiarization and replicated for each participant throughout subsequent trials. Participants completed 120-min cycling at 95% of their lactate threshold; at 15-min intervals, and immediately following completion of the time trial, 10 mL of venous blood was obtained using a vacutainer containing ethylenediamine tetra-acetic acid, and stored on ice before being centrifuged at 3500 rpm for 10 minutes at 4°C. Aliquots of plasma were stored at −80°C until subsequent analysis. Plasma lactate and glucose were analyzed using enzymatic colorimetric methods on an automated analyzer (Ilab Aries, Instrumentation Laboratory, Warrington, UK). sEMG was also captured at 15-min intervals (30 s sampling window). sEMG signals were root mean square (RMS) processed; average RMS was calculated for a moving window 200 ms time period across the entire waveform.36 RMS processing was performed via the data collection software, in accordance with the manufacturer’s guidelines. Immediately following the 120 minutes cycle, participants completed a time trial performance task, during which no data were recorded. An individualized workload target was calculated: work target (J) = (0.7 · PPO) · 1800. A linear factor, 70% Wmax divided by preferred cadence (rpm2), was entered into the cycle ergometer.27, 37 Participants were instructed to complete their work target as quickly as possible; their progress toward completion was visible on a computer monitor directly in front of the ergometer. No further feedback nor encouragement was provided during the performance task. Such a time trial protocol has been previously validated by Jeukendrup et al37 and has shown high reliability.
2.4 Statistical analysis
Vastus lateralis M-wave could only be satisfactorily elicited via the femoral nerve in 15 of 20 individuals who were initially enrolled in the study. Thus, only data on 15 participants were collected. After data were assessed for normal distribution (Ryan-Joiner test), comparisons were performed using a three factor repeated measures (treatment [4] × period (order) [4] × time [2]) analysis of variance (ANOVA) for pre- to post-cycling comparisons, and (treatment [4] × period (order) [4] × time [8]) for sEMG, and (treatment [4] × period (order) [4] × time [10]) for blood lactate. If no significant effect of period was observed, then period was removed as a covariate and the analysis re-run. Tukey post hoc analysis was performed where appropriate (Minitab 18 statistical software; Minitab Ltd., Coventry, UK). If no significant effect of treatment was observed, data were pooled, and comparisons were performed using paired t test (pre-exercise vs. post-exercise). All data are presented as mean ± SD, with statistical significance set at P < .05. Where significant effects were observed, partial η2 effect sizes (η2p) were calculated by: η2p = SSconditions/(SSconditions + SSerror).
3 RESULTS
3.1 MVC
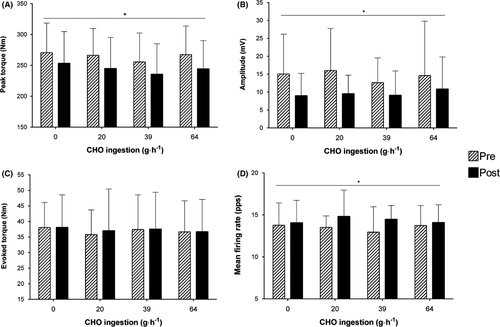
MVC peak torque significantly (F(1,14) = 9.42, P = .003, η2p = 0.10) declined by −21.5 Nm [95% CI: −27.89 to −15.12] (Figure 2A) following the cycle protocols with no significant treatment effect (P = .635) nor significant interaction (P = .99) between time x treatment.
3.2 M-Wave and peak evoked torque
M-wave peak-to-peak amplitude (F(1,14) = 12.11, P = .001, η2p = 0.12) and duration (F(1,14) = 9.79, P = .002, η2p = 0.09) significantly declined, following the cycle protocols, by −4.9 mV [95% CI: −7.81 to −2.13] and −7.1 ms [95% CI: −12.09 to −2.46], respectively, but with no differences between treatments (P = .75; P = .85), or interaction (P = .83; P = .27) between time x treatment (Figure 2B). Whereas, peak evoked torque remained unchanged following cycling (P = .86) with no differences between treatments (P = .94) and no interaction (P = .99) between time x treatment (Figure 2C).
3.3 sEMG amplitude
Throughout the 2-h steady-state cycle, RMS remained unchanged from the first measurement (15 minutes) (P = .287), with no difference between treatments (P = .120) (Table S3).
3.4 Motor unit firing characteristics
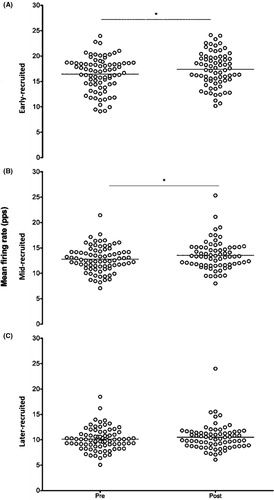
The total number of motor units detected during the submaximal TRAP contractions was not significantly different across time (P = .36) or treatment (P = .78) conditions (Table S1). Mean motor unit firing rate significantly (F(1,14) = 7.50, P = .007, η2p = 0.03) increased by 0.68 pps [95% CI: 0.22 to 1.14] (Figure 2D) following the cycling tasks. As there were no differences between treatments (P = .928), the 4 conditions were pooled and motor units were separated by tertiles; early-recruited motor unit mean firing rates significantly increased (t(59) = 2.23, P = .03) by 0.93 pps [95% CI: −0.71 to 2.57] and mid- (t(59) = 1.73, P = .01) by 0.74 pps [95% CI: −0.29 to 1.77] whereas, later-recruited (t(59) = 1.21, P = .196) firing rates did not change [95% CI: −0.67 to 0.21] (Figure 3).
3.5 Blood lactate and glucose
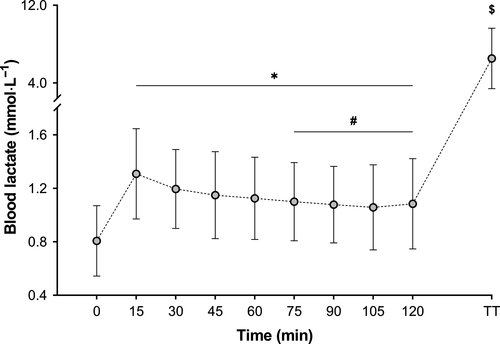
Blood lactate increased significantly (F(8,14) = 8.41, P < .001, η2p = 0.14) over time (Figure 4), but was not different between treatments (P = .27) nor was there an interaction between time x treatment (P = 1.00). Immediately following time trial completion, plasma glucose concentration was 4.80 ± 1.56 mmol L−1, 4.92 ± 1.73 mmol L−1, 4.77 ± 1.65 mmol L−1, and 4.92 ± 1.84 mmol L−1 for 0, 20, 39, and 64 g h−1, respectively.
3.6 Time trial performance
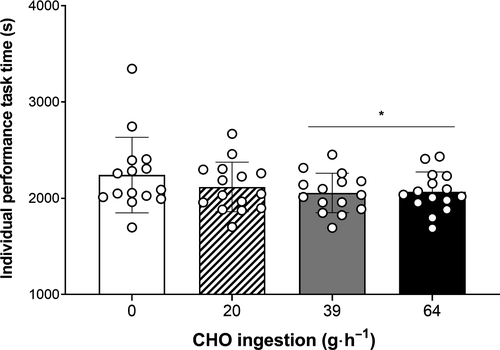
Time to complete the performance task was significantly (F(3,14) = 3.57, P = .022, η2p = 0.07) affected by treatment, with 39 g h−1 (−186.4 s, 8.3%) and 64 g h−1 (−174.9 s, 7.8%) both significantly faster than 0 g h−1 (2241.3 ± 392.9 s) (Figure 5). Power output sustained during the performance task was 247 ± 46 W, 260 ± 44 W, 267 ± 41 W, and 266 ± 43 W for 0, 20, 39, and 64 g⋅ h−1, respectively.
4 DISCUSSION
In this study, we aimed to investigate acute changes in motor unit firing patterns, following prolonged endurance exercise sustained until fatigue, with different rates of CHO ingestion. We hypothesized a reduction in motor unit firing rates among low threshold motor units, irrespective of CHO ingestion rate. Post-exercise fatigue was evident, with MVC reduced by ~9% for all CHO conditions. This decline in peak torque was accompanied by reduced M-wave amplitude and duration, but no change in peak evoked torque. Taken together, these findings appear symptomatic of CNS-derived fatigue. Concurrently, and in contrast to our hypothesis, the mean firing rate of motor units was seen to increase post-exercise. Specifically, this change was driven by elevated mean firing rates of early- and mid-recruited motor units, while the behavior of later-recruited motor units remained unchanged.
The performance task was completed faster when 39 g⋅h−1 (~180 s faster) and 64 g⋅h−1 (~175 s faster) were ingested compared with 0 g⋅h−1. This improved performance was not due to altered neuromuscular status at onset of the time trial task, as RMS remained unchanged throughout the 2-h steady-state cycle (from 15 minutes onwards) irrespective of CHO ingestion rate. We did not observe a characteristic progressive increase in sEMG amplitude that has traditionally been reported during sustained exercise,38, 39 nor indeed the decrease reported elsewhere, during prolonged cycling with intermittent increases in intensity.40 Instead, improved performance may be explained by metabolic regulation of endogenous liver glycogen stores during steady-state cycling.41 As a consequence of improved performance time, total exercise duration was shorter in 39 and 64 g·h−1 conditions than 0 g·h−1. Regardless of the duration, because the same amount of work had to be completed in the time trial performance task,27 it could be expected that participants reached a similar overall level of fatigue following completion of exercise on each trial day. This assertion is supported by the similar MVC decrement of 9% reported for all trials (Figure 2A). Our data appear to support the notion that absolute work completed, rather than intensity of work, is the determining factor for fatigue.25, 42 Thomas et al1 suggested that following different exercise durations (4, 20, and 40 km cycling time trials), the manifestation of fatigue was task-dependant. Shorter duration time trial tasks (~6 min) demonstrated a prevalence toward peripheral fatigue, in contrast to longer duration tasks (>30 min) which induced predominantly central fatigue, highlighted by decreased voluntary activation. Therefore, given the cycling task in the present study was ~ 2.5 h it would be expected that central processes were responsible for impairments in muscle function. However, the increased firing of early- and mid-recruited motor units we observed would appear to be a compensatory response, indicating that perhaps peripheral factors are still contributing to fatigue following this task.
Our observed reductions in MVC following prolonged endurance exercise are similar to those described elsewhere43-46 demonstrating that the exercise bout used induced similar levels of fatigue as in previously reported investigations. It is noteworthy that we observed no reduction in peak twitch torque. While these specific observations directly contrast the response reported following short-duration supramaximal cycling,47 suggesting that neural control of skeletal muscle is intensity- and duration-dependent, this finding is also in contrast to previous observations from longer cycling bouts.46, 48 Throughout the 2-h steady-state cycle, blood lactate concentration increased and remained elevated above baseline, with further increases to ~6.3 mmol L−1 (0, 20, 39, and 64 g h−1) observed immediately following the time trial task (Figure 4). Decreased extracellular pH, which accompanies elevated blood lactate concentration, has been seen to decrease M-wave amplitude.49 In agreement with our findings, previous investigations have reported reduced M-wave amplitude in the later stages of long-duration exercise,49 and following > 2-h cycling and running.50 Interestingly however, despite reduced M-wave amplitude, we observed no reduction in evoked torque, suggesting no change in rate of E-C coupling from pre- to post-exercise.51 Post-exercise decrease in M-wave amplitude suggests that action potential synaptic transmission may have become impaired. However, such impairment would indicate that some muscle fibers were not recruited by the stimulation, in which case evoked torque would also have been hampered. If we consider that M-wave, but not evoked torque, was impaired, then these changes may reinforce the suggestion that fatigue induced during endurance exercise is predominantly central in origin.1 It is understood that during endurance fatigue, excitation to the motor neuron pool increases as a compensatory mechanism for decreases in motor unit twitch force.52, 53 Increased motor unit firing rates have been reported during repeated contractions to failure.54, 55 It remains unclear, however, what central compensation our findings demonstrate, given the apparent lack of peripheral inhibition.
It is plausible that peripheral factors contributed more substantially than it would at first appear, to our observed functional impairments. We cannot rule out that measurement of evoked torque lacked the necessary sensitivity to detect these peripheral alterations. Given the time-sensitive nature of recordings post-exercise, coupled with the heavy volitional demand being placed on participants, it was not feasible to superimpose stimulation pulses over MVC in order to elucidate interpolated twitch; therefore, maximal activation was not assessed in the current study. While voluntary activation would have presented a valid assessment of peripheral fatigue,56 our priority was to capture motor unit firing behavior using dEMG. Nonetheless, caution is necessary when interpreting our present findings in relation to central fatigue. A potential counter to peripheral fatigue underlying our observed muscle impairments is that the sample of motor units assessed is intended to provide a snapshot of the entire motor unit pool for vastus lateralis; this does not describe the behavior of the motor unit pool as a whole. As such, while higher firing rates during contraction at the same absolute force may be a compensation for fatigue of muscle fibers, it is not possible to discern other aspects of the motor unit pool behavior. Although the same number of motor units was identified pre- and post-exercise (Table S1), and there were no observable alterations in recruitment threshold (Table S2), there may have been a reduction in the total number of motor units recruited at 70% of pre-exercise MVC (TRAP). Future research should endeavor to fully investigate peripheral fatigue alongside centrally driven fatigue responses. Nonetheless, despite uncertainty as to the source of fatigue during this exercise bout, the lack of differences between CHO dose remains striking and warrants further inquiry.
Two distinct methods to extract constituent MUAPTs from sEMG signals have been developed. Commonly, these methods are referred to as high density (HD) EMG,57 using blind source separation algorithm58; or precision decomposition EMG (dEMG),29, 54, 59 which relies on active electrodes, with small surface-electrode interface. Due to the blind source separation approach, HD EMG relies upon a large number of channels being sampled simultaneously, typically utilizing grids of ~16 electrodes.60 These large grids are highly dependent on positioning relative to the muscle and could be susceptible to a loss of sensitivity if there is a change in muscle architecture, as all channels must be included in the decomposition algorithm, regardless of signal quality. With this in mind, it may be considered preferable to utilize a small surface-electrode interface (as with dEMG) in situations where a change in muscle architecture is expected, such as in the knee extensors following cycling exercise.61 While we cannot be sure that the same motor units were recorded pre- and post-exercise, nor across different conditions, we observed no difference in the total number of motor units recruited (~30 per trial), nor the accuracy of decomposition (~92%), across measurements (Table S1). In contrast to our hypothesis, fatigue was accompanied by an increase in mean motor unit firing rate of earlier-recruited motor units. Previously, Stock et al11 observed a decrease in motor unit firing rates following an acute isometric fatiguing protocol, reiterating the previously discussed point that fatigue is task specific. Our observed increase in overall mean firing rate was driven by early- (+0.93 pps) and mid-recruited motor units (+0.74 pps). De Luca et al62 reported that motor units are recruited in a predictable and reliable fashion according to the “onion skin” principle. This principle describes an inverse relationship between motor unit firing rate and recruitment threshold (Figure 6). With the “onion skin” principle in mind, coupled with the order of size recruitment principle,63 our results could suggest that elevated firing rates are occurring in those motor units associated with fatigue-resistant (type I) muscle fibers.64 In this instance, earlier-recruited motor units increase their firing rates following fatigue-inducing exercise, to generate the same absolute force compared with pre-exercise firing rates.
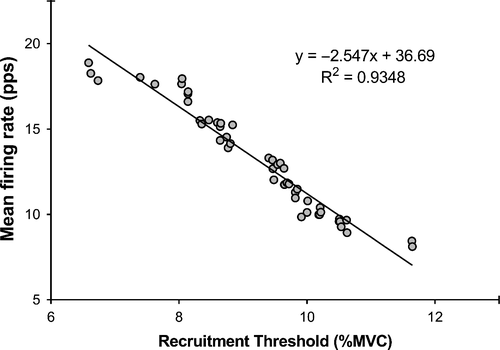
It is interesting that motor unit firing rate increased post-fatigue to a similar extent irrespective of CHO dose ingested. While CHO ingestion ≥ 39 g h−1 facilitated improved time trial performance, the work-matched nature of the task resulted in similar fatigue status post-exercise. Given the reported impact of CHO sensing65, 66 and ingestion67 on neuromuscular drive, it may have been expected that the observed increase in post-exercise firing rate could be directly related to CHO availability. However, we observed no difference in the firing rate response between 0 g h−1 and 20, 39, or 64 g h−1 CHO ingestion rates (Figure 2D). This finding suggests that CHO-modified afferent signaling is (at least, exclusively) not responsible for increasing neuromuscular drive when compensating for fatigue-induced functional impairment.
In conclusion, this is the first study to report increased motor unit firing rates, specifically of earlier-recruited motor units, following endurance cycling activity. Since motor unit firing was observed pre- and post-exercise, at the same absolute contraction force (70% of pre-exercise MVC), it appears that central drive to early- and mid-recruited motor units was altered, increasing mean firing rate to achieve the required force output. Additionally, we have shown for the first time that CHO ingestion during prolonged, work-matched exercise, has no impact on subsequent fatigue-induced alterations in neuromuscular recruitment.
5 PERSPECTIVE
CHO supplementation is routinely used by athletes during endurance activity to avoid glycogen depletion, therefore sustaining performance.68 However, uncertainty exists over the impact of different CHO doses on neuromuscular function following an exhaustive performance task. This is the first study in a well-trained group of cyclists to characterize motor unit governed fatigue following prolonged exhaustive endurance exercise under conditions of altered exogenous CHO availability. Extent of fatigue was similar irrespective of CHO dose and corresponding performance task completion time; likely fatigue compensatory effects were observed through increases in firing of low-mid threshold motor units. As these motor units activate slow to mid twitch muscle fibers, this insight brings novel and important information to athletes, coaches, and practitioners seeking to plan recovery and subsequent training from endurance tasks that include exhaustive performance tasks with or without CHO supplementation.
ACKNOWLEDGMENTS
Funding for the present work was provided by Lucozade Ribena Suntory Ltd., Uxbridge, UK to University of Stirling. We would like to thank 1) Dr Paola Contessa for technical support concerning dEMG; 2) Mr Zacharias Nikolaou for assistance during data analysis; and 3) Ms Gillian Dreczkowski for her technical assistance.


