Experimental and analytical study on the load-bearing capacity of segmented tower structures with dry joints under combined loading
Abstract
In recent years, hybrid towers have become increasingly established, especially for tall wind turbines. The concrete part of these towers, commonly constructed using segmental construction methods, consists of several circular ring segments stacked on top of each other. To reduce the amount of fabrication and erection effort, the joints between the segments are typically designed as dry ground joints. This paper deals with experimental investigations to determine the torsional load-bearing capacity of such dry ground concrete joints subjected to combined loading of prestressing, bending, and torsion. Based on the experience of previous investigations, a test set-up consisting of three reinforced concrete segments with circular ring cross-sections was developed. The herein newly developed evaluation concept enabled precise identification of the failure point for each test run utilizing the measured tangential displacements of the joint. The test results clarify the weaknesses of the current design model regarding the insufficient interaction with the bending moment and show very good accordance with the new calculation model, the so-called fiber model.
1 INTRODUCTION
1.1 Motivation
Wind energy is leading the way in the use of renewable energy for electricity generation. Wind turbines already account for the largest share in the generation of electricity from renewable energies in Germany.1 In order to increase the performance of wind turbines, the trend is towards taller towers, larger rotor blades and more powerful generators. Especially for large hub heights, so-called hybrid towers have been successfully established in recent years. According to Huang et al.,2 towers with hub heights of over 160 m are possible with this construction method and have already been implemented in numerous plants. Hybrid towers consist of two parts (Figure 1). The upper part is composed of several steel sections, whereas the lower part consists of stacked concrete ring segments. The individual concrete segments are connected by external tendons placed inside the tower and anchored in the foundation and the transition piece (Hau,3 Von der Haar and Marx,4 Alvarez-Anton et al.,5 Malliotakis et al.6). The horizontal joints that inevitably occur between the concrete segments are usually designed as dry joints. Due to the lack of a leveling layer in the joint, there are increased demands on the surface accuracy of the segments (Frey et al.7). Therefore, the joint surfaces are ground during the production using CNC-controlled grinding machines in order to exclude major unevenness (Bögl et al.8).
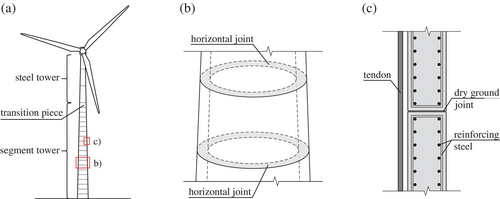
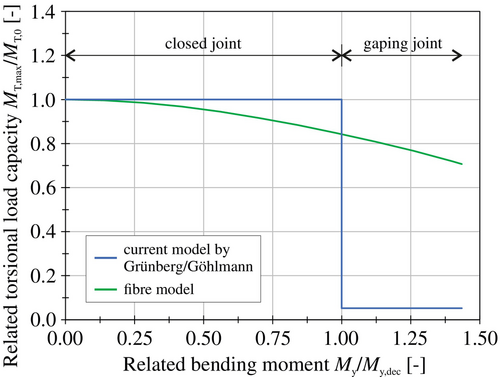
Wind turbines are subjected to large horizontal loads. These cause combined effects of bending, shear, and torsion on the tower structure. Particular attention should be paid to the shear stresses resulting from shear forces and torsion. The shear stresses have to be transferred via the dry horizontal joints between the individual concrete segments. The shear stress transmission in such dry joints is only ensured by the friction resulting from the self-weight and the externally applied prestressing force in combination with the friction coefficient of the joints. The current calculation model to determine the torsional load-bearing capacity of dry ground joints under combined loading of prestressing, bending, shear force and torsion is based on the theory of Grünberg and Göhlmann.10 However, several studies (Hartwig and Marx,11 Kang et al.12) have shown significant weaknesses in this calculation model, leading to unrealistic evaluations of the torsional load-bearing capacity. As a result, Hartwig et al.13, 14 proposed a so-called fiber model to calculate the torsional load-bearing capacity of dry ground joints more accurately. The principal results of both calculation models are illustrated in Figure 2. There are significant differences in both the torsional load-bearing capacities calculated and the characteristics of the curves. The current model, based on Grünberg and Göhlmann,10 assumes a two-state phenomenon for the torsional load-bearing capacity, with a sharp decrease occurring when the joint begins to gap. In contrast, the fiber model indicates, that the torsional load-bearing capacity decreases gradually with increasing bending loads.
1.2 Investigation objectives
In order to estimate the accuracy of the aforementioned calculation models in predicting the torsional load-bearing capacity, experimental investigations are necessary. These experimental tests are discussed in this work. The aim of these tests is to determine the actual torsional load-bearing capacity of dry ground concrete joints with a circular ring cross-section under a combined loading of prestressing, bending, and torsion. As a result, an evaluation of the accuracy of the existing calculation models is made. These tests serve exclusively to investigate the torsional load-bearing capacity of such dry joints. Other meaningful topics, such as the investigation of the global load-bearing behavior of segmented wind turbine towers under combined bending and shear loads or the gaping behavior of towers with dry joints, are not considered and remain beyond the scope of this paper.
2 PREVIOUS EXPERIMENTAL INVESTIGATIONS ON THE TORSIONAL LOAD-BEARING BEHAVIOR OF DRY GROUND SEGMENTAL JOINTS
In recent years, several experimental investigations have already been carried out on the torsional load-bearing behavior of dry ground joints. These include the tests by Hartwig and Marx13 on a small tower consisting of six aluminium tube segments stacked on top of each other (Figure 3a). With these small-scale tests, it was possible to investigate the load-bearing capacity of the ground joints between the aluminium segments under a combined load of prestressing, bending, and torsion. Especially, the low tower height and the small number of joint levels proved to be an advantage of the test set-up for investigating the joint load-bearing capacity. However, due to the different material behavior and the only very small segment dimensions, there is only a limited transferability of these test results to concrete joints of wind turbine towers.
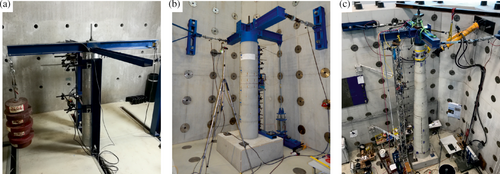
In addition, Hartwig and Marx15 have already carried out investigations on the load-bearing behavior of dry joints between reinforced concrete segments. Six cylindrical circular ring segments were stacked on top of each other and investigated under a combined load of prestressing, bending, and torsion (Figure 3b). However, due to cracking in the reinforced concrete segments and the exclusive measurement of global displacements of the entire tower structure at the load introduction cross, the joint load-bearing capacity could not be determined with the required accuracy.
Furthermore, Klein et al.9 have also conducted tests on the joint load-bearing behavior between reinforced concrete segments. A tower structure consisting of 16 stacked circular ring segments was subjected to a combined load of prestressing, bending, shear force and torsion (Figure 3c). As a result of these large-scale tests, a great amount of knowledge was gained about the global load-bearing behavior of tower structures with dry joints. In contrast, the local load-bearing behavior at the joint level could not be tested in detail. In particular, the investigation of the joint load-bearing capacity includes large displacements of the segments. The large tower height of about 7.5 m and the consequently increased risk of a potential stability failure of the entire tower structure, as well as the difficult access to the failure area, proved to be disadvantageous for such tests.
In order to carry out experimental studies on the torsional load-bearing capacity of dry ground concrete joints, the preceding investigations need to be combined. Only tests on a tower section with a few reinforced concrete segment levels and a detailed measurement system at joint level can investigate the torsional load-bearing capacity of dry joints with the required accuracy.
3 EXPERIMENTAL PROGRAM
3.1 Test set-up
Based on the experience gained from previous investigations, a test and measurement concept was developed which is suitable for experimentally investigating the torsional load-bearing capacity of dry ground concrete joints with circular ring cross-section. As shown in Figures 4 and 5, the investigated tower structure consists of three stacked segments. The segments have a wall thickness of 0.04 m, a height of 0.409 m and a conical shape. The outer diameter of the upper segment is 0.513 m at the top, while the lower segment has an outer diameter of 0.625 m at the bottom. Compared to real segments of hybrid wind turbine towers, the dimensions approximately correspond to a scale of 1:10.
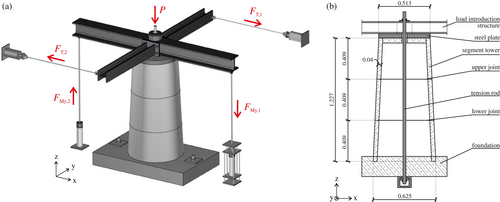
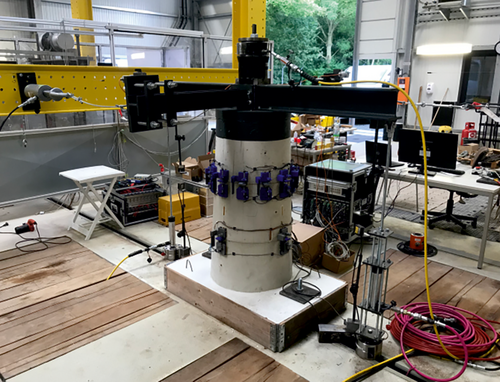
The lower segment is aligned horizontally and concreted into the foundation to an embedding depth of approximately 0.05 m. The foundation is anchored by two anchor rods in the strong floor. To apply the various loads, a load introduction cross at the tower head has been used. In order to ensure a form- and force-fit connection between the upper segment and the load introduction cross, a steel plate is monolithically connected to the upper segment and the load introduction cross is bolted to this plate (Figure 4). The prestressing force is applied via a tension rod located centrally inside the tower and is anchored both in the strong floor and at the top of the load introduction structure. The tension rod is made of St 835/1035 steel and has a diameter of 30 mm. In actual wind turbine tower structures, the prestressing is applied via tendons positioned circumferentially inside the tower (Figure 1c). This arrangement results in a favorable restoring effect of the tendons, especially when the system is in a decompressed state. However, since the focus of the tests is on the torsional load-bearing capacity of the dry joint, the simplification via a central tension rod is sufficient. The steel girders of the load introduction cross act as lever arms to introduce the bending and torsional moments. The application of the bending moment is realized via a vertical force pair with a lever arm of 2 m (FMy,1 and FMy,2) and the torsional moment is subjected using a horizontal force pair with a lever arm of 1.7 m (FT,1 and FT,2). The load application via force pairs ensures that no additional normal or shear forces are introduced into the system during the test.
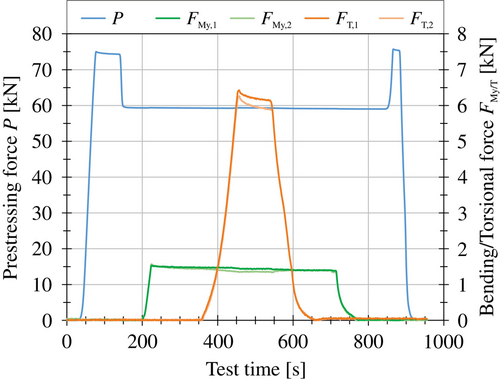
The different forces are applied via hydraulic cylinders. Each load component has its own hydraulic circuit, allowing an individual control of the various loads. This is essential as the tests require a specific load sequence (Figure 6). First, the prestressing force is applied, which enables the application of further loads. After the prestressing force, the tower is subjected to the bending moment. Subsequently, the torsional moment is applied and increased until the tower structure fails in form of a joint sliding.
3.2 Test specimens
The three segments of the tower structure were manufactured in the precast plant of Max Bögl Wind AG. The concrete segments are reinforced in one layer in the longitudinal and transverse directions. The circumferential reinforcement has a diameter of 6 mm and is placed every 10 cm. The longitudinal reinforcement also has a diameter of 6 mm and is laid approximately every 30 cm. A corresponding reinforcement cage is shown in Figure 7.

Due to the lack of leveling material in the joints, segmental structures with dry joints have increased demands on the accuracy of the segment surfaces. Experimental and numerical investigations show that even small deviations, especially regarding the flatness and the shape accuracy of the segment surfaces, have a great impact on the stress distribution in the joint and in the segment as well as on the joint load-bearing capacity (Fürll et al.,16 Jonscher et al.,17 Theiler et al.18). Several measures were taken during the segment production to meet the increased accuracy requirements. Precise steel formwork was used to ensure the accuracy of fit and shape of the segments. Due to the conicity, each segment had to be produced with its own formwork. Furthermore, as shown in the Figure 7, the segment surfaces were ground using CNC-controlled grinding machines to avoid any major unevenness, which corresponds to the production of real segments of wind turbines. This process can produce joint surfaces with maximum unevenness in the range of tenths of a millimeter on real segments of wind turbines (Fürll et al.,16 Behrmann et al.19). Due to the significantly smaller dimensions of the model segments and the comparable grinding process, even smaller deviations can be expected for the joint surfaces of the model segments.
3.3 Material properties
The material properties of the reinforced concrete segments were determined by cylinder compression tests. For this purpose, material tests were carried out on three cylinder specimens. The resulting mean values of the Young's modulus Ec,m and the compressive strength fc,m are shown in Table 1. According to the material properties determined, the concrete can be classified in the strength class C70/85.
| Material characteristics | ||
|---|---|---|
| Compressive strength | fc,m | 83 MPa |
| Young's modulus | Ec,m | 42,274 MPa |
As the tests investigate the sliding failure of dry joints, especially the frictional properties of the segment surfaces have a major influence on the joint load-bearing capacities achieved. Eurocode 220 and Model Code 201021 specify friction coefficients for interfaces between concrete cast at different times. These parameters can also be used to characterize dry joints between precast elements. According to Eurocode 2,20 a coefficient of friction μ of 0.5 should be applied to ground concrete surfaces, which are classified as very smooth surfaces. However, experimental investigations on the friction coefficient of ground concrete surfaces show that this assumption often significantly underestimates the real coefficients of friction and consequently does not represent the full load-bearing potential of dry segmental joints. The Model Code 201021 suggests a friction coefficient in a range between 0.5 and 0.7 for smooth interfaces. This advice corresponds with experimental investigations of Hartwig et al.,22 Schoening et al.23 and Zhou et al.24 An approximation of the actual friction coefficient of the segment surfaces can be determined using the tower tests. The results are shown in Section 4.3. In addition, the coefficient of friction is significantly influenced by the roughness of the segment surfaces (Mohamad et al.,25 Tassios and Vintzeleou26). In the context of this paper, only the experimental determination of the friction coefficient is discussed. Roughness measurements are not addressed.
3.4 Measurement set-up
Various measurement techniques are used to analyze the joint load-bearing capacity in detail. The prestressing force is measured via a strain gauge on the tension rod. This strain gauge was calibrated before the tests so that the measured strain can be unambiguously related to an acting prestressing force. The forces of the bending and torsional moment are measured by load cells. As shown in Figure 8, the load cells are attached to the hydraulic cylinders or to the load introduction cross.
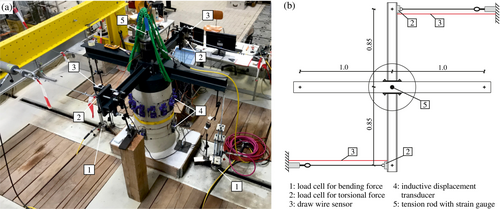
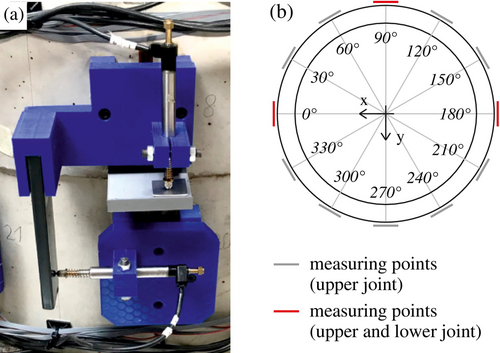
Under the combined loading, the failure of the tower structure is characterized by a joint sliding. As a result of the conical shape of the tower structure, the upper joint has the lowest cross-sectional resistance to sliding. In addition, due to the test set-up and the load application, it can be assumed, that the normal force and bending moment are almost constant along the tower height. This inevitably leads to a sliding of the upper joint during the test. Therefore, the tangential displacements of the upper joint are monitored in detail using inductive displacement transducers. As shown in Figure 9, 12 inductive displacement transducers are used, evenly distributed around the circumference. In order to control the behavior of the lower joint, its tangential displacements are also recorded at three points. Besides, the total rotation of the tower structure is measured by means of draw-wire sensors attached to the load introduction cross (Figure 8).
3.5 Determination of the load level
4 RESULTS OF EXPERIMENTAL INVESTIGATIONS
4.1 Definition of the failure point
In addition to the scaling of the loads, the definition of the failure point has also a significant importance for the execution and evaluation of the tests. In general, the failure of the tower structure is characterized by a sliding of the upper joint. From a mechanical point of view, the sliding describes the change of a motion status where the joint changes from the sticking to the sliding status. Therefore, the accurate detection of the transition between the sticking and sliding status is essential for defining the failure point. The measured tangential displacements st of the upper joint are used to determine the start of the joint sliding. However, the recorded displacements are not suitable as a direct indicator of the failure point, as they do not contain any information about the time-related change in displacement and thus about the motion status of the joint. Therefore, by differentiating the tangential displacement with respect to time, a conversion is made to the displacement velocity vt, which indicates the motion status of the joint. The identification of changes in motion status is best achieved by a further differentiation of the displacement velocity with respect to time. This allows to determine the change in displacement velocity (displacement acceleration at) and thus to detect the beginning of the sliding. As long as the joint is in the sticking state, there is almost no movement (vt ≈0) of the joint. For this status, a displacement acceleration of at,stick ≈0 occurs. The transition to the sliding state is accompanied by an increase in the displacement velocity. There is a sudden change in the displacement acceleration, which appears as a kink in the curve (Figure 10). This kink is defined as the failure point.
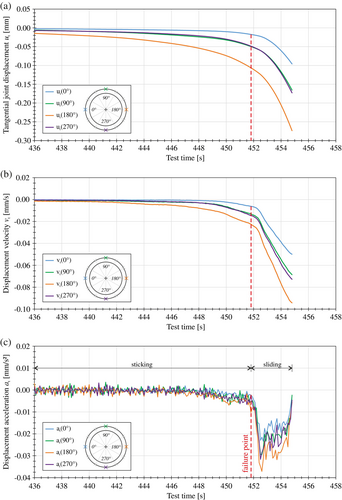
With this analysis method it is possible to define the transition between the sticking and sliding status of the joint as precisely as possible. This means that the failure point can be clearly and reproducibly identified for each test run, regardless of the existing bending level. Accordingly, the comparability of the different test runs is based on this.
Generally, there are also other possibilities for the detection of the failure point, such as using the measured torsional moment-displacement-curves. Both the local displacements of the joint (Figure 11) and the global displacements of the entire tower measured at the load introduction cross can be used (Figure 12). First, it is possible to determine the failure point from the significant kink in the curve. Second, the failure point can be defined as the limit load when the horizontal line of the torsional moment-displacement-curve is reached.
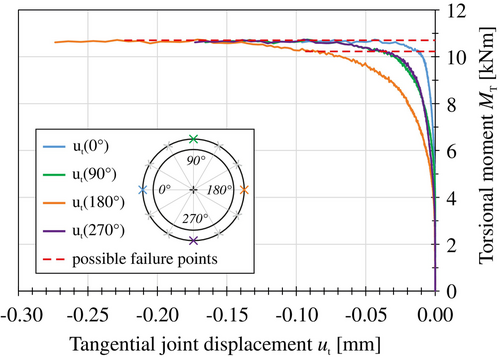
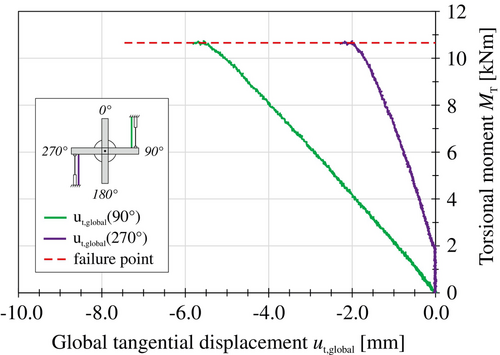
For the analysis methods via the torsional moment-displacement-curves, it is important to note that the measured displacements do not directly indicate the motion status of the joint. Thus, only indirect conclusions can be drawn about a sliding. Furthermore, in contrast to the analysis method using the displacement acceleration, it is not possible to unambiguously identify the failure point for all test runs. Especially for large bending moments, the curves gradually flatten, leaving room for interpretation in detecting the significant kink in the curve. Additionally, it is not guaranteed that a horizontal line of the load–displacement curve will be formed for all areas of the joint under large bending loads. However, the same definition of the failure point independent of the applied bending level is essential to ensure the comparability of the test results. For these reasons, the failure point is determined by the displacement acceleration for all tests conducted according to Figure 10.
4.2 Torsional load-bearing capacity
Based on the definition of the failure point, the test results can be analyzed regarding the torsional load-bearing capacity. For the two prestressing levels investigated, the resulting torsional load-bearing capacity curves as a function of the applied bending moment are shown in Figures 13 and 14. It can be recognized that the torsional load-bearing capacity of the dry joint decreases with an increasing bending moment. This reduction occurs even when the joint is completely under pressure. When the decompression moment is reached, about 90% of the torsional load-bearing capacity is still available compared to the load condition without an applied bending moment. After exceeding the decompression moment, the uniform decrease continues. A sudden drop in the torsional load-bearing capacity during the transition to the gaping state cannot be observed.
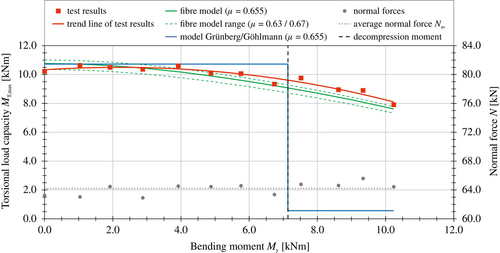
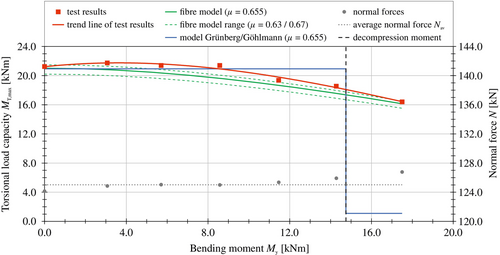
In addition to the torsional load-bearing capacity, the normal forces applied during each test run are also shown in Figures 13 and 14. The normal force N is composed of the prestressing force Pm0 and the self-weight of the load introduction cross (310 kg) and the upper segment (62 kg). It is evident that the normal force remains almost identical, regardless of the bending level applied (Tables 2 and 3). This is due to the load application of the bending moment via a vertical force pair. For the prestressing level of 60 kN, the average normal force over the entire bending moment range is Nav = 64.2 kN. Similarly, for the prestressing level of 120 kN, the average normal force is Nav = 125.3 kN.
| No. | Pm0 [kN] | N [kN] | My [kNm] | MT,max [kNm] |
|---|---|---|---|---|
| 1 | 59.60 | 63.25 | 0 | 10.21 |
| 2 | 59.39 | 63.04 | 1.04 | 10.63 |
| 3 | 60,82 | 64.47 | 1.92 | 10.50 |
| 4 | 59.26 | 62.91 | 2.88 | 10.36 |
| 5 | 60.88 | 64.53 | 3.92 | 10.59 |
| 6 | 60.81 | 64.46 | 4.88 | 10.09 |
| 7 | 60.93 | 64.58 | 5.76 | 10.06 |
| 8 | 59.72 | 63.37 | 6.74 | 9.33 |
| 9 | 61.13 | 64.78 | 7.52 | 9.76 |
| 10 | 60.97 | 64.62 | 8.62 | 8.95 |
| 11 | 61.94 | 65.59 | 9.34 | 8.90 |
| 12 | 60.79 | 64.44 | 10.24 | 7.90 |
| No. | Pm0 [kN] | N [kN] | My [kNm] | MT,max [kNm] |
|---|---|---|---|---|
| 1 | 120.48 | 124.13 | 0 | 21.21 |
| 2 | 121.20 | 124.85 | 3.07 | 21.73 |
| 3 | 121.38 | 125.03 | 5.71 | 21.38 |
| 4 | 121.34 | 124.99 | 8.58 | 21.37 |
| 5 | 121.70 | 125.35 | 11.46 | 19.34 |
| 6 | 122.26 | 125.91 | 14.28 | 18.54 |
| 7 | 123.28 | 126.93 | 17.50 | 16.40 |
4.3 Coefficient of friction
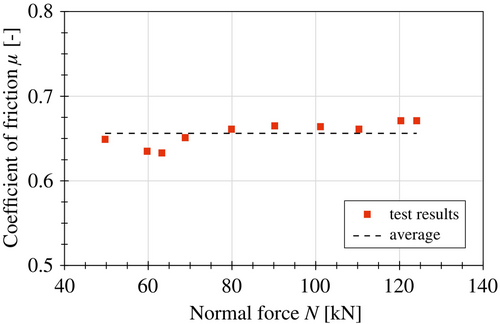
The results are shown in Figure 15 and Table 4. The coefficients of friction vary between 0.63 and 0.67 depending on the test runs. The average coefficient of friction for all tests is 0.655. Consequently, the results are consistent with previous studies of the friction coefficient of ground concrete surfaces (Section 3.3). An investigation of the dependence on the normal stress level applied is not expedient due to the small sample size and the fact that only a small normal stress range was examined.
| No. | Pm0 [kN] | N [kN] | MT,max [kNm] | μ [−] |
|---|---|---|---|---|
| 1 | 46.06 | 49.71 | 8.20 | 0.647 |
| 2 | 56.10 | 59.75 | 9.67 | 0.635 |
| 3 | 59.60 | 63.25 | 10.21 | 0.633 |
| 4 | 65.20 | 68.85 | 11.43 | 0.651 |
| 5 | 76.23 | 79.88 | 13.44 | 0.660 |
| 6 | 86.56 | 90.21 | 15.27 | 0.664 |
| 7 | 97.47 | 101.12 | 17.10 | 0.663 |
| 8 | 106.68 | 110.33 | 18.57 | 0.660 |
| 9 | 116.67 | 120.32 | 20.56 | 0.670 |
| 10 | 120.48 | 124.13 | 21.21 | 0.670 |
Furthermore, it should be noted that the torsional load-bearing capacities determined are not only dependent on the parameters in Equation (4), but are strongly influenced by imperfections at the joint surfaces (Fürll et al.16). For this reason, the friction coefficients calculated in this way are only approximations of the actual coefficients of friction.
4.4 Comparison with analytical calculation models
Previous investigations by Hartwig et al.11 and Kang et al.12 have already shown that this calculation model only very inaccurately describes the real load-bearing capacity of dry joints under combined loading of prestressing, bending, and torsion. This can be confirmed by comparison with the test results. As shown in Figures 13 and 14, there are decisive differences between the test and calculation results, both with regard to the load-bearing capacities determined and the characteristics of the curves. Due to the simplification of the torsional load-bearing capacity as a two-state phenomenon, the calculation model does not correctly represent the measured uniform decrease of the torsional load-bearing capacity with increasing bending loads. In the range of a fully compressed joint, the real torsional load-bearing capacity is overestimated. However, after reaching the decompression moment, the torsional load-bearing capacity is significantly underestimated. The sudden drop in the curve when the decompression moment is reached cannot be identified in the test results. Consequently, the current calculation model is not suitable for determining the actual load-bearing capacity of dry ground joints.
The results of the fiber model are shown in Figures 13 and 14. For both prestressing levels investigated, the comparison with the test results demonstrates good accordance over the entire bending load range. Both the characteristics of the curves and the determined values of the torsional load-bearing capacities agree well with each other. The fiber model represents the measured uniform decrease of the torsional load-bearing capacity with an increasing bending moment very well. Depending on the bending level and the coefficient of friction which is used for the calculation, different deviations occur between the test results and the fiber model. At a prestressing level of 60 kN, the average deviation over the entire bending load range is 3.9% for a friction coefficient of 0.655. The deviations increase slightly with greater bending loads. At the maximum, the deviations amount to 9.2%. Except for low bending moments, the results of the fiber model are always slightly below the test results. Similar correlations are also observed for the prestressing level of 120 kN. Accordingly, there are deviations of 4.1% on average and 8.2% at the maximum. For each calculation with the fiber model, the average normal forces Nav were used. The comparison between the test results and the fiber model indicates that the fiber model is a good representation of the real load-bearing capacity of dry joints under a combined load of prestressing, bending, and torsion. The existing minor deviations are due to uncertainties in the determination of the coefficient of friction and to the neglect of the influence of imperfections. Numerical investigations by Fürll et al.16 show that imperfections on the joint surfaces can lead to deviations in the load-bearing capacity of up to 10%.
5 CONCLUSION AND OUTLOOK
- An increasing bending load leads to a uniform decrease in the torsional load-bearing capacity. The decrease already starts in the fully compressed state of the joint and continues in the gaping state.
- The test results reveal the weaknesses of the current calculation model according to Grünberg and Göhlmann.10 Due to the simplification as a two-state phenomenon, the calculation model cannot represent the uniform decrease in the torsional load-bearing capacity with increasing bending loads. Consequently, this calculation model proves inadequate for accurately determining the torsional load-bearing capacity of dry ground concrete joints with a circular ring cross-section.
- The test results show very good agreement with the fiber model according to Hartwig et al.13, 14 regardless of the prestressing and bending level. The maximum deviations are less than 10%. Therefore, the fiber model can be considered applicable for determining the torsional load-bearing capacity of dry ground concrete joints under a combined loading of prestressing, bending, and torsion.
So far, only experimental investigations have been carried out without taking shear force into account. However, in order to represent the real load conditions of wind turbines, it is essential to add the shear load component to these tests. In this way, the accuracy of the calculation models for a combined load of prestressing, bending, shear force and torsion can also be checked. Furthermore, the influence of imperfections on the joint surfaces should be investigated experimentally. In this context, the effects of the imperfections on the joint load-bearing capacity and on the load-bearing capacity at the material level are of interest. In order to detect the occurring imperfections, an accurate measurement of the segments is required before the tests. 3D scanning methods as applied, for example, in Kim et al.27 and Hasan et al.,28 are suitable for verifying the accuracies of concrete segments. Moreover, in real wind turbine towers, vertical joints divide the circular ring segments into half, third or quarter shells to reduce the transport and erection effort (de Lana et al.29). Analytical and numerical investigations by Klein and Marx30-32 show that the introduction of vertical joints leads to a significantly more complex joint load-bearing behavior of the tower structure. According to numerical calculations by Hartwig et al.,33 the use of half-shell segments results in a significant reduction in the torsional load-bearing capacity of the horizontal joint of up to 40% compared to circular ring segments, even in the fully compressed state of the joint. Experimental investigations on segmented tower structures with vertical joints will help to better understand these findings. The developed test and measurement concept as well as the analysis method can serve as a basis for these investigations.
ACKNOWLEDGMENTS
The studies within the joint research project SMARTower (Funding code: 03EE2041A) are funded by the German Federal Ministry for Economic Affairs and Climate Action. The authors would like to thank the funding body and all project participants for their constructive cooperation. Open Access funding enabled and organized by Projekt DEAL.
Biographies

Florian Fürll, Institute of Concrete Structures, Technische Universität Dresden, Dresden 01062, Germany. Email: [email protected]

Fabian Klein, MKP GmbH, Hannover 30163, Germany. Email: [email protected]

Steffen Hartwig, Meihorst und Partner GmbH, Hannover 30655, Germany. Email: [email protected]

Chongjie Kang, Institute of Concrete Structures, Technische Universität Dresden, Dresden 01062, Germany. Email: [email protected]

Thorsten Betz, Max Bögl Wind AG, Neumarkt in der Oberpfalz 92301, Germany. Email: [email protected]

Steffen Marx, Institute of Concrete Structures, Technische Universität Dresden, Dresden 01062, Germany. Email: [email protected]
Open Research
DATA AVAILABILITY STATEMENT
The data supporting the findings of this study are available from the corresponding author on reasonable request.


