Effect of fiber type, size, and utilization rate on mechanical and thermal properties of lightweight concrete facade panels
Abstract
It was understood that various studies were carried out on the strength, permeability, durability, increasing the thermal performance of lightweight concrete facade panels, and sustainable and energy-efficient concepts. It was observed that fiber was added to the mixture to improve the properties in question. However, it was determined that contradictory results were obtained due to the large number of active parameters and whether the fiber was distributed homogeneously in the matrix. In this study, the effects of fiber type, length and usage rate on the strength, energy absorption capacity, elasticity modulus, water absorption, and thermal performance of lightweight concrete mixtures were investigated. For this purpose, three different types of fibers of different lengths: polypropylene (3, 6, and 12 mm), glass (13 and 25 mm) and polyamide (6 and 12 mm) were used at 0%, 0.25%, 0.50%, and 0.75% of the total volume. It was determined that the mixture containing 0.25% polypropylene fiber with a length of 3 mm exhibited the best performance in terms of both mechanical and thermal properties. In terms of these features, it was understood that the mixtures with 12 mm polypropylene with a usage rate of 0.75% and 6 mm polyamide fibers with a usage rate of 0.50% had the weakest performance.
1 INTRODUCTION
With the increase in population and the global climate crisis, reducing energy consumption in the construction process has become increasingly important. New regulations introduced by the Paris Climate Agreement have led to a noticeable increase in efforts to reduce energy consumption in buildings.1-3 It was reported by Calleri et al.4 that the building envelope is the most crucial element affecting the energy requirements of building components.
It was emphasized that one of the most effective strategies for achieving optimal energy consumption in buildings is to improve the insulation of the building envelope.5, 6 Typically, these conditions can be achieved by incorporating an insulation layer into the building envelope.7 Various insulation materials were used for this purpose, including expanded polystyrene (EPS) foam,8 mineral wool,9 and fiberglass.10, 11 In recent times, several studies were conducted to enhance the energy efficiency performance of concrete elements that make up the building envelope.12, 13 In this regard, one of the most commonly applied methods was the use of lightweight concrete (LWC) facade panels.14 Two examples of buildings where LWC facade panels were installed are shown in Figure 1.

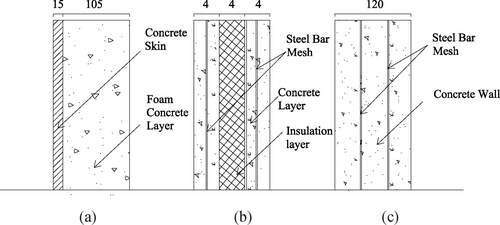
The strength properties of LWC used in facade panels are known to be lower than traditional concrete, while their insulation performance is higher.17, 18 However, it was emphasized that the superior insulation performance of LWC can sometimes be insufficient in meeting these criteria.19, 18 In this regard, it was reported by Shao12 that the insulation performance of LWC facade panels can be enhanced by adding an insulation layer. The building involves separate application of the structure, building envelope, and insulation layer in such cases. Consequently, it was noted that problems can arise when the connections between these layers are not properly established.4 Therefore, limiting the number of layers is believed to reduce performance defects. Examples of cross-sections for single and multi-layer LWC facade panels are shown in Figure 2.
It was understood that the embodied energy density of traditional and LWC ranges between 0.74–3.5 and 0.9–2.2 MJ/kg, respectively.20, 21 However, materials used as insulation, such as fiberglass and polystyrene, have reported embodied energy densities ranging from 14–28 and 105–115 MJ/kg, respectively.22 This implies that the energy consumption during the production of insulation materials is higher. Additionally, it was noted by Caleri et al.4 that the embodied carbon dioxide (CO2) content of concrete ranges from 0.02 to 0.1 kgCO2/kg, whereas for fiberglass, it is 0.42 kgCO2/kg. Due to these reasons, it is believed that improving the thermal performance of concrete rather than adding a separate insulation layer to LWC panels is a more accurate method to achieve energy efficiency in buildings.
Numerous investigations on the enhancement of LWC's thermal properties have been done in the literature. Some of these are outlined here.
In a study conducted,23 it was emphasized that the thermal conductivity coefficient (TCC) of traditional concrete with a TCC of 0.73 W/mK could be improved by 73% by substituting fine limestone aggregates with lightweight aggregates (LWA). However, it was reported that the strength performance decreased by 51%. In a study by Yan Zhou et al.,24 it was highlighted that containing expanded perlite had a significantly lower TCC compared to vermiculite-aggregate concrete. The authors reported that the TCC was strongly related to the unit volume weight of the mixture. In another study25 reported in their study on air-entrained LWA concrete that an increase in void volume led to a decrease in elastic modulus and strength performance, but positively affected thermal insulation performance.
In a study,26 coarse LWA was produced using date palm kernel shell waste. Lightweight geopolymer concrete blocks are prepared using these aggregates as well as F-type fly ash and date palm kernel fuel ash as binders. The thermal and mechanical properties of the mixtures were investigated. As the unit volume weight of the mixtures decreased, there was a maximum reduction of up to 48% in the TC coefficient values. However, it was observed that the compressive, tensile, and flexural strengths of the mixtures were adversely affected. In lightweight geopolymer concrete blocks, the strength/density ratio was obtained as 17. The authors reported that this rate was 54% lower in similar conventional concretes.
When reviewing the studies in the literature, although LWC exhibits good thermal properties, its dimensional stability characteristics such as shrinkage and cracking are typically lower.27 Additionally, a lot of researchers have noted that LWC combinations have poor mechanical qualities.28 To address these drawbacks, various methods were implemented. The most common method reported is the addition of fibers in optimal amounts and aspect ratios to the mixtures.29 Here, the results of some relevant research on this topic are summarized.
The impact of fiber type and content on the mechanical characteristics of LWC mixtures was examined in a study.30 It was emphasized that using fibers beyond the optimum usage ratio resulted in a decrease in the strength performance of the mixtures. In another study,31 it was reported that the optimum volume fraction of polypropylene fibers for strength performance was 0.4%, while it was 1% for steel fibers. In a study,19 it was mentioned that LWC mixtures with a polyamide fiber content of less than 0.5% did not show a significant increase in compressive and flexural toughness.
In a study,32 it was emphasized that steel, plastic, and glass fibers can reduce TC in concrete mixtures by introducing air entrainment and increasing the total porosity. In a similar study conducted by Reference 33, it was concluded that the thermal properties of fiber-reinforced concrete are dependent on the type of fiber, and glass fibers have a more pronounced effect on porosity, TC, and thermal diffusivity.
Considering the above studies, it was determined that in addition to the use of traditional thermal insulation products as a separate façade layer to ensure energy efficiency in the building, studies have been carried out on the thermal properties of the concretes that form the building envelope. It has been understood that the strength and thermal performance of lightweight concretes are affected by the innovative materials added to the concrete (mineral materials, fiber, bacteria, waste, etc.) as well as the aggregate properties used. It has been emphasized before that as the unit volume weight of the mixture decreases, its thermal properties are positively affected, but its mechanical properties are negatively affected. It has been observed that studies have been carried out to eliminate these negativities through the use of fiber. However, it has been determined that there are very few studies examining both the thermal and mechanical properties of fiber lightweight concrete facade panels together. In this study, the effects of fiber type, length and usage rate on the strength, energy absorption capacity, elasticity modulus, water absorption and thermal performance of lightweight concrete mixture were investigated. The mixture that exhibits the best performance in terms of these properties is recommended for facade panel production.
2 MATERIALS AND METHODS
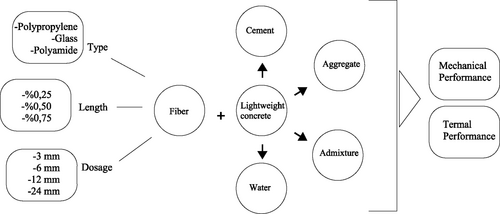
The process followed in the study is schematically shown in Figure 3. The materials used in the production of concrete mixtures and the methods applied are summarized below.
2.1 Materials
The binder utilized in this investigation was CEM I 42.5 R type cement (EN 197-1 Standard). Table 1 shows the cements' chemical composition as well as some of their physical and mechanical characteristics after being purchased from the supplier.
| Material | (%) | Physical properties | ||
| SiO2 | 18.86 | Specific gravity | 3.15 | |
| Al2O3 | 5.71 | Mechanical properties | ||
| CaO | 62.70 | Compressive strength (MPa) | 1-day | 14.7 |
| Fe2O3 | 3.09 | 2-day | 26.80 | |
| MgO | 1.16 | 7-day | 49.80 | |
| Na2O + 0.658 K2O | 0.92 | 28-day | 58.5 | |
| SO3 | 2.39 | Fineness | ||
| Cl− | 0.01 | Residual on 0.045 mm sieve (%) | 7.6 | |
| Loss on ignition (LOI) | 3.20 | Blaine specific surface (cm2/g) | 3530 | |
| Insoluble residue | 0.32 | |||
| Free CaO | 1.26 | |||
In the production of concrete mixtures, coarse aggregate composed of pumice with particle sizes ranging from 5 to 15 mm was employed, while fine aggregate consisting of crushed limestone with particle sizes ranging from 0 to 5 mm was utilized.
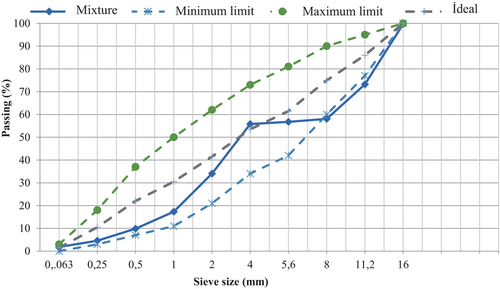
The optimum ratio of coarse/fine aggregate usage was determined taking into account the segregation and slump value of the mixture. In all mixtures, fine and coarse aggregates were used in a volume ratio of 57% fine and 43% coarse aggregate. The specific gravity and water absorption capacity values for limestone aggregate were calculated as 2.72 and 0.37, respectively, according to EN 1097-6 Standard. Similar values for pumice aggregate were measured as 1.09% and 44%. The gradation curve of the combined aggregates and Standard limits (EN 206) are shown in Figure 4.
To improve the mechanical characteristics of lightweight facade concrete, fiber-reinforced mixtures were prepared by adding polypylene, glass, and polyamide fibers with lengths of 3, 6, 12 mm, 13, 25 mm, and 6, 12 mm, respectively, to the control mixture. In these mixtures, fibers were used at ratios of 0.25%, 0.50%, and 0.75% of the total volume. Some physical and mechanical properties of the fibers used in the study, provided by the manufacturer, are summarized in Table 2. To achieve the desired workability in the mixtures, a uniform high-range water-reducing admixture based on polycarboxylate ether was used. The chemical admixture used had the following properties, as provided by the manufacturer: density of 1.063 g/cm3, solid content ratio of 32%, pH value of 5.8, chloride content of less than 0.1%, and alkali ratio of less than 10%.
| Fiber | Specific gravity | Fiber length (mm) | Tensile strength (MPa) | Modulus of elasticity (MPa) | Melting temperature (°C) |
|---|---|---|---|---|---|
| Polipropilen (PP) | 0.91 | 3, 6, 12 | 467–548 | 4048–5674 | 162 |
| Glass | 2.6 | 13, 25 | 3400 | 77,000 | 1120 |
| Poliamid (PA) | 1.14 | 6, 2 | 800-1100 | 3000–3500 | 260 |
2.2 Preparation of mixtures
In all mixtures, the water/cement (w/c) ratio, cement content, and slump values were kept constant at 0.46, 300 kg/m3, and 40±20 mm, respectively. The target was to have unit volume weights of the mixtures below 2000 kg/m3 (ACI 211-2, 1991; TS 2511, 2017).
In this study, a total of 22 LWC mixtures were prepared by adding different types, ratios, and lengths of fibers to the control mixture without fibers. The nomenclature of the mixtures was based on the fiber type, length, and dosage. For example, a mixture containing 0.25% of 12 mm long PP fiber is named 12PP25. The material quantities used in the production of 1 m3 of LWC, designed according to the ACI 211-2 Standard, are shown in Table 3.
| Mixture | Water/cement ratio | Cement | Water | Aggregate | Fiber | |
|---|---|---|---|---|---|---|
| 0–5 mm | 5–15 mm | |||||
| Limestone | Pumice | |||||
| Control | 0.46 | 300 | 138 | 1106.17 | 366.73 | 0 |
| 3PP25 | 0.46 | 300 | 138 | 1106.17 | 366.73 | 2.275 |
| 3PP50 | 0.46 | 300 | 138 | 1106.17 | 366.73 | 4.55 |
| 3PP75 | 0.46 | 300 | 138 | 1106.17 | 366.73 | 6.825 |
| 6PP25 | 0.46 | 300 | 138 | 1106.17 | 366.73 | 2.275 |
| 6PP50 | 0.46 | 300 | 138 | 1106.17 | 366.73 | 4.55 |
| 6PP75 | 0.46 | 300 | 138 | 1106.17 | 366.73 | 6.825 |
| 12PP25 | 0.46 | 300 | 138 | 1106.17 | 366.73 | 2.275 |
| 12PP50 | 0.46 | 300 | 138 | 1106.17 | 366.73 | 4.55 |
| 12PP75 | 0.46 | 300 | 138 | 1106.17 | 366.73 | 6.825 |
| 13C25 | 0.46 | 300 | 138 | 1106.17 | 366.73 | 6.8 |
| 13C50 | 0.46 | 300 | 138 | 1106.17 | 366.73 | 13.4 |
| 13C75 | 0.46 | 300 | 138 | 1106.17 | 366.73 | 20.1 |
| 25C25 | 0.46 | 300 | 138 | 1106.17 | 366.73 | 6.8 |
| 25C50 | 0.46 | 300 | 138 | 1106.17 | 366.73 | 13.4 |
| 25C75 | 0.46 | 300 | 138 | 1106.17 | 366.73 | 20.1 |
| 6PA25 | 0.46 | 300 | 138 | 1106.17 | 366.73 | 2.850 |
| 6PA50 | 0.46 | 300 | 138 | 1106.17 | 366.73 | 5.700 |
| 6PA75 | 0.46 | 300 | 138 | 1095.08 | 363.05 | 8.55 |
| 12PA25 | 0.46 | 300 | 138 | 1102.48 | 365.50 | 2.850 |
| 12PA50 | 0.46 | 300 | 138 | 1102.48 | 365.50 | 5.700 |
2.3 Method
Mixtures were prepared in a vertical-axis, mixer-equipped, 45-L capacity pan mixer, following the standards. Pumice aggregate was used in the saturated surface dry (SSD) condition. The prepared samples were cured in water until the test day, following the standards.
The slump and unit weight (UW) values of the mixtures were determined following the guidelines outlined in EN 12350-2 and EN 12350-6 Standards, respectively.
Here, 𝜎 represents the flexural tensile strength (N/mm2), L is the span length between supports (mm), F is the maximum load at failure in the testing machine (N), H is the height of the fracture section (mm), B is the width of the fracture section (mm), and α represents the notch depth of the fracture section.
The energy absorption capacity (EAC) of concrete was calculated according to ASTM C 1018 Standard as the area under the load-deformation curve.
Here, E represents the MoE, 𝜎 is stress (MPa), and 𝜀 is unit deformation (mm).
Here, b represents the saturated surface-dry weight of the specimens, and a represents the oven-dry weight.
The 28-day thermal conductivity (TCC) of the mixtures was measured on a 40 × 40 × 4.5 cm plate according to ASTM C518 and ISO 8301 Standards.
3 DISCUSSION AND CONCLUSION
3.1 Fresh state properties
The water reducer requirement for the target slump value of the mixtures and their fresh state UW are provided in Table 4.
| Mixture | Dosage of admixture (%) | Slump (cm) | Unit weight (kg/m3) | |
|---|---|---|---|---|
| Theoretical | Fresh measured | |||
| Control | 1 | 4.5 | 1910 | 1900 |
| 3PP25 | 1.5 | 2 | 1900 | 1860 |
| 3PP50 | 3 | 2.2 | 1890 | 1800 |
| 3PP75 | 4 | 2.5 | 1860 | 1780 |
| 6PP25 | 2 | 2.5 | 1900 | 1940 |
| 6PP50 | 3 | 2 | 1890 | 1900 |
| 6PP75 | 4 | 2 | 1860 | 1750 |
| 12PP25 | 1.5 | 3.5 | 1900 | 1840 |
| 12PP50 | 3 | 2 | 1890 | 1870 |
| 12PP75 | 4 | 2 | 1860 | 1830 |
| 13C25 | 1.25 | 3 | 1940 | 1905 |
| 13C50 | 1.5 | 3 | 1910 | 1910 |
| 13C75 | 1.5 | 2.5 | 1900 | 1940 |
| 25C25 | 1.25 | 4 | 1940 | 1835 |
| 25C50 | 1.5 | 3 | 1910 | 1850 |
| 25C75 | 2 | 3 | 1900 | 1950 |
| 6PA25 | 1.5 | 2.5 | 1910 | 1800 |
| 6PA50 | 3 | 2 | 1900 | 1710 |
| 6PA75 | 4 | 2 | 1850 | 1810 |
| 12PA25 | 3 | 2 | 1910 | 1770 |
| 12PA50 | 4.5 | 2 | 1900 | 1820 |
| 12PA75 | 5 | 2 | 1850 | 1740 |
As can be seen from Table 4, the admixture requirement for the target slump value increased with the addition of fiber to the mixture, regardless of the fiber type and size. It was reported that this situation is due to the increase in the mixture cohesiveness with the addition of fiber.34, 35, 29 It was noted that as the length of the fibers increases, the flow characteristics of the mixtures tend to deteriorate. Long fibers can get entangled with each other during mixing, leading to the risk of lump formation, as stated by Reference 36. It was understood that glass fiber is more successful than the other two types of fibers in terms of flow performance. This is thought to be due to the decrease in friction due to the glass fiber having a smoother surface compared to other fibers (Figure 5a). Similar statements were emphasized by References 37, 38. PA fiber exhibited the lowest performance in terms of flow behavior according to Table 4. This is believed to be due to the excessively rough surface of PA fiber (Figure 5c).

3.2 Mechanical properties
Some mechanical properties of the mixtures are given in Table 5. A more detailed discussion of the results is conducted under separate headings.
| Fibre | Mixture | Compressive strength (MPa) | Flexural strength (MPa) | Energy absorption capacity (Nmm) | Split-tensile strength (MPa) | Elastic modulus value (GPa) | Poisson ratio | Water absorption rate (%) |
|---|---|---|---|---|---|---|---|---|
| Control | 23.27 | 2.71 | 120.5 | 1.61 | 20.55 | 0.1340 | 10.30 | |
| Polypropylene | 3PP25 | 27.72 | 2.82 | 164.6 | 1.97 | 14.52 | 0.0978 | 6.98 |
| 3PP50 | 24.09 | 2.61 | 289.57 | 1.74 | 14.49 | 0.0798 | 8.77 | |
| 3PP75 | 21.21 | 2.20 | 375.51 | 2.28 | 14.82 | 0.1344 | 8.06 | |
| 6PP25 | 22.02 | 2.75 | 127.07 | 2.32 | 15.55 | 0.1106 | 9.14 | |
| 6PP50 | 21.49 | 2.30 | 217.87 | 1.58 | 14.26 | 0.0926 | 8.8 | |
| 6PP75 | 19.32 | 1.90 | 564.36 | 1.80 | 13.79 | 0.1243 | 9.40 | |
| 12PP25 | 23.68 | 2.58 | 181.62 | 2.46 | 13.85 | 0.1009 | 7.64 | |
| 12PP50 | 20.72 | 2.31 | 355.94 | 1.89 | 11.51 | 0.1002 | 7.18 | |
| 12PP75 | 16.61 | 2.10 | 412.6 | 1.82 | 9.97 | 0.0962 | 11.45 | |
| Glass | 13C25 | 24.11 | 2.16 | 176.19 | 1.76 | 23.24 | 0.2333 | 8.84 |
| 13C50 | 23.18 | 2.06 | 257.33 | 1.80 | 20.55 | 0.1400 | 9.09 | |
| 13C75 | 23.05 | 2.05 | 346.85 | 2.32 | 19.48 | 0.2319 | 9.68 | |
| 25C25 | 24.42 | 2.10 | 314.48 | 2.06 | 20.48 | 0.1934 | 8.71 | |
| 25C50 | 23.40 | 2.27 | 467.3 | 2.11 | 18.17 | 0.2135 | 8.98 | |
| 25C75 | 21.96 | 2.11 | 568 | 2.37 | 14.56 | 0.1569 | 9.61 | |
| Polyamide | 6PA25 | 20.52 | 2.42 | 140.4 | 1.81 | 18.71 | 0.1973 | 7.32 |
| 6PA50 | 18.38 | 2.14 | 223.4 | 1.54 | 17.75 | 0.1809 | 8.18 | |
| 6PA75 | 14.85 | 1.98 | 340.3 | 1.83 | 14.92 | 0.1849 | 10.31 | |
| 12PA25 | 22.06 | 2.86 | 145.6 | 2.17 | 18.44 | 0.1558 | 7.67 | |
| 12PA50 | 19.17 | 2.67 | 250.4 | 1.75 | 15.00 | 0.1859 | 8.83 | |
| 12PA75 | 14.62 | 1.95 | 645.5 | 2.07 | 14.56 | 0.2043 | 10.12 |
3.2.1 Compressive strength-water absorption ratio
To examine the results in detail, the relative values of the fiber-reinforced mixtures compared to the control mixture were calculated. The 28-day relative CS results of fiber-reinforced mixtures compared to the fiber-free control mixture are shown in Figure 6.
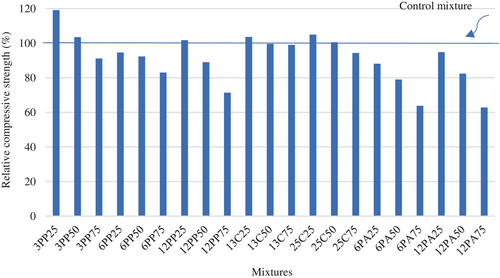
Incorporating fibers up to a specific fiber content was demonstrated to enhance the compressive strength (CS) of lightweight concrete (LWC) mixtures, but exceeding the optimum content can negatively affect CS, as emphasized in the studies by References 39-42. Regardless of fiber type, it can be observed from Figure 6 that the addition of 0.25% fiber to the control mixture generally had a positive effect on the CS of LWC mixtures. However, an increase in the fiber content generally resulted in decreased CS values. The relative CS results for PP, glass, and PA fiber-reinforced mixtures varied between 71%–119%, 95%–105%, and 64%–95%, respectively, compared to the control mixture.
In fiber-reinforced mixtures, it can be observed from the results that PA fibers exhibited the lowest performance in terms of CS. As previously emphasized, Mixtures reinforced with PA fibers exhibited the least favorable performance in terms of flow characteristics. This situation is thought to be due to an increase in void volume in PA fiber-reinforced mixtures. Similar results were also reported by References 43-46.
It was emphasized by Reference 34 that fibers shorter than 6 mm may contribute to CS by preventing early-age drying shrinkage cracks rather than the bridging effect. On the other hand, the use of fibers longer than 12 mm can prevent the progression of cracks caused by the bridging effect, as emphasized by Reference 38. However, regardless of fiber type, an increase in fiber length did not result in a notable impact on the CS values of lightweight concrete mixtures.
There was a finding that the best and worst performances in terms of CS were achieved in the mixtures 3PP25 and 12PA75, respectively.
The results of the 28-day relative WAC of concrete mixtures are shown in Figure 7. It is known that the most important parameter affecting the permeability of concrete is the concrete void structure.47-49 Studies have indicated that concrete possessing a high compressive strength (CS) features a denser matrix structure, thus increasing the challenge of water penetration and decreasing water absorption capacity (WAC).50 In traditional concrete, there is a reverse relationship between CS and WAC.38 In this study, it was determined that there is a logarithmic relationship between CS and WAC in the LWC mixtures with added fibers.
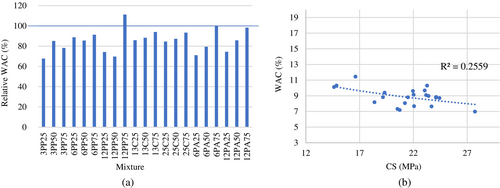
Regardless of fiber type and length, it was observed that the addition of fibers to the control mix reduces the WAC. It is believed that this is due to the restriction of drying shrinkage cracks, which is a common risk in LWC when using fibers. Similar statements were also emphasized in a study.34 Figure 7a shows that the relative WAC of PP, glass, and PA fiber-reinforced mixtures vary between 67%–111%, 86%–94%, and 70%–98%, respectively, compared to the control mixture. It was observed that regardless of fiber type and length, an increase in the fiber content led to an increase in the WAC of the mixtures. In PP fiber-reinforced mixtures, an overall increase was measured with an increase in fiber length. However, in glass and PA fiber-reinforced mixtures, it was understood that an increase in fiber length did not result in a significant change in the WAC of LWC. In fiber-reinforced mixtures, the lowest and highest WAC was observed in the 3PP25 and 12PP75 mixtures, respectively.
3.2.2 Flexural—splitting-tensile strength
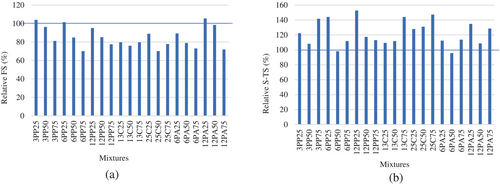
The 28-day relative FS and S-TS of LWC mixtures are shown in Figure 8. Regardless of the fiber type, it is observed from Figure 8.a that the relative FS results of PP, glass, and PA fiber-reinforced mixtures vary in the range of 70%–104%, 75%–88%, and 73%–105%, respectively, compared to the control mixture.
The literature reveals conflicting statements regarding the influence of fiber addition on the FS of cementitious systems. Many researchers51, 52, 18 have expressed that fibers located in the fracture plane increase FS. Parameters such as fiber content and aspect ratio were highlighted to significantly affect the homogeneous distribution of fibers in the matrix.53 It was reported that when fibers are homogeneously distributed in the matrix, they can positively affect the mechanical properties of cementitious systems.29 It was understood that fiber length is one of the crucial parameters affecting fiber performance.51 Short fibers are reported to prevent microcrack formation, thereby affecting FS, while macro fibers are effective in energy absorption capacity through bridging, as reported by Reference 38. The surface texture of the fibers was shown to influence performance.34 Fibers with high roughness can entrain air during mixing, potentially negatively impacting the strength properties of concrete mixtures. On the other hand, it was emphasized that rough fibers can have a positive effect on strength due to stronger fiber-matrix adhesion.29
In this study, it was observed that regardless of fiber type and length, the addition of fibers generally reduces the FS of LWC mixtures. This behavior becomes more pronounced with an increase in fiber content. It is believed that this phenomenon is due to the increase in void volume with an increase in fiber content in the matrix.36 At the same utilization, it was measured that the FS performance is positively affected by increasing the length of PA and glass fibers. However, in PP fiber-reinforced mixtures, the opposite trend was observed.
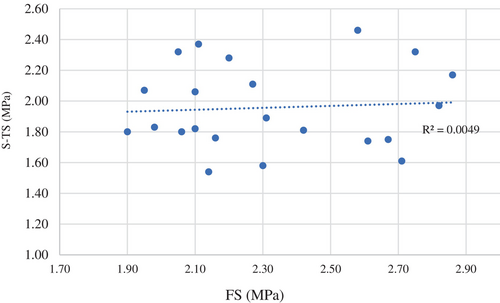
From Figure 8b, it is evident that the S-TS of LWC mixtures with the addition of PP, glass, and PA fibers varies between 98%–152%, 109%–147%, and 95%–134%, respectively. Regardless of fiber type and length, it was found that fiber-reinforced mixtures exhibit higher S-TS than the control mixture. In glass fiber-reinforced mixtures, it was observed that an increase in fiber content leads to an increase in S-TS, independent of fiber length. This increase is more pronounced with shorter 13 mm fibers. In mixtures with 13 mm and 25 mm glass fibers, it was understood that an increase in fiber content from 0.25% to 0.75% results in a S-TS increase of 35% and 19%, respectively. In PA fiber-reinforced mixtures, it was observed that an increase in fiber content has a minimal effect on S-TS. In 3 mm PP fiber-reinforced mixtures, it was observed that an increase in fiber content from 0.25% to 0.75% results in a 19% increase in S-TS. However, in mixtures with 6 and 12 mm fibers, it was determined that S-TS decreased by 35% and 39%, respectively. It was found that shorter fibers exhibited superior S-TS performance. It is also evident from Figure 9 that there is no strong correlation between the FS and S-TS performance of the mixtures.
When examining the studies in the literature, it is understood that the effect of fibers on the tensile strength of concrete is generally associated with the bridging effect of fibers.54-57 The addition of fibers can, in some cases, negatively affect FS performance while enhancing tensile strength performance. It was reported that this situation may depend on design factors such as the placement or orientation of fibers.7 When the load is applied parallel to the fibers, an increase in tensile strength can be achieved, but when applied perpendicularly, a decrease in FS can occur.58 This adverse effect typically arises when fibers are not adequately oriented in the matrix. In such cases, while the tensile strength of concrete increases, the FS may decrease.
3.2.3 Energy absorption capacity
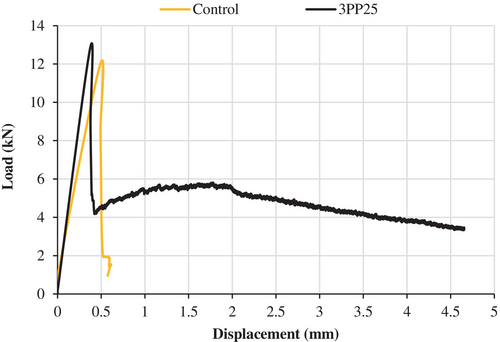
The load–deformation curves for the control and 3PP25 mixtures are provided in Figure 10. The 28-day relative EAC values for all mixtures are shown in Figure 11. It was reported that the mechanical properties of fibers, such as tensile strength and MoE, as well as their dosage, are important parameters affecting the flexural toughness of cementitious systems.59 In a study52 highlighted that fibers possessing a high modulus of elasticity and tensile strength are more efficient at enhancing the toughness of concrete mixtures. In another study,19 it was emphasized that the use of fibers longer than 12 mm significantly increased the ductility of concrete specimens. However, it was mentioned that this effect may vary depending on the chemical inertness and surface properties of the fibers. Figure 11 shows that, the EAC values of PP, glass, and PA fiber-reinforced mixtures varied in the range of 105%–342%, 146%–471%, and 116%–535%, respectively, compared to the control mixture.
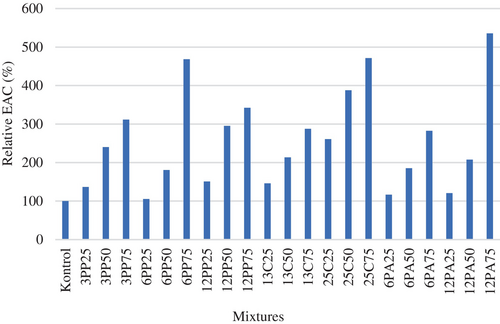
It was observed that the addition of fibers significantly increases the EAC of LWC mixtures, regardless of the fiber type and length. This behavior becomes even more pronounced with an increase in the fiber utilization. Increasing the fiber utilization from 0.25% to 0.75% resulted in a 3-fold, 4-fold, and 4-fold increase in EAC in 3, 6, and 12 mm PP fiber-reinforced mixtures, respectively. Similar increases were observed in 13 and 25 mm glass fiber-reinforced mixtures, with 3.4-fold and 4.7-fold increases, respectively, and in 6 and 12 mm PA fiber-reinforced mixtures, with 2.8-fold and 5.6-fold increases, respectively. This phenomenon was attributed to the bridging effect created by the fibers, as stated by many researchers.29, 60, 61 It is understood that, in general, the EAC of LWC mixtures increases with an increase in fiber length. This is due to the fact that the increased fiber length leads to a longer time for the fiber to debond from the matrix. Many studies have made similar claims.62 The highest EAC was measured in the 0.75% utilization mixture with 12 mm PA fibers.
3.2.4 Modulus of elasticity and Poisson ratio
The 28-day relative MoE values of fiber-reinforced LWC mixtures and the relationship between MoE and CS are shown in Figure 12. It was found that mixtures containing fibers generally have lower MoE values compared to the control mixture. Regardless of fiber type and length, it can be understood from Figure 12a that the MoE values of PP, glass, and PA fiber-reinforced mixtures vary in the range of 48%–76%, 70%–113%, and 70%–91%, respectively, compared to the control mixture.
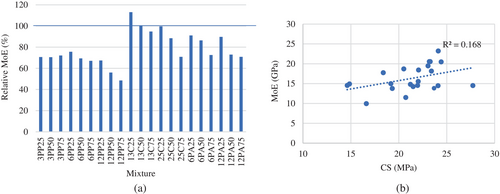
Regardless of fiber type, an increase in fiber content and length has generally led to a decrease in the MoE of LWC mixtures. It was reported in the literature that the type of fiber added, its volume fraction, and the MoE of the matrix can affect the MoE of concrete.63 The literature suggests that the increase in fiber content can have conflicting effects on the MoE of cementitious systems depending on whether fibers are homogeneously distributed in the matrix. It was reported that in cases where fibers are uniformly distributed within the matrix, an increase in fiber content can lead to an increase in the MoE due to the bridging effect of fibers, preventing crack propagation.36, 40 However, in situations where fibers are not homogeneously distributed in the matrix, it was emphasized that an increase in fiber content may result in a decrease in the MoE due to the increase in void volume caused by potential agglomeration.64 Furthermore, it was highlighted that polymer-based fibers generally have positive effects on reducing shrinkage cracks34 and enhancing EAC properties65, 66 while not significantly affecting the MoE.59, 67 This is believed to be due to the increased void volume resulting from the increased fiber usage ratio and length, leading to a decrease in the composite stiffness.
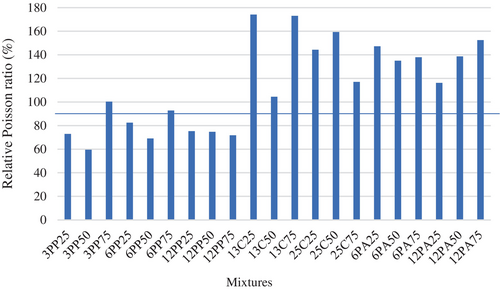
Based on the results, it can be deduced that glass fiber-reinforced mixtures demonstrated superior performance in terms of MoE when compared to other fiber-reinforced mixtures. This is believed to be due to the higher MoE of glass fibers compared to the other two fiber types. It can be understood from Table 2 that the MoE of glass fibers is approximately 15 and 24 times higher than that of PP and PA fibers, respectively. The MoE of PP fibers was observed to be approximately 1.5 times higher than that of PA fibers. However, regardless of fiber content and length, it was determined that the MoE of PA fiber-reinforced mixtures was approximately 20% higher than that of PP fiber-reinforced concrete. This is thought to be due to the stronger fiber-matrix adhesion of PA fibers, as previously emphasized because PA fibers have an excessively rough surface (Figure 13).
3.3 Thermal conductivity
- On one hand, it is anticipated that the increase in fiber usage may lead to the formation of agglomerations in the matrix and a decrease in the workability of the mixture, resulting in an increase in void volume. The generally lower unit volume weight values of fiber-reinforced mixtures compared to the control mixture partially confirm this mechanism. In such a scenario, on one hand, the TCC may increase due to the adverse effect on permeability properties. On the other hand, an increase in entrapped air volume is expected to lead to a decrease in TCC values. It was reported that an increase in concrete density generally results in an increase in the TCC.18 Since air, due to its molecular structure, exhibits lower TC compared to solids and liquids, it was emphasized that it leads to lower TC in porous concrete.30, 68
- The second mechanism is that the presence of fibers in the matrix can lead to a reduction in the drying-shrinkage problems that can be more severe in LWC. The use of fibers was emphasized by many researchers to improve the shrinkage behavior of cementitious systems.34 This situation can contribute to the decrease in the TCC values of the mixtures.
| Numune Kodu | TCC (W/Mk) | |
|---|---|---|
| Control | 0.43 | |
| Polypropylene | 3PP25 | 0.26 |
| 3PP50 | 0.37 | |
| 3PP75 | 0.38 | |
| 6PP25 | 0.38 | |
| 6PP50 | 0.37 | |
| 6PP75 | 0.33 | |
| 12PP25 | 0.39 | |
| 12PP50 | 0.40 | |
| 12PP75 | 0.39 | |
| Glass | 13C25 | 0.37 |
| 13C50 | 0.38 | |
| 13C75 | 0.41 | |
| 25C25 | 0.39 | |
| 25C50 | 0.40 | |
| 25C75 | 0.42 | |
| Polyamide | 6PA25 | 0.36 |
| 6PA50 | 0.39 | |
| 6PA75 | 0.31 | |
| 12PA25 | 0.29 | |
| 12PA50 | 0.32 | |
| 12PA75 | 0.29 |
An increase in fiber utilization from 0.25% to 0.75% resulted in a 46% increase in the TCC value for 3 mm PP fiber-reinforced mixtures, while it decreased by 15% for 6 mm fiber-reinforced mixtures. It was observed that the TCC of 12 mm fiber-reinforced mixtures was not affected by the fiber utilization. In 13 and 25 mm glass fiber-reinforced mixtures, there was a measured increase of 11% and 7%, respectively. For 6 mm PA fiber-reinforced mixtures, an increase in fiber utilization from 0.25% to 0.75% resulted in a 16% decrease in the TCC value. It was understood that the TCC value of 12 mm PA fiber-reinforced mixtures was not affected by the increase in fiber utilization. The mixture containing 3 mm PP fibers at a 0.25% rate, labeled as 3PP-0.25, exhibited the best performance in terms of TCC.
Due to the large number of influencing parameters, it was understood that a strong correlation between fiber length and TCC values cannot be established. An increase in fiber length is expected to result in an increase in void volume. It was previously explained that depending on the increase in void volume, the TCC value can either decrease or increase. It was stated that thermal properties are also dependent on the dimensions of fibers, in addition to fiber type and usage amount.33
3.4 General evaluation
In terms of the experiments conducted within the scope of the study, the best and worst performances of fiber type, length, and usage ratio are summarized in Table 7.
| Experimental factors | Best performance | Worst performance | ||
|---|---|---|---|---|
| Type and length | Utilization rate | Type and length | Utilization rate | |
| Compressive strength | 3PP | 0.25 | 6PA | 0.75 |
| Flexural strength | 12PA | 0.25 | 25C | 0.5 |
| Energy absorption capacity | 12PA | 0.75 | 6PP | 0.25 |
| Splitting tensile strength | 12PP | 0.25 | 6PA | 0.5 |
| Modulus of elasticity | 13C | 0.5 | 12PP | 0.75 |
| Poisson ratio | 3PP | 0.75 | 3PP | 0.5 |
| Water absorption | 3PP | 0.25 | 12PP | 0.75 |
| Thermal conductivity | 3PP | 0.25 | 25C | 0.25 |
| Best performance | 3PP | 0.25 | 6PA–12PP | 0.5–0.75 |
As seen in Table 7, when both mechanical and thermal properties are considered among the prepared concrete mixtures, it is understood that the mixture containing 3 mm long polypropylene fibers at a 0.25% rate exhibited superior performance.
4 CONCLUSION
- Regardless of the fiber type and ratio, the addition of fibers to LWC mixtures was found to reduce the flow performance and specific gravity while increasing the demand for additives. It was observed that this behavior becomes more pronounced with an increase in the fiber utilization and length. It is understood that, in terms of flow performance, glass fiber is the most successful.
-
Regardless of fiber type and length:
- It was found that the addition of 0.25% fibers to LWC mixtures results in a general increase in CS compared to the control mixture. With an increase in the fiber utilization, the opposite trend was observed. However, it was determined that regardless of fiber type, the length of the fibers does not have a notable influence on CS. In terms of CS, the best and worst performances were achieved in the 3PP25 and 12PA75 mixtures, respectively.
- The addition of fibers to the mixture was observed to reduce WAC. Similar to conventional concrete, a reverse relationship between CS and WAC exists in fiber-reinforced mixtures.
- The addition of fibers generally leads to a decrease in FS in LWC mixtures. It was found that this trend becomes more noticeable as fiber utilization increases. At the same utilization, an increase in the length of PA and glass fibers positively affects FS, while the opposite is observed in PP fiber-reinforced mixtures.
- The addition of fibers was found to increase the S-TS of the mixtures. In glass fiber-reinforced mixtures, it was found that an increase in the fiber utilization leads to an increase in S-TS regardless of fiber length. This increase becomes more pronounced in the case of shorter fibers, such as 13 mm. In PA fiber-reinforced mixtures, it was observed that an increase in the fiber utilization does not significantly affects S-TS. In PP fiber-reinforced mixtures, no clear correlation was established between utilization and fiber length. Short fibers were found to perform better in terms of S-TS.
- The addition of fibers was found to significantly increase the EAC of the mixtures. It was understood that this behavior becomes more pronounced with an increase in the fiber utilization. An increase in fiber length generally results in an increase in the EAC of the mixtures.
- The addition of fibers to the mixture was found to decrease the TCC values. It was understood that there is no strong correlation between fiber length and TCC values. The mixture containing 3 mm PP fibers at utilization of 0.25% exhibited the best performance in terms of TCC.
- It was found that the modulus of elasticity values of all fiber-reinforced mixtures is generally lower compared to the control mixture. Regardless of the fiber type, an increase in fiber utilization and length was found to generally decrease the elasticity modulus of LWC mixtures. Glass fibers were identified as the superior fiber type in terms of modulus of elasticity.
- The mixture containing 3 mm PP fibers at utilization of 0.25% was identified as the most suitable mixture for facade panel production in terms of both mechanical and thermal properties.
ACKNOWLEDGMENTS
The first author would like to acknowledge the Scholarship provided by Turkish Council of Higher Education (YÖK 100/2000 Program) during their PhD study. The second author is grateful for the support received from the Scientific and Technological Research Council of Turkey (TUBITAK) under Grant No: 222M425. The second author would like to thank TÜBİTAK for 2211A scholarship during his doctoral studies.
CONFLICT OF INTEREST STATEMENT
The authors declare that they have no known competing financial interests or personal relationships that could have appeared to influence the work reported in this paper. The authors declare the following financial interests/personal relationships which may be considered as potential competing interests.
Biographies

Hatice Elif Beytekin, Department of Architecture, Bursa Uludag University, Bursa, Turkey. Email: [email protected]

Yahya Kaya, Department of Civil Engineering, Bursa Uludag University, Bursa, Turkey. Email: [email protected]

Ali Mardani, Department of Civil Engineering, Bursa Uludag University, Bursa, Turkey. Email: [email protected]

Filiz Şenkal Sezer, Department of Architecture, Bursa Uludag University, Bursa, Turkey. Email: [email protected]
Open Research
DATA AVAILABILITY STATEMENT
The data that support the findings of this study are available from the corresponding author upon reasonable request.


