Holistic image-based analysis of damage on concrete surfaces—A multifaceted approach based on supervised machine learning
Abstract
Traditional manual methods for inspecting damage on building structures, such as cracks or spalling on concrete surfaces, are laborious, costly, and error-prone. Despite many attempts to automate this task using digital photographs, most studies primarily focus on detecting damage within images, neglecting the actual dimensions and their implications for structural integrity. To bridge this gap, we present a multifaceted approach for holistic damage analysis that not only detects damage within images but also determines its real-world dimensions. To achieve this, we first distinguish between linear and areal damage, and apply two separate methods based on deep learning, each tailored to detect these specific types of damage within images. Additionally, we use a cost-effective 3D-printed laser projection device to project a grid of laser points onto the surface. This grid, with a known and fixed point-to-point distance, serves as a scale reference, facilitating true-to-scale measurements of the damage area. Furthermore, for depth estimation of areal damage, we employ models for monocular depth prediction trained in domains distinct from ours. We thoroughly evaluated our methods on realistic and challenging image datasets, which we captured ourselves in public space. The results show that our customized methods for damage detection achieved moderate results for linear damage and more promising results for areal damage. The quantification of damage area resulted in errors less than 10% across all evaluated images, which is suitable for most practical applications. However, estimating the depth of areal damage using models trained on distinct domains proved to be a challenge. Our research expands automated damage detection to include comprehensive, true-to-scale analysis of damage and underscores the need for continued refinement.
1 INTRODUCTION
Concrete structures often exhibit signs of damage already after a few decades of service life, depending on environmental conditions, maintenance, and initial construction quality. While maintenance practices and the quality of initial construction can be actively controlled and improved, environmental conditions typically present a harder challenge. These conditions can contribute to damage through various mechanisms,1-3 such as corrosion, frost weathering, and salt crystallization, or even amplify the consequences of using inferior construction materials. This damage should be identified, investigated, and repaired as early as possible to avoid increasing repair measures and associated costs. Several studies4-9 show that both the service life of structures can be increased and life cycle costs reduced if resources for inspection and repair are increased. Thus, timely maintenance is crucial for the longevity and cost-effectiveness of concrete structures.
Currently, the inspection, assessment, and documentation of building damage are largely conducted manually. In traversable buildings, a human building inspector typically walks through the structure, locates the damage, and measures it using tools such as comparative scales or folding rules. This damage and its properties, such as type and extent, are then documented individually on two-dimensional paper plans. For nontraversable structures or areas difficult for humans to access, such as walls on sluices or bridges, unmanned aerial vehicles (UAVs) are often deployed to survey concrete structures for damage. Although drones can fully automate flight routes and image acquisition, the captured images are still mostly analyzed by human operators. However, these manual processes, including the analysis of images, are subject to potential inaccuracies, human error, and subjectivity in assessments, leading to inconsistencies and unreliable results. Furthermore, the paper plans used for documenting damage can be misplaced or lost. Consequently, the digital approach to these traditional procedures offers significant advantages, streamlining the process and reducing the likelihood of errors.
In this context, building information modeling (BIM) offers numerous benefits for construction and infrastructure projects. By creating a digital representation of buildings and infrastructure, BIM allows architecture, engineering, and construction professionals to collaborate effectively in the planning, design, and construction of structures. This efficient planning process enables comprehensive understanding of building performance, which minimizes errors, optimizes resources, and ultimately results in cost and time savings. Furthermore, BIM not only supports the creation of virtual design models for structures, but it also facilitates the integration of condition-related information from existing structures. Despite these advantages, the integration of damage management into BIM poses challenges and limitations. These include the complexity of automating damage detection in images and the need for accurate georeferencing of detected damage. Addressing these challenges is crucial for leveraging the full potential of BIM in comprehensive damage management, thereby enabling a more efficient and precise approach compared with traditional manual methods.
Within the scope of an overall research project,10 our aim was to develop a digital approach that leverages BIM for the ongoing inspection and maintenance of building structures during their operational phase. We designed a mobile system for smartphones that allows to capture images of damage and to generate a damage catalog (in the simple case a list with type and extent of the damage) within the BIM model. To spatially allocate the damage to the building structures in the model, we deployed a variety of georeferencing methods, including wireless technologies such as radio-frequency identification and bluetooth low energy, inertial measurement units, and image-based methods like visual-inertial odometry. To evaluate our approach in a real-world application and validate the effectiveness of this digital system, we carried out a pilot project, where the entire system was tested on parking garages. This pilot project demonstrated the potential of our proposed system in improving the inspection and maintenance of concrete structures in a real-world environment.
One of the major challenges we faced in the full automation of this process was the complex task of identifying and analyzing the damage captured in images. Damage can vary widely in appearance, including differences in shape, size, color, and pattern, which presents difficulties in defining generalized features for vision-based recognition manually. Furthermore, the texture of the intact surface surrounding the damage, which could potentially serve as a natural boundary and thus aid in localizing the damage within the image, also poses a challenge owing to its own variability. As a result, traditional rule-based algorithms often struggle in this context, highlighting the need for more adaptive and robust methods.
In response to these challenges, machine learning (ML)—specifically the use of artificial neural networks (ANNs)—offers a powerful tool. ANNs have proven to be highly effective in pattern recognition and data generalization, demonstrating their versatility across a range of applications that require complex data analysis and decision-making. Specifically, convolutional neural networks (CNNs), a subtype of ANNs, are frequently used in image analysis, particularly for their ability to learn and identify critical features from images autonomously. In terms of detecting damage in images, CNN architectures can be adapted to provide outputs such as damage types, bounding boxes for the damage, or even image masks highlighting the pixels that contribute to the damage. When working with georeferenced images or known camera poses, it is further possible to establish the precise location of the detected damage and to integrate it into a BIM model, advancing the objectives of our overall research project.
In this paper, we present an automated, multifaceted approach for holistic damage analysis. Our strategy combines various techniques based on deep learning and a cost-efficient device to detect and comprehensively analyze damage captured by an ordinary smartphone camera. To achieve this, we address several key aspects within the overall objective of damage analysis, which are described in detail in the individual subsections in Section 3.
- Linear damage detection: We designed a custom CNN for binary classification and trained it on a huge public dataset and online-sourced images, showing cracked and intact surfaces. This model is applied in a sliding window manner to perform image segmentation of linear damage, such as cracks.
- Areal damage detection: We adapted a pre-trained Mask R-CNN model through transfer learning on a dataset comprising more than thousand self-captured and online-sourced images, all showing areal damage. For these images, we manually created image masks as labels for the training process. This model is deployed for image segmentation of areal damage, such as spalling.
- Damage area quantification: We propose a convenient and cost-efficient laser projection device to introduce the image scale. By projecting laser points of known distances between them onto the surface, this device allows to determine the lateral extent of areal damage in metric scale, facilitating the quantification of the damage area in real-world units.
- Damage depth estimation: We investigated models for monocular depth prediction, trained for the distinct domains of more general outdoor and indoor scenes, assessing their suitability for determining the depth of areal damage.
We further evaluated all components of our proposed approach thoroughly using realistic and challenging images of damage captured by us in public spaces. Our findings demonstrate the effectiveness, accuracy, and practical applicability of our approach for automated damage analysis in practical construction and maintenance applications.
- A multifaceted damage detection system that combines tailored methods for linear and areal damage, enhancing specificity and optimizing results in image-based damage detection.
- A comprehensive analysis of areal damage, which includes both quantifying the lateral extent and estimating the depth in metric units, offering improved insights into structural integrity.
- Integration with cost-effective hardware and minimal requirements, ensuring both accessibility and affordability for a wide range of users and applications.
By merging these advanced features, our approach aims to contribute a valuable perspective in the field of damage analysis, offering a more comprehensive and efficient solution for the construction and maintenance sectors.
The rest of the paper is organized as follows: Section 2 presents a concise literature review on image datasets of structural damage and image-based approaches for automatic damage detection. In Section 3, we detail our methodology for the holistic damage analysis. This includes methods for detecting linear and areal damage in images, quantifying the damage area and estimating the depth of areal damage. Section 4 presents the results of our methods, followed by a discussion in Section 5. Finally, in Section 6, we conclude the paper with a summary of our findings and insights into potential areas for future research.
2 RELATED WORK
This section provides an overview of the latest advancements and related works in the field of damage detection for concrete structures, with a particular emphasis on approaches based on single images. By reviewing recent studies, which encompass datasets and methodologies, we aim to provide a comprehensive understanding of the current state of the art and contextualize our research, identifying the gaps it aims to address.
2.1 Damage datasets
Various damage datasets have already been released, focusing on different types such as cracks, spalling, corrosion, and efflorescence. In the following, we present a selection of relevant datasets in this field.
2.1.1 Crack datasets
A significant focus has been placed on cracks, leading to the creation of numerous datasets. Some provide image-level information, indicating the presence or absence of cracks in each image, while others offer pixel-level annotations, which delineate the specific locations and contours of cracks.
Image-level annotations
The SDNET201811 dataset, a comprehensive collection of over 56,000 images of concrete structures such as bridge decks, walls, and pavements, features image-level annotations. Each image, with a resolution of 256 × 256 pixels, captures a wide range of crack widths from 0.06 to 25 mm, including environmental factors like shadows and surface roughness. While suitable for classification tasks, occasional annotation inconsistencies in this dataset should be noted. Similarly, the “Concrete Crack Images for Classification”12, 13 dataset from Middle East Technical University (METU) Campus Buildings provides image-level annotations, focusing on cracks and intact surfaces of concrete. It consists of 40,000 images, each with a resolution of 227 × 227 pixels, derived from 458 high-resolution images.
Pixel-level annotations
Transitioning to pixel-level annotations, the Crack50014 dataset from Temple University includes 500 high-resolution images of pavements, captured using smartphones. This dataset offers pixel-level annotations for cracks, with each image segmented into 16 regions to highlight pronounced crack features. In a similar vein, the DeepCrack15 dataset offers pixel-level annotations across its 537 images, each 544 × 384 pixels, covering a wide spectrum of crack widths from as narrow as 1 pixel to as wide as 180 pixels.
2.1.2 Multi-type damage datasets
Extending beyond crack-specific datasets, several multi-type damage datasets offer a broader spectrum of damage including spalling, corrosion, and efflorescence, with image-level or pixel-level annotations.
Image-level annotations
The CODEBRIM16 dataset, encompassing a range of concrete damage from 30 bridges, provides image-level annotations across 1590 high-resolution images. This dataset includes cracks, spalling, exposed reinforcement bars, efflorescence, and corrosion stains. Meanwhile, the MCDS17 dataset, focusing on structural damage like cracks, spalling, and corrosion, also offers image-level annotations, though it may contain occasional inaccuracies in its labels.
Pixel-level annotations
For more detailed damage analysis, the S2DS18 and dacl10k19 datasets provide pixel-level annotations for a variety of damage types. The S2DS dataset includes 743 high-resolution images, each measuring 1024 × 1024 pixels, and primarily features concrete surfaces. These images detail defects such as cracks, spalling, and corrosion, and also capture elements like vegetation and control points. In contrast, the dacl10k dataset offers a more extensive collection, with 9920 images obtained from actual bridge inspections. This dataset covers 12 different types of damage and incorporates 6 bridge components, thus serving as a comprehensive resource for structural damage assessments.
2.2 Image-based damage detection
Our view to image-based damage detection shifts to a more practical perspective, which diverges slightly from the conventional definition and subdivision of image recognition in the field of computer vision and ML. We focus on three critical tasks: classification, localization, and quantification of damage. In this context, “classification” involves assigning a class to an image based on its content, distinguishing between “no damage” and “damage”, or the specific type of damage. “Localization” refers to pinpointing the damage within the image, either through bounding boxes or image masks. Lastly, “quantification” encompasses assessing the physical characteristics of the damage, such as its spatial extent, by deriving real-world measures. In the following sections, we will present recent approaches that aim to fulfill these specific tasks.
2.2.1 Automatic classification of damage in images
Classification of damage is an important aspect as it plays a crucial role in identifying the presence of damage, its severity, or differentiating between various types of damage. Various researchers have proposed different approaches to enhance the accuracy of damage classification.
In this regard, Savino et al.20 carried out an extensive comparison of various common CNN architectures for structural damage classification. Su et al.,21 on the other hand, adapted EfficientNetB0,22 an advanced CNN architecture, which resulted in improved classification accuracy on the SDNET201811 dataset. Other researchers like Gopalakrishnan et al.23 employed transfer learning on a VGG-1624 model for identifying cracks in UAV images. Adam et al.,25 on the other hand, took a hybrid approach by combining a CNN with support vector machines to improve precision and recall. In contrast, Zhang et al.26 took a different path and proposed the use of a 1D CNN and long short-term memory27 for improved performance with long sequence data.
2.2.2 Automatic localization of damage in images
Another critical objective in the field of damage detection is localization. This involves determining the exact location of damage within an image, either by using bounding boxes or image masks. The ability to localize damage in an image is key in many applications as it provides a basis for further analysis and aids in visualizing the extent and distribution of damage.
Sliding-window approaches
The sliding window approach is a commonly used technique for localizing objects within an image. The fundamental concept is moving a fixed-size region, referred to as a “window”, across the entire image. At each position of this window, a classifier, typically a deep learning model, is used to determine whether the window contains the object or feature of interest. This procedure allows for a detailed, systematic examination of the image, facilitating the detection of small or subtle objects. In the context of damage detection, the sliding window approach proves to be particularly well-suited for identifying minor or linear damage, such as cracks.
Cha et al.,28 for example, trained a CNN-based classifier on a large number of small images of concrete surfaces, utilizing the sliding window method to identify cracks in larger images. Focusing on another application, Sesselmann and coworkers29-34 adapted this method to road surfaces combining it with the I.R.I.S. multisensor system. They reported successful identification of linear defects such as cracks but experienced challenges with larger structures like road patches. Similarly, Kim and Cho35 deployed the sliding window technique using a classifier based on a fine-tuned AlexNet model trained on internet-scraped images. They implemented a probability map to enhance the sliding window method, leading to robust identification of potential cracks with satisfactory precision and recall rates.
Object detection methods
In contrast to regular CNNs, object detection methods extend tasks beyond simple image classification. Utilizing well-established CNN architectures like AlexNet,36 ResNet,37 or VGGNet24 as their backbone, these methods provide bounding boxes and class labels for each detected object in the image. They can be broadly categorized into single-stage detectors—exemplified by SSD38 (Single-Shot Multibox Detector) and the YOLO39 (You Only Look Once) family—and Region-based Detectors, such as R-CNN40 and its evolutions. These object detection methods have been widely adopted in the field of damage detection.
Single-stage object detectors
Single-stage detectors like YOLO and SSD are extensively used in the field of damage detection owing to their ability to accomplish object detection in a single pass through the network. This is achieved by dividing the image into a grid of cells, each capable of predicting class labels and bounding boxes for potential objects. This makes them highly efficient and suitable for real-time applications. Several studies have deployed various versions of the YOLO algorithm to perform damage detection.
For instance, Murao et al.41 employed YOLOv242 to develop a real-time system that detects cracks on concrete bridges. Pan and Yang43 enhanced YOLOv2 with the ResNet-5037 architecture, classifying post-disaster damage by severity. Kumar et al.44 took advantage of YOLOv345 for real-time detection of concrete damage in high-rise structures using drones and edge computing. Jiang et al.46 further optimized YOLOv3 for detecting damage, like cracks and spalling. In a recent study, Zou et al.47 used YOLOv448 for classifying postearthquake damage while minimizing computational cost. On the other hand, Yao et al.49 applied YOLOv4 to detect concrete cracks in foggy conditions, achieving notable accuracy. Finally, Yu et al.50 utilized the latest YOLOv5 for accurate detection of cracks on concrete bridges, demonstrating the capability to detect cracks larger than 0.15 mm in size.
Region-based object detectors
Region-based object detectors such as R-CNN40 along with its improvements Fast R-CNN,51 Faster R-CNN,52 and Mask R-CNN,53 adopt a two-stage approach. This approach initially suggests candidate regions, followed by refining these regions and assigning them class labels. Notably, Faster R-CNN incorporates a region proposal network (RPN) into the end-to-end trainable network, thus enhancing both speed and performance. Mask R-CNN extends this framework further by generating image masks for instance segmentation. The two-stage strategy of these methods enables a more precise and targeted object classification and localization, contributing to their superior accuracy. Given these advancements, region-based object detectors have found extensive use in damage detection tasks.
Bai et al.,54 for example, utilized Mask R-CNN, supplemented with a Path Aggregation Network55 (PANet) and a High-Resolution Network56 (HRNet), to detect cracks. Their enhanced model, trained on a self-created dataset, showed significant improvements on various public datasets. Similarly, Kim and Cho57 used Mask R-CNN to detect cracks wider than 0.3 mm on concrete walls. Kumar et al.,58 on the other hand, employed Mask R-CNN for detecting both cracks and spalling on civil infrastructure, achieving notable accuracy. In a comparative study, Xu et al.59 reported that both Mask R-CNN and Faster R-CNN outperformed YOLOv3 in crack detection, with the bounding boxes of Faster R-CNN providing more complete detection results than that of Mask R-CNN. Finally, Yu et al.60 compared the efficacy of Mask R-CNN with U-Net,61 the latter also performing image segmentation, for concrete crack detection in tunnels. Although U-Net exhibited faster processing speed, Mask R-CNN proved superior in detecting thin and less conspicuous cracks.
2.2.3 Automatic quantification of damage based on images
Quantifying damage involves an analytical process that goes beyond the basic task of detection. This analysis is tasked with translating the attributes of the detected damage into specific numerical metrics, such as area, depth, width, or volume, often represented in real-world measures. While there is substantial research on classification and localization, the exploration of damage quantification in monocular images has not been as extensive, primarily owing to its complexity. Estimating the real-world dimensions of damage using single images involves several challenges, like the difference in image scales, perspective distortions, and variability in damage patterns. However, a handful of studies have made significant strides in this area, making notable contributions to the field.
For instance, in the previously mentioned study of Chen et al.,57 they extended their damage detection approach, which is based on Mask R-CNN, by applying the pinhole camera model to estimate the image scale and establish the metric widths of cracks. The method proved particularly effective in identifying and quantifying cracks wider than 0.3 mm, achieving errors less than 0.1 mm. Nonetheless, the accuracy declined for cracks narrower than 0.3 mm owing to the limitations imposed by image resolution. In contrast, Bang et al.62 combined structured lights with a depth camera, bypassing the need for information about the camera intrinsics. They used Faster R-CNN for damage detection and the dimensions of the damage were quantified using projected laser beams and measurements from the depth camera. This approach demonstrated solid performance, achieving a F1-score of 0.83 and a median relative error of less than 5%.
In summary, the field of image-based damage detection and analysis, specifically in the context of concrete structures, has seen remarkable progress. Notably, the advancements have been significant in the classification and localization of damage, with deep learning models and object detection algorithms considerably enhancing accuracy and efficiency. However, quantifying real-world dimensions of damage remains less explored, with current approaches typically requiring specific conditions or complex, costly equipment, thus constraining their practical applicability. Furthermore, the homogeneity and lack of variety in many damage datasets hinder the effective evaluation of these approaches, as they do not fully represent the complexity and diversity of real-world scenarios. Recognizing these gaps, our research presents a comprehensive methodology and a complex dataset for evaluation that promotes holistic damage analysis. By utilizing tailored deep learning models and affordable devices, we aim to enhance both damage detection and quantification. Our approach not only offers a practical and flexible solution, but also represents a significant contribution to the field.
3 AUTOMATIC DETECTION AND ANALYSIS OF DAMAGE
3.1 Methodology overview
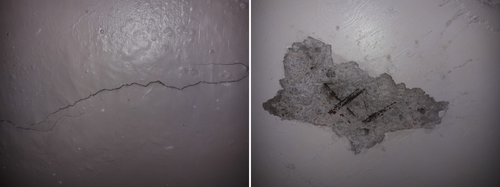
The primary objective of our study is to develop a methodology that facilitates the detection and a comprehensive analysis of structural damage, including quantification of its real-world dimensions. To simplify the complexity of the problem, we first categorize damage into two types: linear and areal. Linear damage is characterized by linear formations in the images and includes various types of cracks, such as fractures, fissures, crazing, disruptions, and bifurcations. In contrast, areal damage refers to damage with an areal extension in the images, including but not limited to spalling, efflorescence, scaling, and corrosion. By differentiating between these two damage types, we can apply tailored techniques to each, which enhances the accuracy and reliability in detecting and analyzing structural damage. Figure 1 illustrates examples of both types of damage.
For detecting the damage in the images, we aim for image segmentation, a process also known as pixel-level classification. This method provides contour-sharp detection, offering a significant improvement over commonly-used bounding box approaches. By considering each pixel individually, we can accurately follow the path of linear damage and trace the exact boundaries of areal damage, yielding a higher level of detail and accuracy than conventional techniques.
Building on the segmented damage, we diverge into separate strategies for further analysis of linear and areal damage types. For linear damage, such as cracks, our focus primarily lies on detection within the images. Given their narrow nature, further analysis beyond this level poses challenges. Therefore, we consider the image masks provided by the image segmentation as sufficient for our purpose. On the other hand, the analysis of areal damage extends beyond mere detection. We aim to assess this type of damage in greater detail, with a focus on determining the area and depth of the damage on a metric scale. This includes quantifying the area numerically and representing the depth using depth maps. Such an extended approach deepens the understanding of the severity and potential impact of the damage, thus contributing to a more holistic view of structural damage.
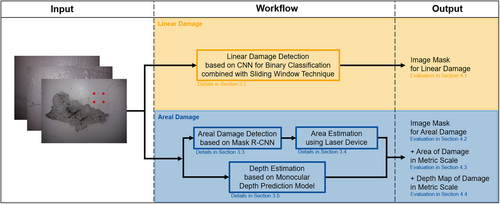
Our holistic framework to damage detection and analysis involves a multifaceted structure, comprising individual methods specifically tailored to each task. For the detection of linear damage, we employ a classifier based on a custom-designed CNN. This CNN is applied in a sliding window manner to achieve segmentation of the damage (Section 3.2). This procedure is particularly effective for small-scale, thin, and linear structures. In contrast, for the detection of areal damage, we employ Mask R-CNN, a state-of-the-art method for object detection and instance segmentation (Section 3.3). This method performs well with larger structures, inherently providing an image mask for each detected instance of damage. To quantify the area of areal damage, we propose the use of a laser projection device (Section 3.4). The projected laser points captured within the images serve as a reference, allowing for the establishment of the image scale. Finally, to estimate the depth of areal damage, we investigate the potential of pretrained models for depth prediction in monocular images, particularly trained for the distinct domains of indoor and outdoor scenes (Section 3.5). Figure 2 provides an overview of our designed workflow for the holistic damage analysis. Moving forward, the subsequent sections will expand on each technique mentioned above.
3.2 Linear damage detection
In this section, we describe our method for detecting linear damage in images using a customized CNN. This CNN is specifically designed for the binary classification of concrete surface images, with a flexible input size that is adapted to the specific requirements of our sliding window technique. We apply this technique with an exclusion principle to adapt the trained model from classification to segmentation, enabling the detection of linear damage. This strategy is able to handle images of concrete surfaces with various types and formations of linear damage and surface characteristics.
The basis for the training, validation and testing of our CNN is the open-source dataset of Özgenel et al.12, 13. It contains a total of 40,000 images of concrete surfaces, half of which represent intact surfaces and the other half showing cracks. The images are in RGB color space and have a uniform resolution of 227 × 227 pixels. In order to prepare these images for our CNN, we resized them to match the varying input sizes required by our network for different stages of the study. This dataset exhibits a diverse range of surface types, clear visibility, and varying crack dimensions and patterns, which makes it suitable for our purpose. Figure 3 showcases some of the images from this dataset.

However, to enhance the model's ability for generalization and increase its robustness to potential sources of error such as misleading objects, we expanded this dataset by adding around 2000 image sections derived from larger, online-sourced images. These additional sections primarily feature parts of objects such as basement grids, window frames, concrete joints, and graffiti, which are elements that could commonly appear in damage images and potentially mislead the detection process. We randomly split this final dataset into 70% for training, 20% for validation, and 10% for testing.
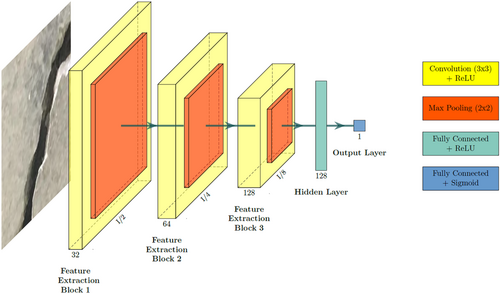
Our CNN has a feature extraction structure as its backbone, composed of three consecutive layers of convolution and pooling. Each convolutional layer features a uniform kernel size of 3 × 3 pixels, with the depth progressively increasing from 32 in the first layer, to 64 in the second, and finally to 128 in the third. The pooling layers, performing maximum pooling with a kernel size of 2 × 2 pixels, reduce spatial dimensions while preserving critical information. As an example, for an input size of 64 × 64 pixels, the final feature maps produced by this structure would have dimensions of 8 × 8 × 128. Here, “8 × 8” represents the width and height of the feature maps, indicating their spatial dimensions, and “128” refers to the number of feature channels, which is the depth of the feature maps. It is important to note that the height and width of the feature maps vary depending on the specific input size used in our different experimental setup for investigating the optimal parameters in combination with the sliding window technique.
After feature extraction, the feature maps are flattened to a 1-dimensional vector and fed into a fully connected network for classification. This part of the network includes a hidden layer with 128 neurons, combined with a rectified linear unit as its activation function. The final output layer features a single neuron with the Sigmoid activation function, squashing its input value into the range between 0 and 1, interpreting the output as a probability. Figure 4 illustrates our network architecture.
The training procedure begins with the initialization of the CNN weights, which are randomly set following a uniform distribution. We employ binary cross entropy as loss function, a common choice for binary classification tasks. The subsequent training with the data uses the stochastic gradient descent as optimizer, with a learning rate of 0.001 and a momentum of 0.9. This training procedure was conducted for all investigated input sizes until convergence was reached and a classification accuracy of around 99% was achieved with the test dataset.
To adapt this model from classification to segmentation, we implemented a sliding window technique. This process involves extracting individual sections of the image and feeding them to the model for classification. The predictions for these sections are then projected back onto the original image. Repeating this process across the entire image, using either adjacent or overlapping sections, achieves semantic segmentation for the linear damage. Figure 5 illustrates the segmentation procedure by applying the sliding window technique.
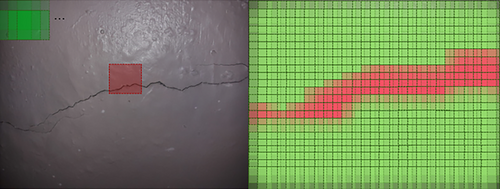
In general, processing with adjacent sections only yields a rather coarse segmentation of the image. To achieve finer segmentation, we perform this procedure with overlapping windows, where the overlap is >50%. This leads to multiple predictions for each pixel. Subsequently, for a robust and unique classification of the individual pixels, we apply an exclusion principle. According to this, we initially assign each pixel in the entire image to the class of “linear damage”. When performing the sliding window technique, if a window's classification for a particular pixel is “intact”, that pixel is ultimately reclassified as “intact”. This decision is based on the fact that a classification of “intact” for any window indicates the absence of damage for all pixels within that window. In contrast, a classification of “linear damage” for a window suggests that the damage may be located anywhere within that window, but not necessarily at every pixel. This approach thereby minimizes the risk of false identification of linear damage, ensuring a more accurate and reliable segmentation. Algorithm 1 illustrates this entire procedure in the form of pseudocode.
Algorithm 1. Semantic segmentation of linear damage by applying a sliding window technique with exclusion principle
Require: input_image, window_size, stride, trained CNN-classifier, threshold.
Ensure: binary_image with linear damage marked as white and the rest as black.
1: binary_image create_empty_image(input_image.width, input_image.height, color = white).
2: for y 0 to input_image.height - window_size with stride do.
3: for x 0 to input_image.width - window_size with stride do.
4: window extract_window(input_image, x, y, window_size).
5: normalized_window normalize(window).
6: probability cnn.predict(normalized_window).
7: if probability threshold then.
8: mark_window(binary_image, x, y, window_size, color = black).
9: end if.
10: end for.
11: end for.
12: return binary_image.
The size and stride of the window influence both the precision and reliability of the segmentation procedure. A smaller window stride results in a higher resolution in the analysis, thus allowing a more contour-rich segmentation of the cracks. However, if the stride is too small, it leads to increased computational cost and a higher chance for noise to be interpreted as a crack owing to more repeated analysis of the same areas. These factors need to be carefully adjusted to optimize the balance between precision and reliability. Furthermore, to ensure continuous coverage of the image and avoid gaps in the segmentation procedure, the stride must be equal to or less than the window size.
In order to identify the optimal parameters for the sliding window approach, we set up an experimental investigation that involved combinations of three different window sizes (64 × 64, 32 × 32, and 16 × 16 pixels) and four different strides (16, 8, 4, and 2 pixels) for the window. As mentioned before, we adapted the input layer of our CNN for each window size, ensuring compatibility with the different window dimensions, while the overall architecture of the CNN remained unchanged. The segmentation performance was assessed using the intersection over union (IoU) metric, which provides an objective measure of the overlap between the predicted and the ground truth image mask. From this examination, the best performing combination was found to be a window size of 64 × 64 pixels with a stride of 4 pixels. This configuration yielded an IoU score of around 0.6 for a representative sample image, indicating a high degree of effectiveness in the linear damage segmentation.
3.3 Areal damage detection
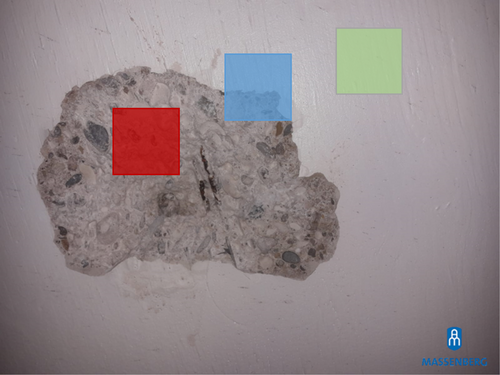
Addressing areal damage brings its own set of challenges compared with linear damage detection. Areal damage usually extends over a large part of the image, challenging the effectiveness of the previously presented sliding window approach. When processing an extracted section of an image containing areal damage, three scenarios can be encountered: It can include (1) exclusively the intact surface (Figure 6, green section), (2) exclusively the damage (Figure 6, red section), or (3) a portion of the damage and the intact surface (i.e., the border) (Figure 6, blue section). Distinguishing between these cases is challenging as both the damage and the intact surface can vary greatly in appearance and may even resemble each other. This complexity necessitates a more sophisticated approach to accurately detect and delineate areal damage.
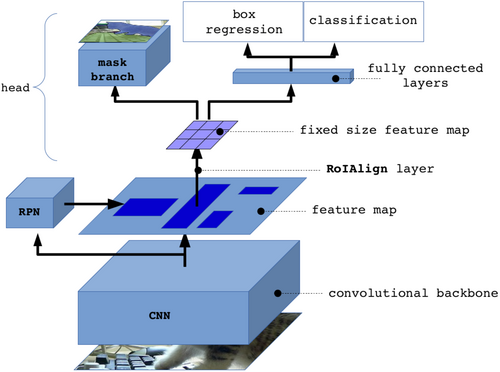
In response to these challenges, we implemented an additional neural network model tailored for areal damage. Specifically, we used Mask R-CNN, an extension of Faster R-CNN, as it currently represents the state-of-the-art for instance segmentation. It operates by first using a CNN backbone to generate feature maps from input images. A RPN then scans these feature maps for regions where objects are more likely to be located. Subsequently, these regions are resized to a fixed size using a Region of Interest Align (RoIAlign), facilitating their transfer to the following fully-connected layers. These layers then perform both a classification of the regions and a regression for the coordinates of a bounding box. A Softmax (normalized exponential function) activation function is employed for classification. The bounding box regression refines the coordinates of the regions initially proposed by the RPN, ensuring a precise fit of the objects within the bounding box. An additional branch after the RoIAlign, running parallel to the fully connected layers, is the distinguishing feature of Mask R-CNN to its predecessor. This branch transfers the scaled regions into a fully convolutional network, generating precise binary masks for the objects in these regions. As a result, for each input image, the Mask R-CNN outputs a class prediction for each detected region, refined bounding box coordinates for each identified object, and contour-sharp segmentation masks that delineate the exact boundaries of each object. Figure 7 shows an overview of the architecture of Mask R-CNN.
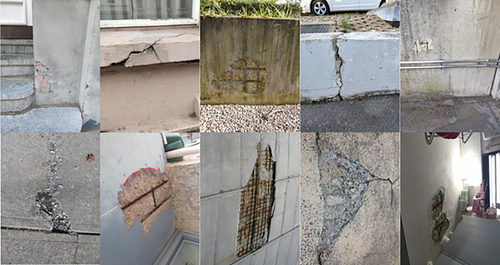
In our study, we utilized a pretrained Mask R-CNN model, which we fine-tuned to suit our specific domain. This model was initially trained on the COCO63 dataset, a large-scale and diverse collection of images widely used in the computer vision community. To tailor this model for detecting areal damage, we conducted further training using an image dataset specifically of areal damage. This dataset comprised over a 1000 images, captured in public spaces and sourced through online searches by us. Each image was paired with a manually created segmentation mask as its label. To maintain consistency, both images and their corresponding masks were resized to a standard resolution of 800 × 600 pixels. This dataset was then split into 80% for training, 10% for validation, and 10% for testing. Some sample images of this dataset are shown in Figure 8.
To optimize the performance of our model, we conducted an extensive search over the hyperparameters. These hyperparameters are pivotal, as they define the neural network's structure and significantly influence its behavior during training. We selected the Adam optimizer, which is known for its efficiency, and set a learning rate of 0.0001 and a momentum of 0.9. Additionally, we applied gradient clipping with a norm of five, a technique to prevent gradient explosion by capping the magnitude of gradient values. To enhance the diversity of our training dataset and make our model more resilient to variations, we implemented geometric data augmentation techniques, such as rotations, scaling, and mirroring.
In the training process of the Mask R-CNN model, three types of losses are considered: mask loss, bounding box loss, and class loss. To ensure a higher accuracy for the predicted masks, we assigned additional significance to the mask loss during the validation procedure by multiplying it by a factor of 10. The training was then conducted over a total of 100 epochs, each involving 350 iterations. Upon completion of the validation procedure, the overall loss of the model, which represents the sum of all three types of losses, amounted to 3.604. Furthermore, an average precision (AP) of 0.487 was achieved. The AP is a common metric in computer vision tasks, measuring a model's ability to accurately localize and classify objects, with a higher value indicating superior performance.
3.4 Damage area quantification
The imaging procedure of a real-world 3-dimensional scene onto the 2-dimensional sensor of a camera represents a perspective projection. This process inherently causes the loss of image scale, a critical component when assessing the true-to-scale dimensions of damage detected in images.
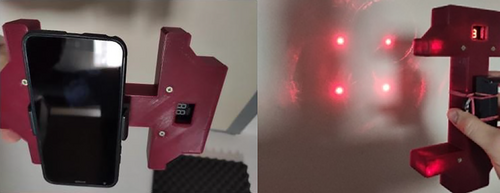
To address this issue and reintroduce the image scale, we designed and manufactured a custom laser projection device using 3D printing. This device, with an approximate H-shaped structure, accommodates four laser diodes arranged in a square pattern and aligned in parallel. This arrangement is designed to project four laser points onto the surface, intended to be equidistant in ideal conditions. The device also includes a smartphone bracket, facilitating a calibrated capture of the laser points by the smartphone camera. In addition, it is battery-powered to provide mobility. Figure 9 shows the laser projection device.
The introduction of the image scale is only possible for planar surfaces. This process requires the known distance between the projected laser points on the surface. In case the device is aligned perpendicular to the surface, the distance of these points is equivalent to the known distance between the laser diodes embedded in the device. However, if the device is angled obliquely to the surface, the projected points form a distorted pattern on the surface, no longer maintaining their square formation or known distance. Consequently, for accurate scale determination, it is crucial to align the device as close to perpendicular with the surface as possible.
- Convert the RGB image to HSV and apply a value threshold to isolate red pixels.
- Use morphological operations like closing to reduce noise.
- Detect and retain only significant contours in the resulting image.
- Compute the center of mass (moment) for the retained contours.
- From each contour's center, examine the surrounding area for a color gradient from white to red.
- Verify that the number of remaining candidates equals four.
- Verify the four points approximate a square by comparing adjacent distances to their mean.
Following the successful detection of the laser points and the extraction of their respective coordinates, we employ this information to finally reintroduce the image scale and quantify the damage area. This is accomplished by first calculating the area of the square formed by the laser points, measured in pixels. Given the known real-world measurement of this area, we are able to determine the ratio between the real-world measurement and the pixel count. This ratio provides us with the image scale, which allows us to convert measurements taken in pixels to real-world measurements. Hence, given the area of the detected damage in pixels from our image segmentation procedure, we can quantify its real-world area simply by multiplying the pixel area by the determined image scale.
3.5 Damage depth estimation
While the previous section outlined the introduction of image scale and quantification of damage areas, obtaining depth information is a separate challenge. This is because monocular images, by their nature, lack the capacity for depth perception, which typically requires a binocular or multi-view perspective.
Despite the traditional limitations of monocular images in capturing depth information, recent advancements have opened new possibilities. Various researchers64-67 have developed models based on deep learning that are capable of predicting depth maps from monocular images. These models are designed to assign depth values to the image, although the resulting depth maps often have a lower resolution compared with the original image. The feasibility and success of such approaches have been demonstrated in several domains, including indoor and outdoor scenes.
In this study, we aimed to explore the efficacy of such deep learning models for estimating the depth of damage. As these models rely on supervised learning, their training requires paired data: images of the damage (input) and corresponding depth maps (labels). While capturing images of damage is a straightforward task, creating or acquiring corresponding depth maps, potentially through methods like photogrammetry or laser scanning, is a more elaborate process requiring additional specialized equipment and complex data processing.
Given the difficulty of producing a substantial amount of depth maps for label generation, we chose to deploy pre-existing models trained on different datasets without additional transfer learning or fine-tuning. We utilized the model developed by Laina et al.,64 which is based on the ResNet-50 architecture. The structure of this model includes modifications where the fully connected layers are replaced with specific up-sampling blocks, outputting an image mask representing the depth map at a resolution of roughly half the input size of 304 × 228 pixels. Figure 10 shows the architecture of this model.
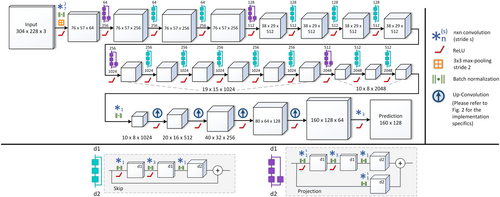
For our investigation, we prepared two versions of the model: one trained on the NYU-Depth V268 dataset, and the other on the Make3D dataset.69-71 The NYU-Depth V2 dataset, published in 2012, consists of indoor scenes captured by Microsoft Kinect and features RGB-D images with a resolution of 640 × 480 pixels. In contrast, the Make3D dataset, published in 2009, contains outdoor scenes captured with a custom 3D scanner and provides RGB images with a resolution of 1704 × 2272 pixels, along with corresponding depth maps at a resolution of 305 × 55 pixels. Both versions of the model were deployed to evaluate their capability in estimating the depth of areal damage.
4 RESULTS
In this section, we present the results of our multifaceted approach for the holistic analysis of damage. The results are divided into four subsections, each focusing on the different aspects of our damage analysis methodology: linear damage detection, areal damage detection, damage area quantification, and damage depth estimation.
4.1 Evaluation of the linear damage detection
To evaluate our method for linear damage detection, we curated a dataset of 46 images, representing a heterogeneous selection of real-world damage scenarios. We captured these images ourselves, predominantly featuring cracked concrete surfaces, in a variety of public spaces. To ensure consistency, all images were taken using the same smartphone, under similar lighting conditions and with a consistent viewing direction. Our primary intention in curating this dataset was to compile a realistically diverse and representative set of evaluation data, encompassing a range of challenging real-world damage scenarios. However, in our dataset, we do not differentiate between the various causes of the cracks, such as corrosion or other factors, focusing solely on the visual characteristics of the damage itself. The ground truths, in the form of binary masks, were created manually with considerable effort for each of these images, precisely highlighting the linear damage.
Figure 11 presents a subset of the evaluation images, together with the predicted image masks for linear damage. These visual results provide an insight into the varied performance of our method for linear damage detection in the different real-world scenarios. The results not only underscore the strengths of our approach in handling diverse and challenging situations, but also highlight areas that require further refinement.

For instance, in scenarios featuring relatively unmarked surfaces as shown in the upper images, our method performs exceptionally well. However, transitioning to more complex scenarios presents a greater challenge. These include situations with graffiti, where the contrasting and often irregular patterns can be mistaken for damage. Other challenging scenarios include those with windows, basement grids, or concrete joints, which can cause our method to misinterpret the regular linear patterns as linear damage. In scenarios with surfaces that have a strong texture or pattern, the method sometimes struggles to distinguish between the inherent surface texture and actual damage. Lastly, surfaces with plants or other biological growth present similar challenges, as the irregular, often linear features of the plants can be misinterpreted as damage.
For a quantitative evaluation, we used the IoU as metric. IoU is computed as the area of overlap between the predicted and ground truth mask divided by the area of their union, providing a normalized measure of the match. This yielded a mean IoU score of 0.1165 for all evaluated images. While this value may seem modest, it is important to consider the intrinsic difficulties of linear damage detection. Even a minor over-segmentation of thin linear structures can dramatically influence the IoU, making this a particularly challenging metric for such tasks. Despite the inherent complexities of the task, our method has been evaluated across a diverse set of conditions and has consistently provided meaningful results.
4.2 Evaluation of the areal damage detection
To evaluate our method for areal damage detection, we further assembled another dataset of 38 images. These images represent a heterogeneous selection of real-world damage scenarios, predominantly featuring spalling on concrete surfaces in various public spaces. To ensure consistency in our evaluation, all images were taken using the same smartphone, under similar lighting conditions, and with a consistent viewing direction, just as we did with the linear damage dataset. Our aim with this dataset was to gather a wide range of areal damage cases, reflecting the variety of real-world scenarios. Similar to our approach with the linear damage dataset, we manually generated the ground truths for these images. This involved creating binary masks for each image with considerable effort, accurately highlighting the areal damage.
Figure 12 showcases a subset of the images for evaluation, along with the predicted image masks for areal damage. These visual results offer an insight into the varying performance of our method for areal damage detection across different real-world scenarios. The figure not only demonstrates the strengths of our method in managing diverse and demanding situations but also indicates the areas requiring further enhancement.
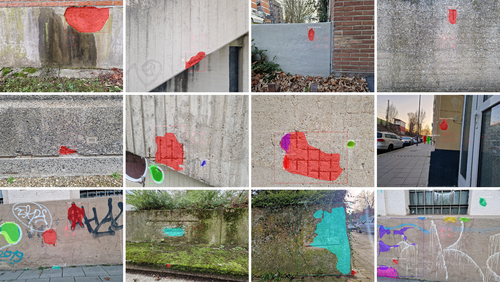
For instance, our method exhibits effective performance when dealing with instances of areal damage that are clearly outlined from the intact surface, as demonstrated in certain images. Nonetheless, it encounters challenges under particular conditions. These include scenarios where the damage is not clearly visible or their boundaries are not distinctly defined, causing the method to struggle in accurately delineating the full scope of damage. Additionally, scenarios featuring elements like graffiti can mislead the method, causing it to identify these as damage. In rare cases, the algorithm might even overlook some damage.
For a quantitative evaluation, we used the metric of average precision (AP). AP is a measure that evaluates the combined performance of precision and recall across various decision thresholds for detecting instances of a class. The AP for our evaluation dataset resulted in 0.551. Given the complexities of the images, with varying surface characteristics and disturbing objects, this result is a realistic reflection of our method's performance in complex real-world scenarios.
4.3 Evaluation of the damage area quantification
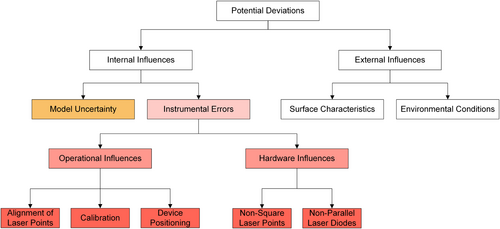
Our approach for quantifying the area of damage is influenced by a variety of factors that can cause deviations from the true area. These factors can be broadly divided into two groups: external influences, such as environmental conditions or the characteristics of the damaged surface, and internal influences inherent to our proposed approach. Given this potential for deviations, our primary focus is on internal influences, which are directly related to our methodology and our deployed device and thus within our control.
The internal influences mainly originate from two sources: uncertainties from our model's predictions and instrumental errors tied to the laser projection device and its deployment. In particular, uncertainties from our model's predictions may arise when the model fails to correctly identify and delineate the damage depicted in the images.
Similarly, the laser projection device and its operation carries its own influences. Hardware-related aspects, such as the imperfect alignment of the laser diodes or deviations in the ideal form of the projected laser points, can directly influence our measurements. Likewise, operational elements such as the positioning of the device, its calibration, and the alignment of the projected points on the surface, can introduce inaccuracies. These discrepancies arise when hardware or operational procedures diverge from the ideal, leading to potential variances in laser projection, which could impact the precision of the measurements. Figure 13 categorizes these diverse sources of inaccuracies in our damage area quantification approach.
In the previous subsection, we already provided an evaluation for the accuracy of our model's predictions. Therefore, in this subsection, we focus on the instrumental errors associated with the laser projection device and its operation in the damage area quantification. To isolate these, we replaced the model-predicted image masks for the damage with manually created ground truth masks. This procedure allows us to concentrate on influences associated solely with the device and its operation, effectively eliminating uncertainties tied to the model's predictions.
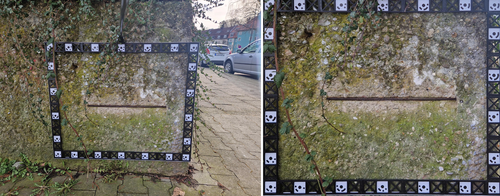
In order to establish accurate reference values for the damage area, we manufactured a custom reference frame using 3D printer. The frame, which measures ~83 × 68.5 cm2, is equipped with a bar on top that simplifies attachment to flat surfaces like walls, facilitating convenient image capturing with a camera. Moreover, the frame incorporates evenly spaced markers with known coordinates, fulfilling two crucial roles. Firstly, they allow for rectification of any perspective distortions in the images, which can mainly occur owing to an oblique view of the camera to the object surface. Secondly, they enable the introduction of scale into the rectified images. Figure 14 shows the process of rectification, with the reference frame placed on a damaged surface exhibiting slight perspective distortion in the image (Figure 14, left), and the rectified version of the same image (Figure 14, right). By comparing the damage area quantified using the laser projection device (see Section 3.4) with the reference values obtained using the frame, we are able to determine the margin of error associated with the device.
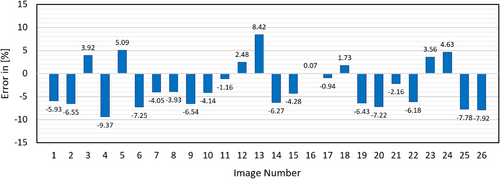
In our evaluation using 26 images of areal damage, we found a mean absolute error (MAE) of 4.92% and a root mean squared error (RMSE) of 5.49%. While there was some variability in the individual errors across the images, as detailed in Figure 15, the error range spans from 8.42% to −9.37%. However, the MAE and RMSE values indicate that the overall level of error is well managed. The results indicate that, despite uncertainties related to the device and its operation, our approach for quantifying damage area provides a satisfactory degree of accuracy for practical applications.
4.4 Evaluation of the damage depth estimation
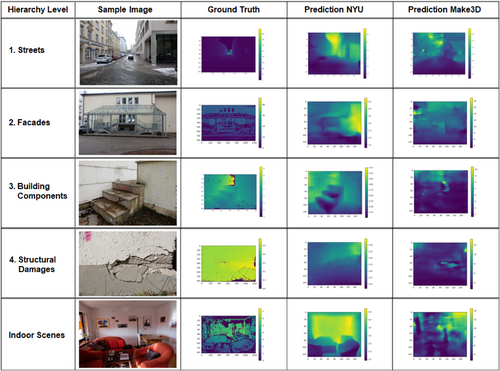
Our approach for depth estimation of areal damage using both models (trained on the datasets of NYU-Depth V2 and Make3D) for monocular depth prediction presents a unique set of challenges. This is largely owing to the fact that these models were originally designed and trained for distinct domains, specifically interior and outdoor scenes, which differ significantly from the context of areal damage assessment. To understand the potential disparities in results, we conducted an in-depth evaluation of both models across various hierarchical structural levels. These ranged from street-level scenes to building facades and building components, down to specific structural damage. These hierarchy levels show different levels of detail in our assessment. The evaluation was further extended to indoor scenes, matching the training dataset of the NYU model, to evaluate the model's performance in the same domain.
In our evaluation dataset, we included RGB images and corresponding ground truth depth maps for each of the four hierarchical levels, as well as indoor scenes. We captured these images using a pre-calibrated DSLR (digital single-lens reflex) camera. The ground truth depth maps were generated using multi-image photogrammetry, a technique that involves capturing overlapping images of a scene from various angles. This technique can be challenging, especially when identifying point correspondences on white or low-texture surfaces, which may result in incomplete depth maps. To calibrate the scale of the image, we either attached markers to the scenes or utilized naturally occurring reference points. Overall, we collected about 30 “motifs” for each hierarchical level and 15 for indoor scenes. Each motif consisted of ~25–40 RGB images and 60–85 corresponding depth maps.
Quantitative evaluation for the predicted depth maps was carried out using a series of metrics. In this process, every point in the predicted depth map was considered an individual prediction and was compared with the corresponding depth value in the ground truth map. In cases where the ground truth depth map lacked reference values owing to the aforementioned challenges, the respective predictions were not considered in the evaluation.
The threshold accuracy quantifies the proportion of predictions that have an error below a specific threshold relative to the total number of predictions. In our evaluation, we used the same three threshold values as those used by Cao et al.72: threshold 1 ( < 1.25), threshold 2 ( < 1.252), and Threshold 3 ( < 1.253). Besides these, we considered multiple error metrics, including mean relative error (MRE), squared relative error (SRE), root mean square error (RMSE), and root mean squared log error (RMSE-log). Figure 16 summarizes the results for the three threshold accuracies as well as for the four other metrics.
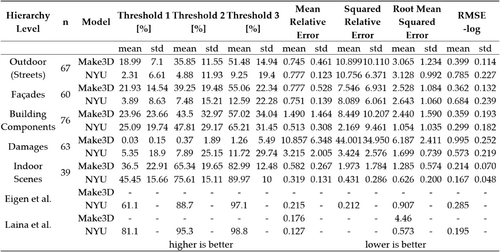
The quantitative results demonstrate that the NYU model delivers threshold accuracies for indoor scenes broadly comparable to those provided by Laina et al.64 and Eigen et al.65, 66 No comparative reference is available for the Make3D model by Laina et al. or Eigen et al., but it shows slightly poorer threshold accuracies for indoor scenes compared with the NYU model. Moreover, both models yield decreased threshold accuracies for all four hierarchy levels. The visual results, as shown in Figure 17, align with these findings. The discrepancy in results for damage may be attributed to significant differences in their appearance compared with the training dataset of both models (indoor and outdoor scenes) and a distinct depth distribution in the depth maps owing to the average distance between the camera and the object surface being around half a meter.
5 DISCUSSION
Our study presents a significant contribution to the field of damage detection and analysis by addressing two crucial challenges that have persisted in traditional research. Conventionally, studies in this domain have relied on a single model for the detection of various types of damage, often leading to compromises in specificity and accuracy for different types of damage. Additionally, the majority of previous research has focused predominantly on damage detection within the confines of images, often overlooking the inclusion of real-world dimensions of the damage. The few studies that have attempted to incorporate real-world scale information generally employ expensive, complex, and bulky devices.
To address these limitations, we have designed a novel approach that employs a multifaceted damage detection structure. This framework utilizes dedicated models for different damage types, thereby enhancing their specificity and accuracy. As an additional innovative measure, we incorporated real-world scale into our system using a cost-efficient laser projection device. Importantly, to ensure the robustness and practicality of our solution, we have thoroughly evaluated our approach using self-captured datasets derived from realistic and complex scenes. This thorough evaluation strategy offers a realistic perception of our overall approach's efficacy and provides insights into its performance under diverse real-world conditions. In the following subsections, we further explore these complementary methods, highlighting their strengths and limitations, and discussing their performance and implications in detail.
5.1 Linear damage detection
Our approach for detecting linear damage like concrete cracks makes use of a CNN designed for binary classification. The simplified architecture of this model enables efficient and fast classification, making it suitable for real-time applications and deployment on resource-limited devices such as embedded systems or smartphones. A key feature of our method is the utilization of a sliding window approach for segmenting the damage. This technique allows the model to concentrate on specific regions within the image, thereby facilitating the detection of thin and elongated objects like cracks. This subtle type of damage can often be missed when analyzing the image as a whole.
The evaluation of our method presented a relatively modest mean IoU score, especially when compared with other models or domains. However, it is crucial to contextualize this score within the unique challenges of detecting linear damage. Cracks in concrete, which typically only occupy a few pixels in width, present an ill-posed problem. Even a minor over-segmentation when dealing with such thin features can have a significant negative impact on the IoU score. Also, Benz et al.18 highlighted the limitations of standard metrics like IoU and proposed alternative measures specifically for crack detection. Moreover, the ground truth labeling process—a manual task that involves tracing the thin, complex, and sometimes ambiguous crack patterns—can introduce its own set of inaccuracies. As highlighted in the study of Stricker et al.,31 the precision of these manually created labels greatly influences the derived metrics for evaluation, introducing an additional level of uncertainty to the results. Despite these inherent challenges and the seemingly modest numerical results, visual evaluations highlight our method's effectiveness. The outcomes, when visually inspected, demonstrate the capability to reliably identify and segment linear damage in real-world images. This underlines the importance of considering the practical context of application when evaluating the performance of a method, beyond solely relying on numerical metrics.
5.2 Areal damage detection
To detect areal damage such as concrete spalling, we utilized the more sophisticated yet resource-intensive Mask R-CNN. Unlike a CNN combined with the sliding window technique, Mask R-CNN processes the whole image at once, enhancing the detection of larger, areal damage. Its use of anchor boxes facilitates recognition of varied shapes and sizes, a crucial feature for dealing with heterogeneous areal damage.
In our study, the Mask R-CNN model showed promising performance, confirmed by the average precision (AP) score and visual inspections of the outcomes. This performance was accomplished by utilizing pre-trained weights, employing transfer learning, and integrating artificial data augmentation strategies. Nevertheless, the model demonstrates some limitations, particularly when processing images containing complex real-world elements such as graffiti or plants. The challenging nature of the images used for evaluation, which were captured in varied real-world conditions, contributes to these struggles. Moreover, the study emphasizes the necessity of a diverse and extensive dataset for optimal generalization. Despite being trained on a dataset of over 1000 self-compiled images, the model exhibits specific limitations in handling certain scenarios.
5.3 Damage area quantification
The custom-designed laser projection device for introducing the image scale is simple to use, low-cost, lightweight, and portable. This convenience enhances accessibility and usability across varied settings and conditions, eliminating the need for expensive or bulky equipment.
Our evaluation shows that this approach allows for reasonably accurate quantification of damage area, with errors less than 10%. However, the accuracy of the device largely depends on maintaining a perpendicular alignment to the surface under examination. Deviations from this perpendicular positioning, such as high inclination angles, could introduce substantial deviations in the measurements. Furthermore, the laser projection device, in its current state, may exhibit imprecision owing to the laser diodes not being perfectly parallel. This can cause the projected laser points to display slightly different arrangements depending on the distance to the surface, considerably affecting the accuracy of area quantification. A more meticulously constructed device, ensuring parallel alignment of the laser diodes, would significantly enhance the accuracy of the area measurements.
5.4 Damage depth estimation
We employed monocular depth prediction models for depth estimation of areal damage, which require only a single input image, thus bypassing the need for any additional data or hardware. This offers a contrast to techniques such as stereo vision, structured light, and LIDAR, which typically require multiple images, complex setups, or sophisticated and costly hardware to retrieve 3D information.
The deployed models demonstrated a notable performance for indoor and outdoor scenes. However, since they were trained on general indoor and outdoor scenes, they faced challenges in accurately estimating depth for damage. While improving these models' performance through fine-tuning or transfer learning is conceivable, the process involved is relatively complex. Collecting paired damage images with corresponding depth maps is not only time-consuming, but also intricate, further emphasizing the challenges of applying these models in practical scenarios.
6 CONCLUSION
6.1 Summary
In this paper, we presented a holistic approach for the image-based analysis of damage in concrete surfaces. Our approach leverages a multifaceted structure that integrates four complementary methods designed for detecting linear and areal damage in images, and quantifying the damage area as well as estimating the depth of damage.
- For linear damage detection, a light-weight CNN was presented, which was designed and trained for binary classification of images to the classes “linear damage” and “intact”. This model is combined with a sliding window technique for classifying overlapping sections of an image, which facilitates semantic segmentation of the whole image. Comprehensive examinations were conducted to optimize the window size and the window stride. For our self-captured image dataset for evaluation, which contains challenging examples of linear damage, the IoU score showed rather modest, but visual assessments affirmed the methods effective detection of linear damage.
- For areal damage detection, a pretrained Mask R-CNN was used, which was initially subjected to transfer learning with a self-compiled dataset of areal damage like concrete spalling. The model provides instance segmentation for areal damage in its basic form. For our self-captured image dataset for evaluation, which contains challenging examples of areal damage, the AP showed promising results, which, however, have further space for improvement.
- To quantify the area of damage, a customized laser projection device incorporating four parallel laser diodes was presented. The laser device projects four laser points onto the surface to be measured, which allows to introduce the image scale. Evaluations on 26 images showed that the area of areal damage can be quantified with errors <10%.
- To estimate the depth of areal damage, two deep learning models were investigated. Both models share the same architecture and were optimized and trained for depth estimation of indoor and outdoor scenes and are deployed to damage without any changes. The evaluation was conducted hierarchically for different levels of building infrastructures and additionally for indoor scenes. For indoor and outdoor scenes, it achieved reasonably good results as excepted. However, for damage the model provided unsuitable results.
6.2 Outlook
The presented approach still requires some optimizations to reach an improved performance for the overall assessment of structural damage. The models deployed for detecting linear and areal damage could be enhanced through a couple of key improvements. This includes, for example, implementing image preprocessing to address challenges such as shading and irregular illumination, which can often be caused by spot flash. Additionally, the training dataset could be further expanded to be more diverse and comprehensive, which would enable the deployed models to better generalize when identify the damage, thereby improving detection accuracy and reducing the rate of false positives. Furthermore, the model used for depth estimation should undergo fine-tuning and transfer learning with image data of damage to achieve better performance for the domain at hand. In terms of equipment, the laser projection device should be manufactured with higher precision and include adjustable components for increased accuracy. Additionally, deploying adjustable mounts or articulating arms could prove beneficial, facilitating access to areas that are otherwise difficult to reach. Developing a complementary smartphone application could further help for alignment of the device by utilizing the inclinometer and camera to verify alignment and check the arrangement of laser points. To avoid the restriction of capturing the damage only in perpendicular direction to the object surface, rectification techniques for correcting perspective distortions in images could be deployed by considering the formations of the laser points in the image.
ACKNOWLEDGMENT
Open Access funding enabled and organized by Projekt DEAL.
CONFLICT OF INTEREST STATEMENT
The authors declare no potential conflict of interests.
Biographies

Barış Özcan, RWTH Aachen University, Geodetic Institute and Chair for Computing in Civil Engineering and Geo Information Systems, Mies-van-der-Rohe-Str. 1, 52074 Aachen, Germany. Email: [email protected]

David Crampen, RWTH Aachen University, Geodetic Institute and Chair for Computing in Civil Engineering and Geo Information Systems, Mies-van-der-Rohe-Str. 1, 52074 Aachen, Germany. Email: [email protected]

Zeno Kratzer, RWTH Aachen University, Geodetic Institute and Chair for Computing in Civil Engineering and Geo Information Systems, Mies-van-der-Rohe-Str. 1, 52074 Aachen, Germany. Email: [email protected]

Jörg Blankenbach, RWTH Aachen University, Geodetic Institute and Chair for Computing in Civil Engineering and Geo Information Systems, Mies-van-der-Rohe-Str. 1, 52074 Aachen, Germany. [email protected]
Open Research
DATA AVAILABILITY STATEMENT
The data that supports the findings of this study are available in the supplementary material of this article.


