Exploring the Structure–Property Relationship in Spheroidized C45EC Steel Using Full Phase Crystal Plasticity Numerical Simulations
Abstract
Herein, micromechanical simulations for three different states of spheroidized steel (C45EC) are conducted under quasi-static tensile loading based on the actual texture and crystallographic orientation from electron backscatter diffraction (EBSD) data. Data denoising is conducted with MTex (open-source Toolbox with MATLAB) for cleaning up the EBSD data. Crystal plasticity-based full phase numerical simulations are performed on these constructed representative volume elements (RVEs) to analyze the local stress and strain evolution in C45EC steels. The local results of the simulations exhibit important insights into deformation evolution influenced by the size and clustering of cementite particles as well as crystallographic orientations of ferrite grains. It is observed that the full phase simulation model helps predict the local microstructural details for overall mechanically improved properties of the steels. Spheroidized steel samples (97%) show the most favorable mechanical response as adequate strain hardening with extended elongation is desired for cold-working of parts. The current work is another step forward to fine-tune the microstructural attributes of medium carbon steels for an improved mechanical response.
1 Introduction
The technological development of novel and existing materials helps advance scientific knowledge and strengthens economic growth.[ 1 ] This advancement pushes the knowledge-led economy by providing improved production alternatives which utilize optimum resources. The recently developed composite materials have provided a remarkable combination of microstructural attributes based on mechanical properties and production resource utilization.[ 1, 2 ] The durability of the products, human safety, and understanding of manufacturing processes are the notable outcomes of this specialized materials progress in land and space transportation.[ 3 ]
The challenges of forming medium carbon steel sheets and rods have always been of great interest to materials scientists and engineers. Full phase numerical simulations of crystalline materials based on actual electron backscatter diffraction (EBSD) data have the potential to uncover the plastic behavior during deformation at the crystal level.[ 4 ] Numerous implemental studies have evaluated the material response under different loading conditions.[ 5-7 ] The global mechanical response of crystalline materials—on the component scale during deformation—is dependent on microscopic parameters of each phase, i.e., grain size, crystallographic orientations, and location in the polycrystalline aggregate.[ 5, 8, 9 ] Therefore, it is indispensable to understand the effect of such attributes of material constituents on localized stress and strain behavior using modern methods and techniques.
A representative volume element (RVE) is defined by Gitman et al.[ 10 ] as a sufficiently smaller portion of a macroscopic material containing all the necessary microstructure information. RVEs are used to address the restriction in the numerical simulations imposed by the central processing unit (CPU) time and memory of computers. Generally, two methods are used to get initial RVE used as an input for localized numerical simulations.[ 11 ] 1) Virtual RVE is constructed by putting the statistically correct microconstituents of material at the desired places with the required size and orientation. 2) Real RVE is captured and recorded via microstructure visualization methods, usually by EBSD analysis on scanning electron microscope (SEM) as a digital copy of the microstructural data.[ 11, 12 ]
Although virtual RVEs provide meaningful insight into micromechanical modeling of the polycrystalline materials, the real RVEs can accurately model the influence of second phase particle shape, size, morphology, and orientation in an improved way.[ 13-15 ] Therefore, actual EBSD data have been adopted to model the materials in the current study.
The ductility of carbon steels is influenced by postproduction thermal processing;[ 16 ] therefore, the spheroidization process improves the formability by breaking down the 3D pearlite–cementite laths into elliptical or spherical particles.[ 17, 18 ] The degree of lathy cementite conversion to spheroidal particles by a specially designed thermomechanical treatment process is called “spheroidization degree.” This results in improved mechanical properties of carbon steels, i.e., the hardness (HV10) with 50% spheroidization degree of medium carbon steel can lower from 326 to 229, resulting in better formability of the material.[ 19, 20 ] It also improves the service life of cold heading dies used for cold forging of medium carbon steels for making bolts, nuts, rivets, and screws.[ 7 ]
As the commercial spheroidization process consumes a significant amount of time and energy, therefore, suitable degree of spheroidization for specific material must be established to get the desired mechanical properties by utilizing the optimal resources.[ 13 ] This is a fairly challenging and technologically expensive process for which the microscopic attributes of steel need to be studied and optimized. The recent advances in crystal plasticity modeling and simulations have made it possible to virtually analyze the effect of microscopic attributes on the mechanical response of the crystalline material. For this purpose, a crystal plasticity-based numerical simulation model known as Düsseldorf Advanced Material Simulation Kit (DAMASK) is used.[ 21 ] This work is a continuation of efforts to achieve a better spheroidization state of medium carbon steel.
The current study is designed to advance the initial investigations from virtual RVEs of spheroidized medium carbon steels on micromechanical behavior reported by Umar et al.[ 13 ] to study the same attributes based on EBSD data of three spheroidization states of the same steel. The effect of spheroidization degree and heat treatment process on the microstructural evolution and ultimately on the deformation behavior of the material is analyzed under the application of uniaxial tensile load using numerical simulations. In addition, the effect of microstructural attributes, i.e., size, dispersion, and crystallographic orientations of the cementite particles in the ferrite grains on the global and local strain distribution, is studied and presented.
This article is organized in a nontraditional way. The background information from spheroidization of samples to their preparation for EBSD analysis is provided in Section 2, followed by the data cleaning on MTex. It also covers the complications and adopted solutions with pre- and postprocessing of numerical simulations data. Section 3 gives detailed descriptions of the input data and simulation results, explaining the insights in areas of interest for as-received and various thermomechanically processed material samples in three subsections for each material case, respectively. In Section 4, a comprehensive comparison of published literature results with current observations as well as limitations of the study and outlook is presented. Finally, in the end, in Section 5, the study has been concluded to include meaningful outcomes.
2 Methodology for Numerical Simulation Modeling
The study is designed to use EBSD data of the steel samples already prepared industrially by using a similar technique reported by Guk et al.[ 6 ] The initial framework presented in the study describes the experimental procedure of spheroidization annealing of the medium carbon steel (C45EC) samples. Steel under discussion contains 0.45% carbon, with approximately 7% cementite particles distributed in the ferrite matrix. The composition of the material with various elements in weight percentage is shown in Table 1 .
| Element | C | Si | Mn | P | S | Cr | Mo | Ni | Al | Cu |
|---|---|---|---|---|---|---|---|---|---|---|
| Percentage | 0.44 | 0.10 | 0.75 | 0.007 | 0.017 | 0.04 | 0.011 | 0.04 | 0.03 | 0.03 |
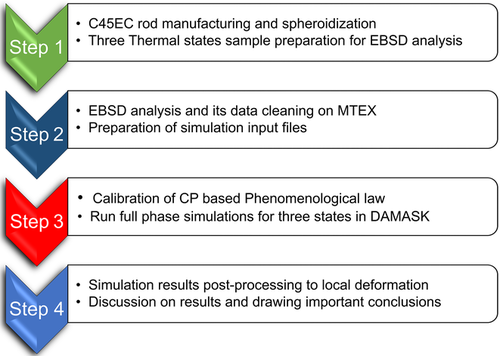
The step-by-step activities performed for this study, i.e., sample preparation, EBSD analysis, data cleaning, simulations, and data visualization in the form of a flow chart, are shown in Figure 1 .
2.1 EBSD Data Collection and Cleaning by MTex
The three cases of C45EC steel based on different spheroidization degrees considered in this study are shown in Table 2 , with statistical details about ferrite and cementite particle sizes. For calculating spheroidization degree, the micrographs are processed under SEM by ignoring very small cementite particles. During characterization, cementite particles with aspect ratios less than or equal to 1:3 are considered spheroidized and are calculated per unit area to estimate the material's spheroidization degree.
| EBSD State |
Spheroidization degree [%] |
Equivalent diameter [μm] |
Maximum grain size [μm] |
Number of grains | |||
|---|---|---|---|---|---|---|---|
| Fe | Fe3 C | Fe | Fe3C | Fe | Fe3C | ||
| As-received (HR) | 0 | 8.85 | 1.17 | 38.44 | 3.06 | 411 | 395 |
| HR-CR-S | 83 | 8.99 | 1.07 | 69.86 | 2.21 | 313 | 161 |
| HR-S-CR-S | 97 | 9.29 | 1.07 | 52.06 | 2.82 | 369 | 72 |
The orientation distribution of the material at the grain level can substantially influence the ductility at a global level.[ 22 ] Therefore, changes in crystallography at the microscale need to be estimated and understood for predicting deformation texture accurately.[ 23 ] 2D EBSD analysis in SEM–being a fast and convenient method to collect real-time microstructural data[ 24 ]–was performed after spheroidization annealing. During the scanning process, local material data were recorded with a step size of 0.5 μm on both the x and y axes. The data obtained from the EBSD scan are recorded in the form of .ang files, which generally contain point-wise details of 2D coordinates, phase, and crystallographic orientation in the form of Euler angles.
The experimentally collected EBSD data have a few discrepancies like with all other experimental systems. It needs careful postscan working to remove the noise, unindexed regions, and reference frame alignment issues. The random error can occur during indexing orientations using a traditional band detection method or pattern matching.[ 25 ] Systematic error may also arise due to imprecise alignment in specimen and pattern center, resulting in nonrealistic data at output. Although small at the time of detection, these errors may become considerable during amplification of the data during further calculations for kernel averaged misorientations (KAM), orientations curvature tensor, or geometrically necessary dislocation (GND) densities.[ 26 ] The process of reducing the random error up to the minimum level assumes that the actual orientations are space-dependent while noise is not.[ 27 ] There exists a denoising threshold of the process surpassing which the small precipitate particles can be engulfed, being considered as noise.[ 28 ]
The open-source toolbox called MTex has recently emerged as a robust tool for data denoising. It has several built-in filters for this purpose. The well-known ones are the mean filter, the Kuwahara filter, the median filter, and variational denoising techniques such as “smoothingSplinefilter.”[ 29 ] The mean filter uses a simple method to average down all the neighboring grains to get the orientations data and assigns this value of direction to the central grain/pixel to be cleaned. This method is assumed to remove the wrongly indexed orientation of a specific pixel located somewhere within the grain of known orientation. If nonindexed pixels further need to be reduced, this can be done by reapplying the filter using more neighboring pixels as the reference orientation information.
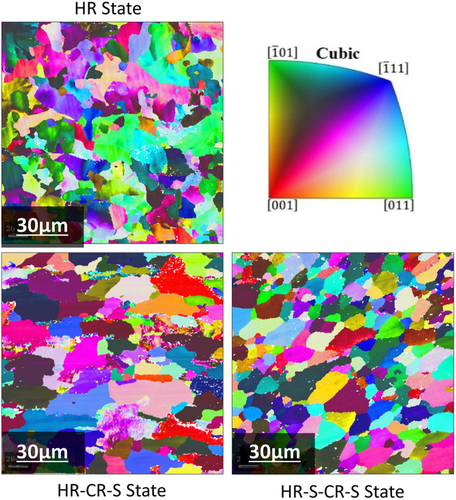
Similarly, the missing data can also be filled using the MTex by “filling the missing data in orientation maps” filter, which uses two methods. The first method used the “fill” option, which takes the mean value of orientation from the surrounding pixels and fills out the missing dots, while the other method used “halfQuadraticFilter” for the same purpose. The MATLAB routines used to generate the results by filling data from raw to the cleaned form are attached as Appendix A. MTex also helps with the material characterization in various subroutines available for plotting data concerning crystal orientation, KAM angle, GNDs, and inverse pole figure (IPF) maps. This tool can be easily integrated with MATLAB post-2015 versions and accessed using graphical user interface (GUI) for limited applications. The resulting IPF map for three spheroidization states of the steel samples obtained from EBSD analysis obtained is shown in Figure 2 .
2.2 Crystal Plasticity-Based Modeling and Simulations
The data after MTex postprocessing is converted into geometry input files for full phase simulations. For this purpose, a very interactive tool called Dream.3D is used for converting clean EBSD files into geometry descriptions and associated material configuration files. Then, these EBSD-based files and load definition files are fed as input into the crystal plasticity and continuum mechanics-based phase-field numerical simulation model called DAMASK. Being a crystal-level simulator, it solves coupled equations already defined for various crystalline phases, i.e., ferrite and cementite in this case.[ 30 ]
All 2D RVEs considered in this study are of 85 × 85 × 1 μm3 size. During EBSD analysis, it was assured that the magnification was enough to capture multiple ferrite grains for constructing a polycrystalline RVE. Therefore, the step size was chosen to be 0.5 μm for recording EBSD with appropriate resolution. The final size of each RVE is 476 × 476 × 1 pixels. This specific resolution is selected to assure that the number of elements for calculations is large enough to assign more than one element to individual cementite particles, which at some positions are slightly bigger than the selected step size.
| Parameter symbol | Ferrite | Cementite | Unit |
|---|---|---|---|
| C 11 | 233.3 | 375.0 | GPa |
| C 12 | 235.5 | 161.0 | GPa |
| C 44 | 128.0 | 130.0 | GPa |
| 0 | 5.6 × 10⁻⁴ | – | ms−1 |
| S 0,[111] | 95 | – | MPa |
| ,[111] | 222 | – | MPa |
| S 0,[112] | 96 | – | MPa |
| ,[112] | 412 | – | MPa |
| h o | 1 | – | GPa |
| h αβ | 1.0 | – | GPa |
| n, w | 3, 2.0 | – | – |
Here, , are reference hardening parameter and saturation stress, respectively. Phase parameters with the corresponding fitting parameters used in the material model are shown in Table 3. These phase parameters have been previously reported after calibration for C45EC steel.[ 15, 31 ]
The complementary conditions represented with “*” are applied on various coefficients of the second rank tensors in (1) and (2). Generally, for the cubic crystal structure of the ferrite phase, there are 24 slip systems dominantly involved during plastic deformation by tensile loading, 12 slip systems of the type {110} and 12 of type {112} with<111> direction family makeup 24 slip planes which are the most prone to the deformation.[ 32, 33 ]
The first step in the solution is executed when the material model homogenizes the individual point stress in the overall mean stress at the crystal level. The second step is solving the elastic–plastic material problem at the crystallite or grain level by using the constitutive laws as detailed in Equation (1-2)–(3). The ferrite phase is defined with elastic and plastic properties, whereas the cementite phase is assigned elastic properties. The details about the elastic and plastic phase parameters calculated using the nanoindentation method are adopted from the literature[ 13 ] and for reference are provided in Table 3. Several fitting parameters such as n and w need calibration to address the variability in the thermomechanical processing route of the material. This is done by using an already published technique[ 34 ] of material model calibration.
A robust, fast Fourier transform (FFT)-based spectral solver is implemented in the DAMASK framework to calculate the individual material point results using coupled crystal plasticity constitutive equations. The output is recorded in the form of local stress and strain maps and global stress–strain curves. In addition, the output data are used to withdraw valuable information for analyzing local deformation behavior due to varied microstructural attributes of second phase particles. The results and discussion sections contain details about the valuable insights obtained from this study.
3 Results
In the current research work, the microstructure of three differently thermomechanically treated microstructural attributes, and the resulting global and local deformation behavior was critically analyzed to see the effect of the process route under tensile loading conditions.
The spectralOut files are generated for every simulation case, containing point-based output information for post-processing of the results (for details, refer https://damask.mpie.de/bin/view/Documentation). Localized stress and strain maps, line, point, and grain-based data for various global strain values, i.e., 5%, 15%, and 25% in this case, are visualized here. An important step forward reported in this article is the overlay of the grain boundaries for all the RVEs with local stress and strain distribution maps. This representation of results for the ferrite grains is beneficial for relating the crystallographic orientation effect with heterogeneity.
3.1 Hot-Rolled (HR) State
This material state is industrially produced C45EC by hot rolling and analyzed as-received (HR). Due to 0.45% carbon in chemical composition and thermomechanical processing of the material, a microstructure with an overall irregular periphery of ferrite grains is obtained, shown in Figure 3a as an IPF map. It is observed that, generally, the material is based on a ferrite matrix in which cementite particles are embedded. Ferrite grains are of 8.85 μm average equivalent diameter, and cementite particles are of 1.17 μm average equivalent diameter. Due to a specific processing route, the distribution of cementite particles in nonhomogeneous spaces with a clustered appearance in some areas is highlighted with boxes in Figure 3a. In Figure 3a 1, note that the cementite particles are present within the ferrite grains with a slight concentration on the grain boundaries.
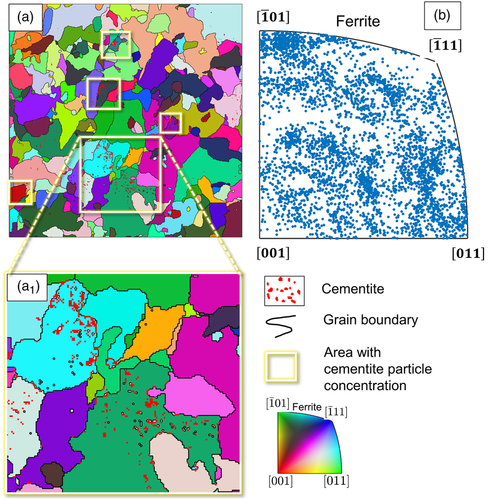
The orientation information of the microstructure helps in understanding how it affects the local deformation behavior at a particular material point. As reported in the literature, the triple points are essential to note where the damage would initiate due to localized stress and strain.[ 15 ] It is shown in Figure 3b that the orientation distribution of the RVE is relatively homogeneous, with a slight concentration on the plane. Initial isotropy does not imply that the material remains isotropic during deformation. The anisotropy condition in RVE simulations is necessary because it ensures the material behavior to be a true representative of the overall material.
Another key attribute to consider is the grain size and aspect ratio data for each phase. For HR state, this data is shown in Figure 4 . It is observed that the aspect ratio of ferrite grains majorly lies between 1 and 3. The ferrite grains (90%) are smaller than 20 μm sphere diameter, with few grains large than 25 μm equivalent diameter. Due to the very small cementite particle size and relatively large step size, the aspect ratio of the recorded cementite grains is around 1.5. Most cementite particles have an equivalent diameter between 0.5 and 1 μm which is relatively small compared with the ferrite grain diameter.
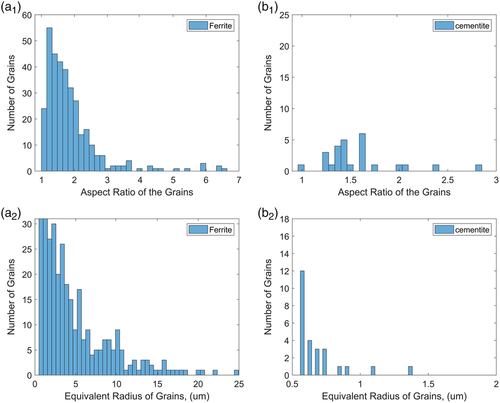
Most of the cementite particles recorded in the EBSD data are close to the step size of the electron beam and, therefore, are square, comprising a few pixels. It is also important to note that the data shown in Figure 4 and Figure 5 are from the middle of the sample, and it might slightly change in different areas. The microstructural attributes presented here help understand how the material behaves when loaded experimentally or in a numerical simulation model.
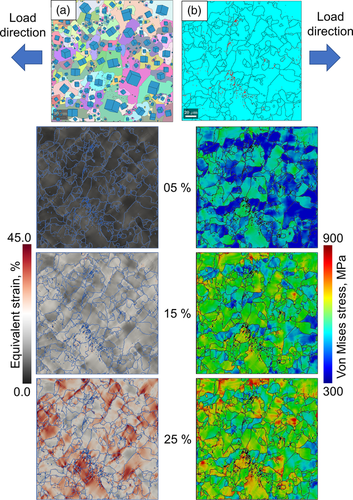
The grain orientation and the presence of the second phase particles have a critical significance in deciding the micromechanical behavior of polycrystalline materials. The IPF map shown in Figure 5a has an over-laid crystal orientation represented by 3D cubes representing the relative rotation of each grain in the 3D space. It can be observed clearly that the grains’ random orientations suggest an interesting outcome upon deformation due to tensile loading. The distribution of the cementite particles in the RVE is quite heterogeneous and not evenly distributed in the whole RVE. Several ferrite grains are free from the cementite particles, as shown in Figure 5b; however, they can be seen to have accumulated higher local strains even at 5% of the global strain. Figure 5 shows local stress and strain evolution in the RVE as the material is subjected to tensile load in the mentioned direction. The local stress and strain maps show an overall heterogeneous behavior during evolution.
The stress maps are shown in Figure 5(right) for only ferrite grains because the magnitude of the stress shown by the hard cementite particles is ignored to very high values. The average local stress in ferrite grain is around 600 MPa even at 25% of global strain, while the stress in cementite particles surpasses 5 GPa. A general contrast in the stress map can be observed as the global strain evolves from 5% to 25%. It is observed that the stresses start to grow in the small ferrite grains and continue to grow as compared with the large grains as the global strain evolve. It can be observed that the stress concentration is more in the grains, which are at approximately 40–50° disoriented as compared with the neighboring grains, and the sharp difference is distinguished at the interface. Stresses in the grains majorly evolve in a similar trend starting from 5% to 25% of the global strain. Interestingly, grains show stress concentration at the ferrite–ferrite interface, and the rest of the grains are at average stress. It has been observed that the stress concentration is primarily controlled by the crystallographic orientation, which is distinguished by the grain boundary at various positions in the RVE.
As received (HR), local strain distribution maps have been shown in Figure 5(left) in the evolution of global strain for 5%, 15%, and 25%. Although the local strains are distributed heterogeneously, they are majorly controlled by the difference in crystallographic orientations distinguished by grain boundaries. The strains are observed in bands at an angle of 45° to the line of application of tensile load. Strains notably originate from the interface and evolve in narrow paths along with the ferrite–ferrite interface. Large ferrite grains with no cementite grains embedded in them are seen to undergo a large strain. The strain concentration gets intense at the areas where cementite particles are distributed with the grain in close proximity, and the grain is ≈45° disoriented from the surrounding grains.
The close-up of locally evolved stress and strain is shown in Figure 6 . The marked and magnified zone 1 shows the stress and strain distribution in the close vicinity of cementite particles clustered together inside ferrite grains. It is observed that the finely distributed cementite particles hinder the large deformations and cause localized high-stress zones.
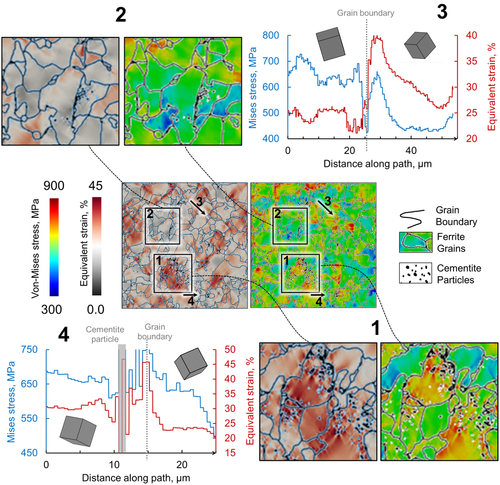
These areas with high stress and high strain zones are critical in defining the load-bearing capacity of a particular material. In contrast, zone 2 has been magnified and shown with slight clustering of cementite particles on a grain boundary. Due to these particles’ presence on the grain boundaries, they reduce the local strain evolution without causing any high-stress localization.
Stress and strain along the line 3 and 4 have been plotted to quantitatively compare the effect of grain orientation and cementite particle presence. While comparing the two line graphs of stress and strain distributions, the trends change abruptly at the grain boundaries. This is because a high shear occurs due to a cementite cluster as the model is sensitive to the defined orientation of a solution point. As a result, a sharp change in the stress and strain behavior across the grain boundaries is observed.
3.2 Hot-Rolled, Cold-Rolled, Spheroidized (HR-CR-S) State
For this state, the bulk material was hot-rolled, followed by cold rolling. Finally, the samples were spheroidization annealed to manufacture material with slightly higher strength with elongated grain in one direction. This suggests the overall dominance of the anisotropic behavior of the properties.
The material recrystallizes after heat treatment, but the grains are elongated in the rolling direction due to cold rolling passes, as shown in Figure 7 . The IPF map is highlighted to show high cementite particle concentration zones. The phase map of the material in Figure 7b shows the clustering of cementite particles on the grain boundaries with some areas with uniform cementite particle distribution and other areas with concentrated cementite particle distribution on the grain boundaries. The ferrite grains orientation distribution map shown in Figure 7c highlights the point that the grains are biased toward and orientations directions.
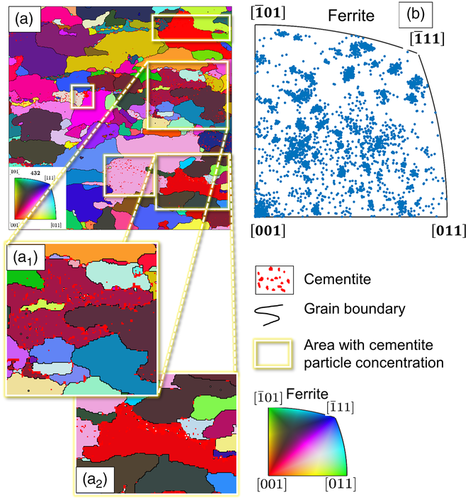
Analyzing each phase's statistical grain size distribution in Figure 8 , it is observed that the aspect ratio of the majority of the ferrite grains lies between one and two. In contrast, the ferrite matrix consists of multipolar grain size distribution, with most of the grains lying between 1 and 3 μm. A few grains are between 10 and 15 μm, and a few are even bigger than 20 μm. This uneven grain size distribution is probably due to the material processing route adopted to manufacture this material. It is also observed that there is a considerable variation in the grain size distribution of the ferrite phase.
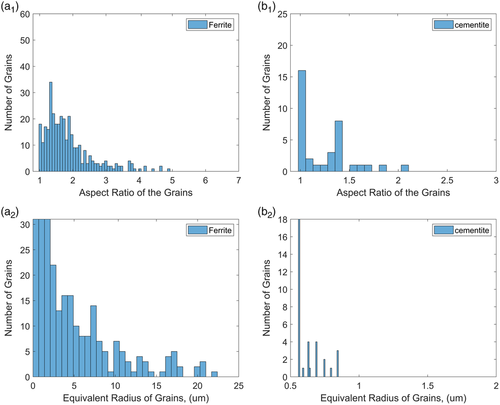
The cementite particles have a very small size between 0.5 and 1 μm, with most aspect ratios close to 1 and 1.5. These small cementite particles are seen clustered together on the grain boundaries, which pin the grain boundary slip during plastic deformation but are highly susceptible sites for void nucleation and consequent damage propagation in high deformation regimes.
The evolution of local stress and strain after the application of uniaxial tensile load on the geometry with elongated grains biased towards two contrasting and directions is shown in Figure 9 . Discontinuous strain evolution is observed as the high degree of cementite particle clustering (in the form of bands) on the grain boundaries restricts deformation flow throughout the matrix.
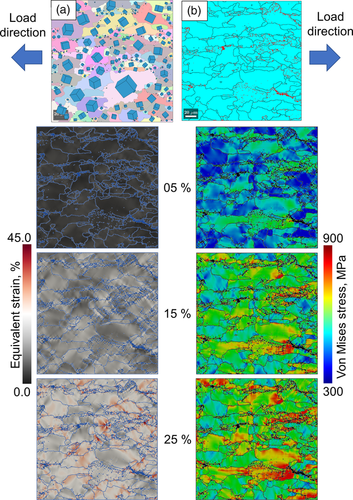
A high-stress contrast is observed even at 5% of global strain due to grains not aligned in the most favorable direction for plastic deformation. In this case, the high-stress zones are mostly the least deformed areas saturated with cementite clustering. For a detailed insight, the thorough analysis of the local stress and strain behavior at 25% of global strain is shown in Figure 10 .
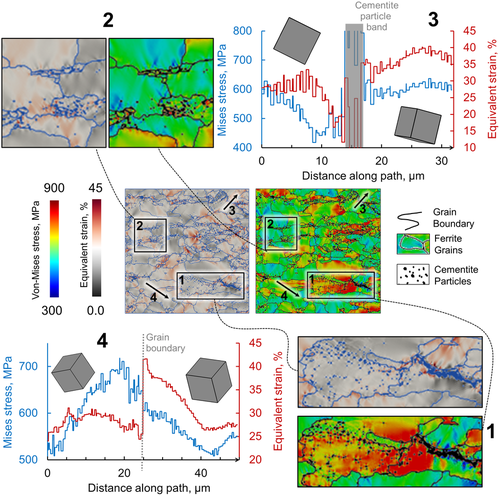
It is not only the cementite particle clustering or banding that dictates local stress and strain evolution. Instead, it is the combination of grain orientation and neighboring media which plays the critical role. For example, in Figure 10 comparing zone 1 and zone 2, comparable strain distribution in the ferrite matrix, very high-stress contrast is observed in zone 1 specifically around cementite clusters within the same grain.
On line 3, stress and strain have been plotted across a cementite particle band positioned on a grain boundary. The strain is lower and stress higher in the ferrite matrix close to the cementite particle band regardless of the grain orientation. The trend on line 4 shows a smooth transition of stress across the grain boundaries with a sharp variation of strain distribution in the absence of the cementite particle clusters.
3.3 Hot-Rolled, Spheroidized, Cold-Rolled, Spheroidized (HR-S-CR-S) State
The material was spheroidized after hot rolling. Then, cold-rolled to the desired caliber. It was spheroidized again to manufacture a material with a relatively homogeneous microstructure and even distribution of globular cementite particles in the ferrite matrix. The IPF map of material microstructure is shown in Figure 11a. It is observed that the ferrite grains are of relatively even grain size, and the cementite particles are evenly distributed within the matrix. A close-up of a highlighted area in Figure 11a 1 shows that the spherical shape cementite particles are present on the grain boundaries and within the ferrite grains. The orientation distribution map in Figure 11c shows that the grain orientation is relatively homogeneous with even distribution in all planes. The readers might observe the 45° rotation of the RVE regarding the loading direction. This was done intentionally to run simulations with comparable output as per other RVEs.
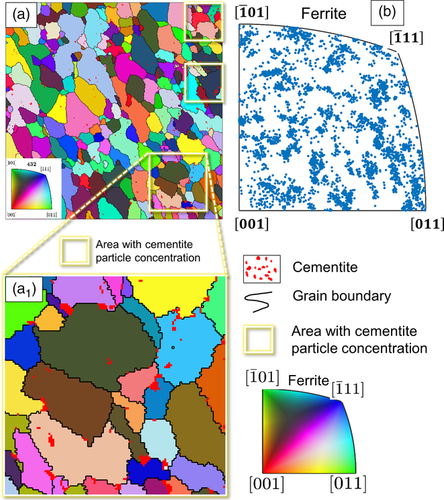
The statistical distribution of grain size and aspect ratio of both phases is shown in Figure 12 . It is observed that due to the spheroidization annealing process after hot rolling and after cold rolling, the ferrite grains have a relatively similar aspect ratio, majorly lying between 1 and 2 with the equivalent radius of grain below 10 μm. There are very few grains bigger than 10 μm. The aspect ratio of cemented particles majorly lies between 1 and 2, with particle equivalent radius averaging at 1 μm.
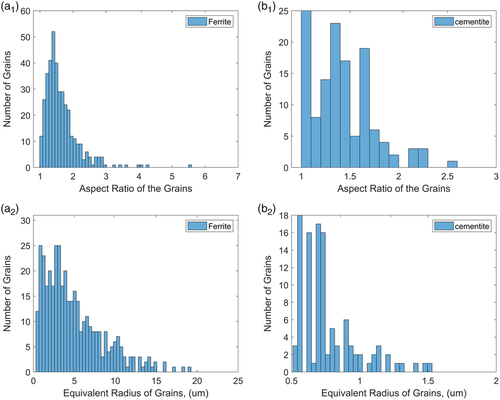
It is expected that the homogeneous distribution of relatively larger cementite particles slightly elongated in the rolling direction within the relatively finer ferrite grains would result in relatively homogeneous stress and strain distributions within the matrix during deformation.
The grain orientation and second phase particles critically affect the micromechanical behavior of polycrystalline, multiphase materials. In Figure 13a,b, it is observed that the distribution of the cementite particles in the nearly equal-sized ferrite grains is quite homogeneous. Therefore, the overlaid crystal shapes over each grain according to the IPF representation in Figure 13a will be pretty helpful in understanding the local stress and strain evolution. For this RVE specifically, the local stress and strain maps show an overall homogeneous behavior during evolution compared with previously presented cases.
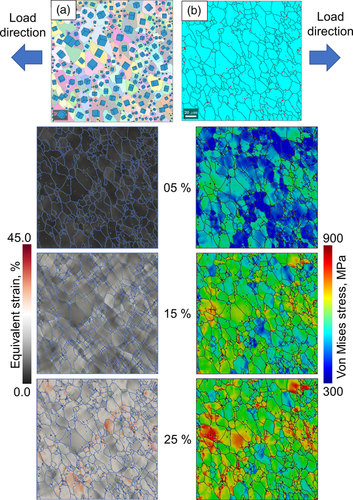
The stress maps shown in Figure 13(right) are only representing stress in ferrite grains. A general contrast in the stress map can be observed as the global strain evolves from 5% to 25%. It is observed that the stresses start to grow in the small ferrite grains, usually on the triple points, and continue to grow as the global strain evolves. It can be observed that the stress concentration is more in the grains, which are at approximately 40–50° disoriented as compared with the neighboring grains, and the sharp difference is distinguished at the interface. The stress concentration is controlled mainly by the crystallographic orientation distinguished by the grain boundary at various positions in the RVE.
The evolution of strain distribution is shown in Figure 13(left). Relatively homogeneous distribution of local strain is observed throughout the matrix with slight localization at high global strains of 25%. This homogeneous distribution of the strain is due to the evenly orientation distribution function (ODF), as shown in Figure 11c. The strain concentration gets intense around the areas where cementite particles are present, and the grain is at ≈45° disoriented from the surrounding grains.
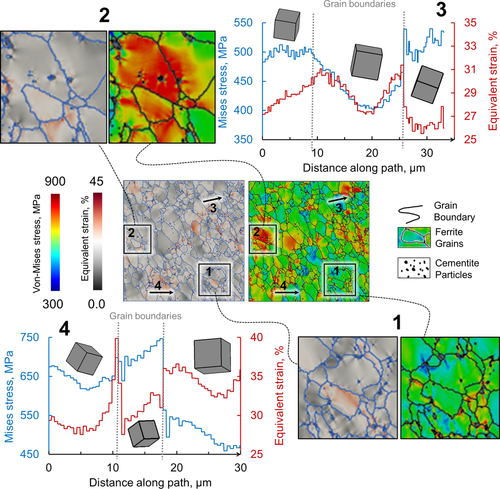
The quantitative analysis of the local stress and strain at 25% global strain is shown in Figure 14 . While comparing the local distributions in zone 1 and 2, it is observed that regardless of the similar cementite particle presence in these areas, the strain distribution is relatively homogenous, whereas significant stress variations are observed. To quantify this observation, line maps of stress and strain on 3 and 4 are shown in Figure 14. These plots verified that the stress and strain partitioning within a specific grain is dependent mainly on the crystal orientation.
4 Discussion
It is observed in the HR case that the ferrite grains noticeably vary in size, and the cementite particles are clustered at certain locations. The clustered precipitate act as potential zones for enhanced local strains;[ 9, 13, 34 ] therefore, this material form shows lower local stress and high local strain. It would probably start damaging earlier, as a combination of large ferrite grains and clustered cementite particles have been shown in the literature to negatively affect the material strength and ductility.[ 8, 14, 35 ] On the contrary, the small-sized dispersed cementite particles within the ductile ferrite grains have been reported to improve the overall material formability.[ 13, 35 ]
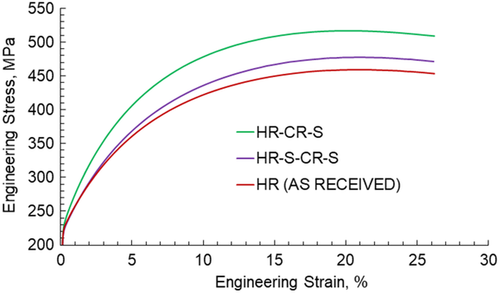
In the HR-CR-S case, the hot rolling helps break down the large ferrite and cementite grains due to recrystallization. The cold rolling pass yields ferrite grains elongated in the rolling direction, and the cementite particles cluster up on the grain boundaries in the form of bands.[ 36 ] The spheroidization treatment after the cold rolling pass does not drastically help with the distribution of cementite particles within the ferrite matrix. It helps refine them for better formability.[ 17 ] When the load is applied along the rolling direction, it is observed that the higher strain hardening occurs with very high strain localization along with the cementite cluster bands. This results in an anisotropic material behavior with higher yield strength in the rolling direction. Moreover, the thermomechanical process of spheroidization annealing after cold rolling results in refinement of the cementite particles, consequently increasing the strength as visible in Figure 15 and the literature.[ 8 ]
The hot rolling and spheroidization procedure on the as-received material does help in breaking down the cementite particles. Meanwhile, it also aligns the ferrite grains in the rolling direction, which is evident in the presented EBSD and aspect ratio data in Figure 7a and 8a 2—loading this microstructure in the rolling direction yields very high local stress and strain distribution in the neighborhood of clustered cementite particles. The cementite particles visible in bands usually present within the grain boundaries are responsible for high stresses and strains during loading. According to already reported behavior, this high concentration makes these local artifacts and fragile areas prone to failure.[ 37, 38 ]
In the HR-S-CR-S case, the material is ho-rolled, spheroidized, cold-rolled, and then again spheroidized. This sequence yields a material with evenly distributed cementite particles within the ferrite matrix comprising identically sized grains.[ 39 ] When loaded in uniaxial tension, the cementite particles do not act as stress and strain concentration sites. Therefore, dislocations have more paths to flow around these hard precipitates present within a grain body. This results in a pretty homogeneous distribution of strain in the RVE with slight stress localization due to the crystallographic orientation. This behavior results in relatively good strength and ductility.
To present a complete picture, apart from significant evident advantages of the numerical simulation model, it is essential to mention its limitations. Some of the major ones are: 1) The absence of the grain boundary and particle/matrix interface dynamics does not care for these high strain localization and damage-prone sites. 2) In the absence of the damage model and stiffness degradation criteria, the simulation continues to calculate the corresponding stress for the applied global strain. Therefore, all the results are compared for 25% global strain. 3) It has been reported earlier[ 40 ] that the local stress and strain in 2D RVEs are distributed more heterogeneously in close vicinity when compared with similar distribution in 3D RVEs under comparable loading conditions. 4) EBSD data for each material is assumed to be representative, but as it is heterogeneous and collected from only one point, it might not accurately represent the bulk material behavior.
Despite all the limitations mentioned earlier, the trends and qualitative results of the study are in good agreement with previous observations.[ 39 ] However, the quantitative responses might be different, and therefore it is needed to run more simulations and compare results by in situ test results for quantitative validation.[ 15 ]
Apart from these local stress and strain distribution trends, the global trends (refer to Figure 15) are comparable with the already published experimental data from the same materials.[ 6, 13 ] Global results of the material show a trend as expected due to the heat-treatment process conducted for each state. The as-received state has the lowest and the HR-CR-S state has the highest strain hardening, respectively. The HR-S-CR-S state shows the medium strain hardening with the same amount of global strain compared with the other two states. The reduced strain hardening in the last case has the potential of extended elongation limits, which is better for smooth plastic flow under cold forging processes.[ 36, 41, 42 ]
Comparing local stress and strain distribution plots at a specific global strain provides a better picture of the overall states and trends. The probability and cumulative distribution functions of local stress and strain in each case's ferrite and cementite phases are shown in Figure 16 . Such plots would help understand the dependence of local microstructural attributes of the material on mechanical behavior in a larger context. In Figure 16a, a bimodal distribution of stresses in the ferrite matrix is observed in the case of as-received and HR-CR-S state. In Figure 16b, the strain in the ferrite phase is highest in HR-CR-S and lowest in the HR-S-CR-S state.
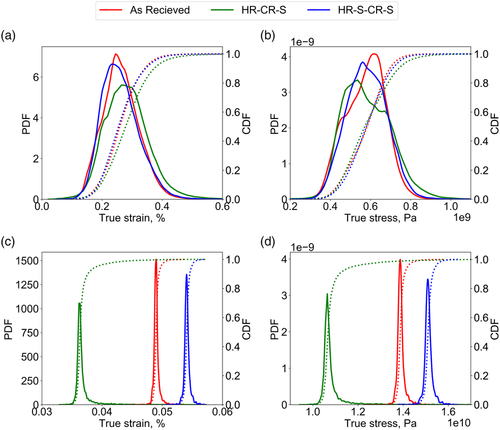
Figure 16c,d shows that the cementite particles in the HR-S-CR-S case undergo maximum stresses and strains and, by bearing more load, relieve the ferrite matrix of high stress and strain concentration zones. However, in the HR-CR-S case, the cementite particles undergo the least stress and strain, resulting in the high stress and strain within the ferrite matrix. It is quite interesting to note here that the stresses taken by the cementite particles change due to dependence on multiple microstructural attributes. The thermomechanical treatment processes play a vital role in this distribution based on resultant size modification.
In the previously published work, the RVEs were virtually constructed to provide a relatively generalized overview of the cementite particle size and distribution on the local deformation behavior.[ 13 ] It is interesting to note that although the observed trends are the same, the consideration of actual material microstructure yields better insight into the deformation trends. The micromechanical modeling and simulation technique is a subset of the integrated computational material engineering (ICME) approach on a broad spectrum. It can provide new avenues in the process of design and manufacturing of new material and improve the existing ones. The eternal goal of this approach is the optimal use of time, energy, and human resource for collecting valid information for producing application-dependent materials.[ 21, 43, 44 ] The current study provides interesting results and can be extended to fill the already mentioned shortcomings by constructing 3D RVEs and incorporating damage in the model which are addressed elsewhere,[ 12, 14 ] and the readers are encouraged to refer to those published articles for more details. Machine learning can optimize the microstructural attributes, i.e., the grain size and precipitate distribution within the matrix.
5 Conclusion
The study can be concluded as follows: 1) The EBSD data were successfully processed and converted into a DAMASK readable format using the presented methodology. The use of MTex helps in the analysis of the microstructural data in a meaningful way. Appendix A has the codes which can be used for EBSD data cleaning. This methodology under the ICME approach can draw useful results using software techniques for data analysis and numerical simulations. 2) The effect of cementite particle clustering is observed on the overall deformation behavior of the differently spheroidized states, especially the influence on the ferrite grains. It is observed that cementite clustered within the grain causes the grains to develop higher local stresses. The local stresses give rise to the local strains, and the combination can act as a potential crack nucleation site. 3) The effect of crystallographic orientations of the ferrite grains on the local and global deformation behavior is analyzed. The presented line maps with overlaid crystallographic orientations give a very comprehensive outcome. The local stress and strain behavior change as soon as the maximum change in the orientation is observed across the grain boundary. A change in crystallographic orientation in the range of 40–50° is considered maximum in the cubic crystal structure. 4) The global stress–strain curves show the difference in mechanical response according to the thermomechanical treatment applied. A carefully designed spheroidization process can provide a better combination of strength and elongation, as currently in the case of HR-S-CR-S state. 5) The cementite particles in the HR-S-CR-S state bear 26% and 6% more stress than the HR-CR-S and as-received states, respectively. Similarly, the cementite particles in the HR-S-CR-S state bear 33% and 11% more strain than the HR-CR-S and as-received states, respectively.
Therefore instead of continuously subjecting carbon steels to spheroidization treatments, it is better to carefully design the thermal treatment sequence to make the material bear more local stresses and strains during cold forming. Evenly distributed cementite globules in the bulk material are better than the heterogeneously distributed same amount of cementile globules or plates at few places.
Acknowledgements
DAAD Faculty Development for Candidates (Balochistan), 2016 (57245990)-HRDI-UESTP's/UET's funding scheme with Higher Education Commission of Pakistan (HEC) is acknowledged. DAAD-Program “Ostpartnerschaften” as well as competitive authorities at Faculty of Metals Engineering and Industrial Computer Science, AGH Krakow are acknowledged for their financial and technical support to collect some part of experimental data. Freunde und Förderer der TU Bergakademie Freiberg e.V. is acknowledged for providing financial assistance to Mr. Muhammad Umar. Finally, the competent authorities at KFUEIT, Rahim Yar Khan, Pakistan, and IMF TU BAF Germany are greatly acknowledged for providing research exchange opportunity to Mr. Muhammad Umar for running simulations, postprocessing of the results, and writing of this article.
Open access funding enabled and organized by Projekt DEAL.
Conflict of Interest
The authors declare no conflict of interest.
Appendix A
There are two methods used for filling and denoising the recorded EBSD data. The first being with the use of a filter provided in the MTex toolbox named as filling filter and second with “halfQuadraticFilter.” The code can be used by takeing the EBSD data file (.ang) with any post-2015 version of MATLAB.
| filling filter | HalfQuadraticFilter |
|---|---|
run F:\Softwares\mtex-5.2.8\mtex-5.2.8\startup_mtex.m % import the data % The following uigetfile and 'if’ condition will assist in importing the required file containing EBSD data [file,path] = uigetfile(); if isequal(file,0) disp('User selected Cancel'); else disp(['User selected ', fullfile(path,file)]); end % following command will load the data in the imported file and will save in workplace variables filename = [path file]; ebsd = EBSD.load(fileName) % consider only indexed data ebsd = ebsd('indexed'); % reconstruct the grain structure [grains,ebsd.grainId,ebsd.mis2mean] = calcGrains(ebsd,'angle',10*degree); % remove some very small grains ebsd(grains(grains.grainSize<5)) = []; % redo grain segementation [grains,ebsd.grainId] = calcGrains(ebsd,'angle',10*degree); % smooth grain boundaries grains = smooth(grains,5); % plot the orientation map figure(1) plot(ebsd('iron (alpha)'),ebsd('iron (alpha)').orientations) % and on top the grain boundaries hold on plot(grains.boundary,'linewidth',1.5) hold off ebsd_filled = fill(ebsd,grains); figure(2) plot(ebsd_filled('iron (alpha)'),ebsd_filled('iron alpha)').orientations); % hold on % plot(grainsSub.boundary,'linewidth',1.5) % hold off |
% This command is run to call the MTex library in the MATLAB run F:\Softwares\mtex-5.2.8\mtex-5.2.8\startup_mtex.m % import the data %The following uigetfile and 'if’ condition will assist in importing the required file %containing EBSD data [file,path] = uigetfile(); if isequal(file,0) disp('User selected Cancel'); else disp(['User selected ', fullfile(path,file)]); end % folloeing command will load the data in the imported file and will save in % workplace variables filename = [path file]; ebsd = EBSD.load(fileName) %% % consider only indexed data %ebsd = ebsd('indexed'); % reconstruct the grain structure [grains,ebsd.grainId,ebsd.mis2mean] = calcGrains(ebsd,'angle',10*degree); % remove some very small grains ebsd(grains(grains.grainSize<5)) = []; % redo grain segementation [grains,ebsd.grainId] = calcGrains(ebsd,'angle',10*degree); % smooth grain boundaries grains = smooth(grains,5); % plot the orientation map figure(1) plot(ebsd('iron (alpha)'),ebsd('iron (alpha)').orientations) % and on top the grain boundaries hold on plot(grains.boundary,'linewidth',1.5) hold off %% F = halfQuadraticFilter; F.alpha = 0.25; % interpolate the missing data ebsd_filled = smooth(ebsd,F,'fill',grains); ebsd_filled = ebsd_filled('iron (alpha)'); figure(2) plot(ebsd_filled('iron (alpha)'),ebsd_filled('iron (alpha)').orientations); |
Open Research
Research data are not shared.


