Analysis of Metal–Organic Framework and Polyamide Interfaces in Membranes for Water Treatment and Antibacterial Applications
Abstract
Integrating biocidal nanoparticles (NPs) into polyamide (PA) membranes shows promise for enhancing resistance to biofouling. Incorporating techniques can tailor thin-film nanocomposite (TFN) membranes for specific water purification applications. In this study, silver-based metal–organic framework Ag-MOFs (using silver nitrate and 1,3,5-benzentricarboxylic acid as precursors) are incorporated into PA membranes via three different methods: i) incorporation, ii) dip-coating, and iii) in situ ultrasonic techniques. The characterizations, such as top-surface and cross-section scanning and transmission microscopy, reveal that the incorporation methods for the modified TFN membranes substantially control morphology and surface characteristics. For example, the in situ ultrasonically interlayered Ag-MOFs showed the largest pores (average pore diameter of 14 Å ± 0.1), resulting in the highest water permeance (water flux of 10.9 LMH/bar for Na2SO4). It also show superior antifouling and anti-biofouling performance, with a flux recovery ratio (FRR) of 94.1% in both fouling tests due to its improved surface hydrophilicity and the antibacterial properties of incorporated Ag-MOFs. Conversely, the surface-grafted dip-coated Ag-MOFs offered the highest salt rejection, attributed to its highly negatively charged surface and a dense PA network with narrow pores (average pore diameter of 10 Å ± 0.06).
1 Introduction
Water pollution has been an environmental challenge, posing major threats to ecosystems and human health.[1] According to the World Health Organization (WHO), poor drinking water quality and non-compliance with sanitation standards for water supply contribute to 80% of all diseases and 50% of child deaths worldwide, highlighting the crucial need for effective wastewater treatment.[2] Ion exchange,[3] adsorption,[4] coagulation/flocculation,[5] and membrane separations[6] are the most ubiquitous wastewater treatment technologies. Membrane separations are widely employed in wastewater treatment and drinking water supply due to their versatility, lower energy needs, minimal chemical usage, small footprint, and ability to produce high-quality water.[7]
Membranes can be categorized by their pore size, with reverse osmosis (RO) membranes having the smallest pores, and nanofiltration (NF) membranes having slightly larger pores, which allows partial salt passage.[8] Polyamide (PA) is the most common active layer material for RO and NF membranes due to its facile fabrication procedure, scalability, high selectivity, and tunable chemistry.[9] However, fouling caused by organic and biological entities in the wastewater poses a major challenge for PA membranes.[10] Microorganisms in wastewater adhere to membrane surfaces, colonize, and form biofilms, leading to biofouling.[11] This reduces membrane separation efficiency and increases the risk of secondary water contamination through bacterial infiltration.[12] Biofouling also decreases water flux, increases operational costs, requires more frequent chemical cleaning, and shortens membrane lifespan.[13] Hence, developing alternative surface chemistries and modifications for PA membranes is critical for mitigating biofouling.[14]
Surface modification of PA membranes can be achieved by incorporating additives during membrane fabrication[15] or altering the synthesis procedure and adjusting the reaction environment.[16] Additives may include nanomaterials, surfactants, or biomolecules.[17] Among these, nanomaterials exhibit a wide range of beneficial properties, and their integration into the PA layer leads to the formation of thin-film nanocomposite (TFN) membranes.[18] These TFN membranes can potentially mitigate biofouling by immobilizing nanoparticles (NPs) with strong biocidal properties,[19] such as metals (e.g., Ag and Cu),[20] MXenes,[21] and graphene oxide (GO),[22] within the membrane structure. However, challenges like chemical incompatibility, uncontrolled NPs release, and loss of biocidal properties over time remain significant obstacles.[23]
Metal–organic frameworks (MOFs) present an attractive option for TFN membranes due to their unique properties, including high surface area, biocidal activity, controlled release of metal ions, uniform distribution of active metal sites, and compatibility with the organic components of the selective layer of TFN membranes.[24] Figure S1 (Supporting Information) highlights the increasing research interest in MOF-modified membranes, showing that since 2002, 45 922 articles have been published on MOFs, with 2802 focusing on MOFs and membranes. However, integrating MOFs into PA membranes poses several challenges such as size limitation and precise positioning within the membrane, which are crucial factors for maximizing their antibacterial properties.[25] Another issue is the agglomeration of nanoparticles, which can result in uneven distribution of MOFs, reducing surface area, and potentially causing physical defects that compromise separation performance. Effective integration of MOFs into PA membranes requires strong chemical interactions, such as electrostatic forces and coordination bonds between metal sites in MOFs and the functional groups (carboxylic and amine groups) involved in interfacial polymerization (IP) reaction. The robustness of these interactions directly influences the release rate and homogeneity of the dispersed nanoparticles within the PA structure.[26] Therefore, a novel experimental design that optimally integrates MOFs into the PA structure could improve the dispersion and stability of Ag-MOFs within the PA network.
Dip-coating and incorporation are the most common methods for integrating MOFs into PA structures.[27] The incorporation technique involves fabricating a modified PA layer by dispersing MOFs in the aqueous solution used in the IP reaction. Although these are cost-effective and straightforward techniques, they provide limited control over the incorporation parameters discussed earlier.[19] Ultrasonication, however, offers a more precise and effective method for MOF integration. By generating microbubbles in the solvent, which eventually will implode, ultrasonication creates localized hot spots with temperatures reaching up to 4726 °C.[28] This intense energy release facilitates the crystallization of MOFs[29] and produces radicals (OH•, H•) capable of modifying the PA membrane surface by introducing additional carboxylic functional groups.[30] Furthermore, ultrasonication enables better control over the crystal size of MOFs, offering an efficient way to tune the structure of TFN membranes.[31]
Our previous work revealed that ultrasonication significantly improves nanoparticle size control and uniform distribution when employed for Ag-MOF integration into the surface of polydopamine (PDA) microfiltration membranes.[32] Building on these findings, this study employed the ultrasonication technique for the in situ synthesis and integration of Ag-MOFs within the PA structure. Our primary objective is to provide insights into how ultrasonication affects TFN membranes surface characteristics and filtration performance. To further understand the effect of different incorporation techniques on the surface and structural properties, we also explored dip-coating and incorporation techniques for Ag-MOF integration into PA membranes. The selectivity, antifouling, and anti-biofouling performance of pristine PA and modified TFN membranes were evaluated in a crossflow NF system by using various salts, sodium alginate, and Escherichia coli (E. Coli).
2 Experimental Section
2.1 Chemicals
Silver nitrate (AgNO3 >99%), 1,3,5-benzentricarboxylic acid (BTC >99%), and ethanol (>99%) were purchased from Sigma–Aldrich and used for the synthesis of Ag-MOFs. Piperazine (PIP) anhydrous, trimesoyl chloride (TMC, >98%), triethylamine (TEA), and n-hexane (>95%) were also purchased from Sigma–Aldrich for synthesizing the PA selective layer. A commercial polyethersulfone (PES) microfiltration membrane (Durapore Membrane Filter, MilliporeSigma Inc.) with a nominal pore size of 0.22 µm and an average thickness of 110 µm was used as the substrate for fabricating of PA and TFN membranes. Sodium sulfate (Na2SO4, 99.5%), sodium chloride (NaCl, >99.5%), calcium chloride (CaCl2, 96%), magnesium sulfate (MgSO4·6H2O, 99%), sodium alginate (NaC6H7O6), and polyethylene glycol (PEG) with different molecular weights (200, 300, 400, 600, and 1000 Da) were also procured from Sigma–Aldrich for the preparation of feed solutions in filtration tests. Polypropylene glycol (PPG, 500 Da), trifluoroacetic acid (TFA, >99.7%), and α-Cyano-4-hydroxycinnamic acid (CCA, 99%) were purchased from Sigma–Aldrich. Trypticase soy broth (TSB), agar, phosphate buffer saline (PBS), and Escherichia coli (E. coli, ATCC 35695) were used in antibacterial and dynamic biofouling tests as a gram-negative model bacterium. Additionally, 2,5-dihydroxybenzoic acid (DHB >99%) and phosphorus red (>97%) were purchased from Sigma–Aldrich.
2.2 Synthesis of Ag-MOF Nanoparticles
AgNO3 and BTC were used as precursors to synthesize Ag-MOFs via ultrasonication. Operational parameters such as temperature (0, 25, 50, and 75 °C), reaction time (15, 45, and 75 min), and precursor concentrations (mM) were optimized to achieve smaller particles with relatively uniform size distributions while maximizing crystallization yield. The effect of the precursor concentrations on MOF synthesis was investigated using three different concentration levels: i) 7.36 mM AgNO3 with 5.94 mM BTC, ii) 73.6 mM AgNO3 with 59.4 mM BTC, and iii) 147.2 mM AgNO3 with 118.9 mM BTC. For this purpose, the required amounts of AgNO3 and BTC were dissolved in 120 mL of DI water and ethanol, respectively, to prepare precursor solutions with the mentioned concentrations. The solutions were vortexed for 20 min before being poured into a 200 mL glass beaker placed in an oil bath, which regulated the reaction temperature and was monitored using a thermometer. Ultrasonication was then carried out by the probe sonicator at optimized settings: 500 watts, 20 kHz frequency kHz, 40% amplitude, and 5 s pulse pause time. Afterward, the final solution was first transferred to a 50 mL centrifuge tube. Then, the centrifugation was conducted at 4226 rcf for 5 min. The supernatant was then decanted and replaced with ethanol as the rinsing solvent. The final solution was then transferred into a clean glass beaker, dried for 18 h at 40 °C, and stored under vacuum. The synthesized Ag-MOFs were used to prepare TFN membranes. The operational power settings of the probe sonicator (Q500 Sonicator, Qsonica, USA) were established based on our previous studies and optimizations of their effectiveness in MOF synthesis.[32]
2.3 Membrane Fabrication Procedure
A commercial PES microfiltration membrane was used as the support for fabricating PA and TFN membranes. The pristine PA membrane (labeled as M0) was prepared using an interfacial polymerization (IP) reaction. For this purpose, a 10 mL aqueous solution containing 2 wt.% PIP and 0.4 wt.% TEA was poured onto the surface of a mounted PES support for 2 min. Subsequently, the membrane surface was coated with a 10 mL solution of 0.1 wt.% TMC in n-hexane, allowing it to sit for 30 s to complete the IP reaction. Once the selective layer was formed, the membrane was cured in an oven at 70 °C for 10 min to finalize the polymerization reaction.
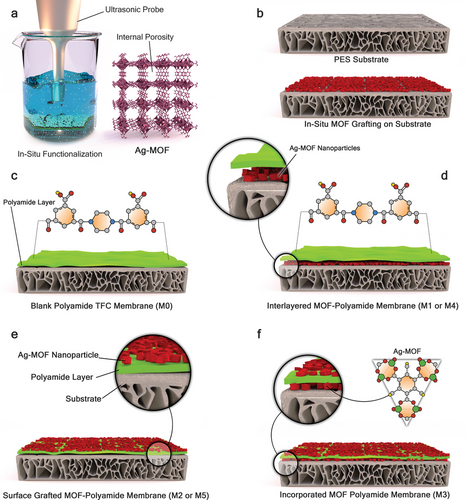
For the modified TFN membranes, three different methods, namely dip-coating, incorporation, and in situ ultrasonication, were employed to integrate Ag-MOFs into the PA membrane structure. MOFs can be incorporated into the membrane structure before IP reaction (labeled as interlayered Ag-MOFs), or after PA formation (labeled as surface-grafted Ag-MOFs). The ultrasonically interlayered Ag-MOF membrane (labeled as M1) was fabricated through in situ ultrasonication before IP. For this purpose, a PES support was mounted in a custom frame and placed at the bottom of a glass beaker (size of 1 L), with an ultrasound probe positioned at a fixed distance (≈15 mm) from the membrane surface to prevent damage. Ultrasonication was then implemented under optimal conditions for synthesizing Ag-MOF nanoparticles. Further discussions (Section 3.1) will demonstrate that a reaction temperature of 50 °C, precursor concentration of 73.6 mM (AgNO3) with 59.4 mM (BTC), and reaction time of 45 min were determined as the optimal ultrasonication conditions for Ag-MOF synthesis. Afterward, the fabricated membrane was rinsed with deionized (DI) water to remove any visible nanoparticle clusters on the membrane surface. Finally, the IP reaction was performed on the PES support. The in situ ultrasonically surface-grafted membrane (labeled as M2) was fabricated using the same procedure but with a PA membrane (M0) instead of the PES support. No additional PA layer was synthesized on the surface of the M2 membrane after ultrasonication.
As previously mentioned, nanoparticles can be incorporated into the PA layer during the IP reaction. Therefore, a nanocomposite Ag-MOF-PA membrane (M3) was fabricated by preparing a piperazine (PIP) solution containing 0.1 wt.% Ag-MOFs. The prepared Ag-MOFs were added to DI water and sonicated for 5 min before mixing with the PIP solution. The IP reaction was then implemented using the modified aqueous solution (i.e., incorporation). Additionally, the dip-coating technique was employed to incorporate Ag-MOFs into the PA membranes. A dip-coated interlayered Ag-MOF membrane (labeled as M4) was prepared by mounting a PES support membrane in a custom frame. Then, 10 mL of a 1 wt.% Ag-MOF solution, prepared from the synthesized Ag-MOFs and sonicated for 5 min, was poured onto the membrane surface and stirred for 1 h at 100 rpm. The fabricated membrane was then rinsed with DI water to remove any nanoparticle clusters on the membrane surface before the PA layer was synthesized via IP. Similarly, a dip-coated surface-grafted Ag-MOF membrane (labeled as M5) was prepared using a pristine PA membrane (M0) instead of a PES support. A schematic and detailed description of all membranes and their fabrication techniques are provided in Figure 1 and Table S1 (Supporting Information). It should be noted that all membranes used in this study were synthesized in batches of four and stored in deionized water for up to three months before being used in filtration tests, including fouling and biofouling experiments.
2.4 MOFs and Membrane Characterizations
The top surface morphology of pristine (M0) and modified membranes (M1-M5) was analyzed using scanning electron microscopy (SEM; Apreo Thermo Fisher Scientific, USA) with a 5 nm gold coating applied by a sputter coater (Leica EM ACE600, USA). The cross-section morphology was further investigated using transmission electron microscopy (TEM; FEI Tecnai F-20, USA). The elemental composition of the selective layer was determined through energy-dispersive X-ray analysis (EDX) using SEM. These techniques (SEM, TEM, and EDX) were also employed to characterize the synthesized Ag-MOFs. Additionally, X-ray powder diffraction (XRD; Bruker D8, Germany) identified the crystalline patterns of Ag-MOFs. Surface chemistry and elemental compositions were determined by X-ray photoelectron spectroscopy (XPS) using a Kratos spectrometer (Axis 165 XPS/Auger, Shimadzu, Japan) equipped with a 100 mm monochromatic Al K (alpha) X-ray. Attenuated total reflection-Fourier transform infrared (ATR-FTIR; Nicolet iS50 FT, Thermo Fisher Scientific, USA) provided information about the functional groups. Atomic force microscopy (AFM; EasyScan II, Switzerland) measured the surface roughness of the membranes by determining the arithmetic average roughness (Ra) and root mean square average roughness (Rq) values. Hydrophilicity and zeta potential were determined using water contact angle measurements (Dataphysics, OCA 15 plus) and Anton Paar SurPASS electrokinetic solid surface potential analyzer (Anton Paar USA, Ashland, VA), respectively. The charge characteristics of the membranes were further investigated by implementing the ion elution method to quantify the density of carboxylic groups within the pores of the pristine PA and modified TFN membranes. Inductively coupled plasma mass spectroscopy (ICP-MS; 143 NEXION 300D, PerkinElmer) measured the ion concentrations in ion elution, ion leaching, and mixed salt filtration tests after acidifying the collected samples with 1% HNO3. Operational procedures for the characterization techniques can be found elsewhere.[33] A thermogravimetric analyzer (TA Instruments, SDT 2960) was used to measure the thermal stability of the membranes. Matrix-assisted laser desorption/ionization (MALDI) was used to measure polyethylene glycol (PEG) concentration. More detailed information about MALDI analysis is provided in Supporting Information.
2.5 Molecular Weight Cut-Off (MWCO) Measurements
2.6 Filtration, Fouling, and Biofouling Performance of Membranes
The anti-biofouling performance of the membranes was evaluated through a biofouling filtration test in a crossflow system. Initially, the system was sanitized with 50% ethanol (v/v) and rinsed multiple times with DI water. The fabricated membranes were first compacted (at 8 bar) for 15 h to obtain a stable water flux. The pure water flux of the PA membrane was measured at 6 bar and recorded as Jw0 (i.e., initial water flux). The operating pressure was adjusted for all modified membranes to obtain the same Jw0 as the PA membrane.
Next, the bacterial suspension was added to the feed tank to achieve an initial concentration of ≈106 CFU mL−1. Freshly cultivated E. Coli FAMP (a gram-negative model bacterium) was diluted in TSB to promote healthy bacterial metabolism throughout the biofouling test. A 96-h closed-loop filtration was conducted to simulate practical wastewater filtration. Water flux was measured at various time intervals and the average value was recorded as Jw1 (i.e., water flux throughout the fouling test). Samples were collected from the feed tank at different times to measure bacterial concentration using a standard colony-forming unit (CFU) test. After 96 h, the feed solution was replaced with DI water, and the membrane was cleaned at 1 bar pressure for 1 h. The pure water flux of the cleaned membrane was then measured and recorded as Jw2 (i.e., final water flux).
2.7 Antibacterial Properties Assessment of Membranes
3 Results and Discussion
In this section, the synthesis and characterization results of Ag-MOFs are presented first. Then, key performance metrics of pristine and modified PA membranes are discussed. Further characterizations are utilized to elucidate the effects of each incorporation technique on the physicochemical properties and surface characteristics of the modified membranes. The discussion further explores how these changes influence their filtration efficiency and antifouling performance.
3.1 Synthesis Optimization and Characterization of Ag-MOFs
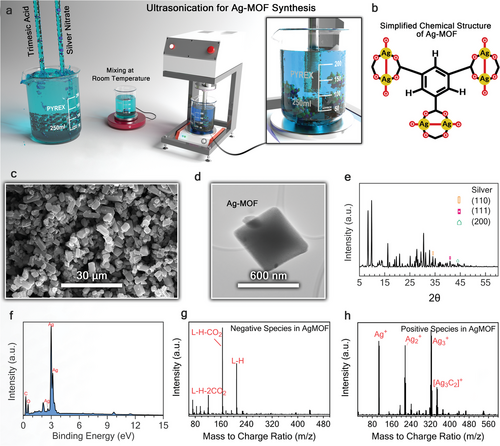
To enhance the integration of Ag-MOFs into PA membranes, we optimized the temperature, precursor concentrations, and duration of the sonication. We studied four reaction temperatures (0, 25, 50, and 75 °C) and investigated the temperature effects on the size of the synthesized Ag-MOFs. Ultrasonication experiments were conducted at a constant reaction time of 15 min and fixed precursor concentrations of 73.6 mM AgNO3 and 59.4 mM BTC (Figure 2a,b). Higher temperatures resulted in the formation of smaller Ag-MOFs (Figures S2–S5, Supporting Information). However, lower temperatures were preferred to prevent potential damage to the in situ ultrasonically modified PA membranes (M1 and M2). Therefore, 50 °C was selected as the optimal temperature for Ag-MOF synthesis.
We further investigated the influence of varying reaction times (45 and 75 min) at the optimal temperature (50 °C). SEM images (Figures S6 and S7, Supporting Information) indicated that extending the reaction time beyond 15 min resulted in smaller Ag-MOFs. However, minimal differences were observed between Ag-MOFs synthesized at 45 and 75 min, suggesting that the reaction likely reached completion by 45 min, which was thus identified as the optimal duration. Two additional precursor concentrations, i.e., 7.36 mM AgNO3 with 5.94 mM BTC and 147.2 mM AgNO3 with 118.9 mM BTC, were explored under the established optimal conditions (50 °C and 45 min). The results (Figures S6, S8, and S9, Supporting Information) revealed that a concentration of 7.36 mM was insufficient for Ag-MOFs synthesis. Higher metal precursor concentrations (73.6 and 147.2 mM) resulted in Ag-MOFs with small sizes, with a higher degree of MOF agglomeration observed for 147.2 mM compared to 73.6 mM of the metal precursor. Overall, the optimal conditions for synthesizing Ag-MOFs using ultrasonication were determined to be a reaction temperature of 50 °C, a precursor concentration of 73.6 mM (AgNO3) with 59.4 mM (BTC), and a reaction time of 45 min. These parameters were crucial for the successful in situ fabrication of PA membranes integrated with Ag-MOFs.
The structure and morphology of the optimized Ag-MOFs are illustrated in the SEM and TEM images (Figure 2c,d). As discussed earlier, the SEM image of synthesized Ag-MOFs under optimal conditions shows smaller MOFs with relatively uniform sizes, indicating effective process optimization, especially for incorporation into the PA layer. The XRD pattern (Figure 2e) shows peaks at 9.54°, 16.2°, and 30.4°, consistent with the peaks of Ag-MOFs reported previously.[39] The distinctive sharp peak at 16.2° corresponds to MOFs with a highly crystalline structure.[39] Peaks at 34.1°, 40.1°, and 44.4° correspond to the (110), (111), and (200) planes of Ag metal, respectively.[40] Additional information of all detected peaks in further provided in Table S2. EDX analysis (Figure 2f,g) can further confirm the elemental composition of the Ag-MOFs, inferred by the presence of Ag ions coordinated by organic ligands.
MALDI analysis was performed on Ag-MOFs (Figure 2g,h) to identify charged species. The positively charged species identified in the MALDI spectrum (Figure 2h), such as ([Ag]+, [Ag2]+, [Ag3]+, and [Ag3C2]+), can form coordination bonds with functional groups like carboxylic groups during the IP reaction, improving compatibility with the PA matrix. The presence of charged complexes on the surface of TFN membranes can also affect their surface charge and rejection capabilities by modifying electrostatic interactions. Specifically, the negatively charged complexes identified in Figure 2g, such as C9H6O6-H-2CO2 and C9H6O6-H, can enhance the membrane surface's negative charge, improving its ability to reject negatively charged solutes (e.g., Cl−, SO42−) through electrostatic repulsion.
3.2 Filtration, Fouling, and Biofouling Performance of Membranes
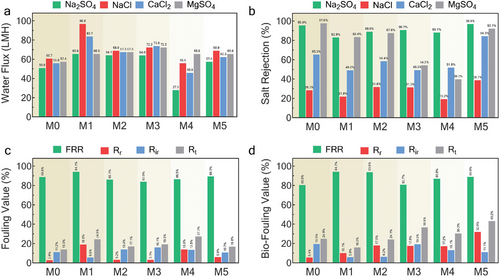
The water flux (Jw) of membranes was evaluated through filtration tests using monovalent (NaCl) and divalent salts (Na2SO4, CaCl2, and MgSO4). Figure 3a shows that the incorporation of Ag-MOFs enhanced water flux in all modified membranes except the M4 membrane. Using Na2SO4 filtration results as a benchmark, the highest water flux (65.6 LMH) was achieved by the ultrasonically interlayered Ag-MOFs (M1), with 1.6 times higher recorded flux than the pristine M0 membrane (50.9 LMH). Overall, the water flux performance of the membranes, based on the Na2SO4 filtration results, followed the sequence: M1>M2>M3>M5>M0>M4. Regarding salt rejection performance, M5 outperformed the pristine membrane in rejection for all tested salts except MgSO4 (Figure 3b). The antifouling and anti-biofouling performance of the membranes were further assessed through continuous 96-h (4-day) filtration tests. The FRR (%) performance of the fabricated membranes (Figure 3c) followed the order: M1>M5>M0>M4>M2>M3, with M1 achieving the highest FRR (94.1%) when sodium alginate was used as the fouling agent. M1 and M2 also demonstrated better anti-biofouling performance, achieving FRRs of 94.1% and 93.8%, respectively (Figure 3d). In contrast, M0 exhibited the least resistance to biofouling among all membranes, with an FRR of 80.5%. Additional fouling and biofouling results (Rr, Rir, and Rt) are provided in the Supporting Information (Table S3, Supporting Information).
3.3 Physicochemical Properties of the Membranes
We analyzed the membrane surface chemistry using various characterization techniques to elucidate the membrane separation performance. Figure S10 and Table S4 (Supporting Information) provide all detected peaks by ATR-FTIR spectroscopy and their key characteristics. Notably, the PES support and PA layer were identified by their characteristic peaks located at 1320, 1415, and 1627 cm−1, corresponding to stretching vibrations of O═S═O,[41] C─N,[42] and C═O[43] bonds, respectively. Furthermore, detailed information about the chemical bonds and elemental compositions was characterized using XPS. Ag 3d5/2 and Ag 3d3/2 signals were detected in the modified membranes (Figures S11–S14, Supporting Information), along with the characteristic signals of oxygen (O 1s), nitrogen (N 1s), and carbon (C 1s) found in the pristine PA membrane. Tables S5–S7 (Supporting Information) provide detailed information about the abundance and intensity distribution of different functional groups of C 1s, N 1s, and O 1s for the pristine PA (M0) and modified TFN membranes (M1-M5).
The elemental composition of the membrane surface was further characterized by EDX analysis of all fabricated membranes. The measured concentrations (%) of C, N, S, and O are shown in Table S8 (Supporting Information). The presence of S could be an indicator of PES support. Notably, Ag atoms were detected in the EDX spectra of all TFN membranes except M4. Considering that no Ag-containing complexes were detected in the MALDI analysis of the M4 membrane either, it can be inferred that interlayer dip-coating is not an effective technique for incorporating Ag-MOFs into PA membranes.
Charged ions and complexes, including Ag+, Ag2+, Ag3+, [Ag2Cl]+, [Ag3Cl2]+, [AgCl2]−, [Ag2Cl3]−, and [Ag3Cl4]− were detected in the MALDI spectra (Figure S15b,c, Supporting Information). Detailed information about the peak patterns, peak intensity median values, and the distribution range of each detected complex of silver in MALDI analysis is provided in Table 1 and Figure S16 (Supporting Information) (box plots). Key findings from all collected spectra include: i) no Ag-containing charged complexes were detected in M4 and M0 membranes, indicating low interactions between Ag-MOFs and PES support via dip-coating (in M4); ii) no Cl-containing complexes, positively or negatively charged, were detected in M4 membrane, suggesting ineffective interactions between residual Cl ions and Ag-MOFs after IP reaction; iii) overall, for Ag/Cl complexes M2 and M5 membranes had the highest concentrations of these species in positive and negative modes. M2 had the narrowest intensity spread for positive ions, while M5 showed a narrower intensity spread than M2 for negative ions. The narrow spread for positive ions and widespread for negative ions for M2 may indicate a more uniform distribution of Ag on the membrane surface, whereas Cl distribution, which affects negative ion intensity, is less uniform. This suggests that the concentration of Ag/Cl complexes is higher in surface-grafted membranes (M2 and M5), with Ag-MOF nanoparticles more evenly distributed across the membrane surface.
| Complex | Peak pattern [m z−1] | Membrane | Peak Intensity [a. u.] | Intensity range of detected complex [a. u.] | Figure number |
|---|---|---|---|---|---|
| Ag+ | 106.9, 108.9 | M1 | 2.5 | [0.4, 3.95] = 3.55 | S15(a) |
| M2 | 4.4 | [3.7, 5.8] = 2.1 | |||
| M3 | 4.1 | [2.2, 4.8] = 2.6 | |||
| M4 | 0.2 | [0, 0.7] = 0.7 | |||
| M5 | 5.5 | [3.9, 6.7] = 2.8 | |||
| M0 | 0 | [0, 0.2] = 0.2 | |||
| Ag2+ | 213.9, 215.9, 217.9 | M1 | 4.1 | [0.6, 5.4] = 4.8 | S15(b) |
| M2 | 5.5 | [4.1, 6.7] = 2.6 | |||
| M3 | 5.8 | [2.2, 6.9] = 4.7 | |||
| M4 | 0.3 | [0, 1.2] = 1.2 | |||
| M5 | 6.8 | [5.2, 8.6] = 3.4 | |||
| M0 | 0 | [0, 0.2] = 0.2 | |||
| [Ag2Cl]+ | 248.8, 250.8, 252.8, 254.8 | M1 | 12.2 | [0.15, 20] = 19.8 | S15(c) |
| M2 | 19.5 | [15.8, 25.8] = 10 | |||
| M3 | 0.4 | [0, 1.5] = 1.5 | |||
| M4 | 0 | [0, 2.0] = 2.0 | |||
| M5 | 22.3 | [15.7, 25.3] = 9.6 | |||
| M0 | 0 | [0, 0.5] = 0.5 | |||
| Ag3+ | 320.7, 322.7, 324.7, 326.7 | M1 | 7.5 | [1.1, 9.3] = 8.2 | S15(d) |
| M2 | 9.6 | [7.3, 11.4] = 4.1 | |||
| M3 | 6.7 | [3.1, 8.1] = 5 | |||
| M4 | 0.2 | [0, 1.2] = 1.2 | |||
| M5 | 10.4 | [7.3, 12.6] = 5.3 | |||
| M0 | 0 | [0, 2] = 2 | |||
| [Ag3C2]+ | 344.8, 346.8, 348.8, 350.8 | M1 | 0.7 | [0.1, 0.96] = 0.86 | S15(e) |
| M2 | 1.18 | [0.8, 1.45] = 0.65 | |||
| M3 | 1.46 | [0.54, 1.84] = 1.3 | |||
| M4 | 0.04 | [0, 0.1] = 0.1 | |||
| M5 | 1.5 | [0.95, 1.97] = 1.02 | |||
| M0 | 0 | 0 | |||
| [Ag3Cl2]+ | 390.7, 392.7, 394.7, 396.7 | M1 | 9.5 | [1, 15.8] = 14.8 | S15(f) |
| M2 | 14 | [12.5, 17.9] = 5.2 | |||
| M3 | 0 | [0, 0.9] = 0.9 | |||
| M4 | 0 | [0, 1.3] = 1.3 | |||
| M5 | 13.2 | [9.7, 16] = 6.3 | |||
| M0 | 0 | [0, 0.3] = 0.3 | |||
| [Ag4Cl]+ | 462.6, 464.6, 466.6, 468.6, 490.6 | M1 | 0.84 | [0.1, 1.5] = 0.5 | S15(g) |
| M2 | 1.4 | [1.08, 1.47] = 0.39 | |||
| M3 | 0 | [0, 0.9] = 0.9 | |||
| M4 | 0 | [0, 0.8] = 0.8 | |||
| M5 | 0.98 | [0.6, 1.1] = 0.51 | |||
| M0 | 0 | 0 | |||
| Ag5+ | 534.5, 536.5, 538.5, 540.5, 542.5, 544.5 | M1 | 0.99 | [0.05, 1.9] = 1.85 | S15(h) |
| M2 | 2.05 | [1.84, 2.15] = 0.29 | |||
| M3 | 0.25 | [0.08, 0.3] = 0.22 | |||
| M4 | 0 | [0, 0.1] = 0.1 | |||
| M5 | 1.29 | [0.82, 1.5] = 0.68 | |||
| M0 | 0 | 0 | |||
| [AgCl2]− | 176.8, 178.8, 180.8, 182.8 | M1 | 15.6 | [2.6, 31.2] = 28.6 | S15(i) |
| M2 | 10.6 | [0.6, 36.4] = 35.8 | |||
| M3 | 0.7 | [0, 6.6] = 6.6 | |||
| M4 | 0 | 0 | |||
| M5 | 8.7 | [1.4, 35.7] = 34.3 | |||
| M0 | 0 | 0 | |||
| [Ag2Cl3]− | 318.7, 320.7, 322.7, 324.7, 326.7 | M1 | 17.8 | [3.8, 29.5] = 25.7 | S15(j) |
| M2 | 43.9 | [4.7, 68.5] = 63.8 | |||
| M3 | 0 | 0 | |||
| M4 | 0 | 0 | |||
| M5 | 17.8 | [4.6, 51.2] = 46.6 | |||
| M0 | 0 | 0 | |||
| [Ag3Cl4]− | 460.6, 462.6, 464.6, 466.6, 468.6, 470.6 | M1 | 3.4 | [0.7, 9.3] = 8.6 | S15(k) |
| M2 | 15.8 | [2.6, 26.3] = 23.7 | |||
| M3 | 0 | 0 | |||
| M4 | 0 | 0 | |||
| M5 | 4.6 | [1.4, 11.6] = 10.2 | |||
| M0 | 0 | 0 |
3.4 Ion Transport Properties of the Membranes
Steric hindrance and electrostatic (Donnan) exclusion are the primary mechanisms controlling the separation performance of NF membranes.[44] The surface charge characteristics of PA membranes are crucial for their electrostatic exclusion capabilities.[45] To assess this, streaming potential analysis[46] was used to measure the zeta potentials of pristine and modified membranes. All fabricated membranes exhibited negative zeta potentials within a pH range of 4–9 (Figure 4a). The M5 membrane displayed the most negative zeta potential (−31 mV) at pH 7, indicating its strong electrostatic repulsion of negatively charged solutes. This is reflected in its high Na2SO4 rejection (96.8%) due to the electrostatic interactions with SO42− ions. However, zeta potential only measures the electrostatic potential at the slipping plane of a particle or membrane surface in contact with a liquid medium, offering a qualitative indication of the surface charge.[47] To quantify the fixed charges within the PA network or pores, the ionization of carboxylic and amine groups is typically evaluated.[48] Quantifying the carboxylic group density using an ion elution method revealed that the M1 membrane has the highest carboxylic group density (82.0 cites/nm2), followed by M2, M3, M4, M5, and M0 (Figure 4b). This increased COO− density in M1 and M2 membranes, due to the integration of deprotonated carboxyl groups from the BTC ligand used in Ag-MOF synthesis, enhances their electrostatic exclusion capabilities. To further investigate these enhanced properties, the electrostatic characteristics were examined through areal capacitance measurements. In situ ultrasonication (M1 and M2) and Ag-MOF incorporation (M3) elevated the areal capacitance (Figure 4c), with M2 and M1 showing improvements of 4.25 and 3.5 F cm−2, respectively, as measured from the cyclic voltammetry (CV) measurements (Figure S17, Supporting Information). This enhanced areal capacitance contributes to stronger electrostatic fields, improving ion rejection and forming a stable hydration layer that facilitates water passage through the pores.
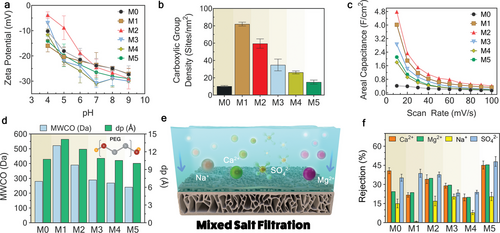
Next, we conducted MWCO measurements to assess the average pore size (dp) of the membranes (Figure 4d). Our results show that the M1 and M2 membranes have larger pores, measuring 14 ± 0.1 and 12 Å ± 0.1, respectively. This finding underscores the impact of ultrasonic-assisted techniques (used in M1 and M2) on enlarging the pore size of the PA layer. The larger pores in the M1 membrane are potentially attributed to higher interlayer MOF loadings on the support, leading to a lower PA cross-linking degree.[49] The large pore sizes can explain the higher water fluxes achieved in these two membranes due to the enhanced water flux (Figure 3a). However, larger pore sizes can also reduce the membrane's ability to reject smaller solutes, potentially compromising its selectivity. The M5 membrane, characterized by the smallest pore size of 10 Å ± 0.1, demonstrates great potential for size exclusion of solutes.
A mixed salt solution with high ionic strength (97 mM) screens the membrane surface potential, allowing for an assessment of size exclusion capabilities as electrostatic exclusion is greatly reduced.[33] Therefore, the separation properties of the membranes were further investigated via mixed salt filtration tests (Figure 4e,f). Notably, the M5 membrane achieved the highest SO42− rejection (48.03%), outperforming the pristine PA membrane (M0) by 12.76%. For divalent salts like MgSO4, the presence of calcium and magnesium ions (in mixed salt filtration) better screens the negative surface potential than magnesium ions alone (in single salt filtration). This results in lower SO42− rejection in the mixed salt solution compared to a solution with only MgSO4 (32 mM IS). Consequently, Mg2+ rejection also decreases in the mixed salt solution to establish electroneutrality. This indicates that steric hindrance in the M5 membrane, due to its narrow pores, prevents the passage of hydrated SO42− ions.
The M5 membrane also outperformed pristine PA and other TFN membranes in rejecting CaCl2 in both single (84.3% rejection) and mixed salt (45.22% rejection) filtrations. The rejection of asymmetric salts like CaCl2 is mainly influenced by the higher valency Ca2+ ions. While the M5 membrane's highly negative surface forms strong electrostatic attractions with Ca2+ ions, the strong steric exclusion hinders their passage through the PA layer. The large-size hydrated Ca2+ ions cannot pass through the narrow pores of the M5 membrane. For symmetric monovalent salts like NaCl, the M1 membrane showed a substantial decrease in Na+ rejection, again implying that size exclusion is the main mechanism for ion separation at high salt concentrations. Given the M1 membrane's largest pores (14Å ± 0.1), both Na+ and Cl- could easily pass through in the absence of electrostatic repulsion (Donnam exclusion).
3.5 Morphological and Structural Characteristics of Membranes
Figure 5 depicts the morphological and surface characteristics of the membranes, highlighting the variations in PA structures resulting from different modification techniques. Top-surface SEM images (Figure 5a0-b5) reveal the presence of Ag-MOFs on the surface of all modified membranes, with M2 showing the most uniform and abundant distribution of smaller nanoparticles, enhancing their bonding to the PA chains and crucial for sustained performance in filtration processes. The PA layer morphology in M2 exhibits a combination of nodular and stripe-shaped patterns known to elevate the surface roughness of TFN membranes.[9]
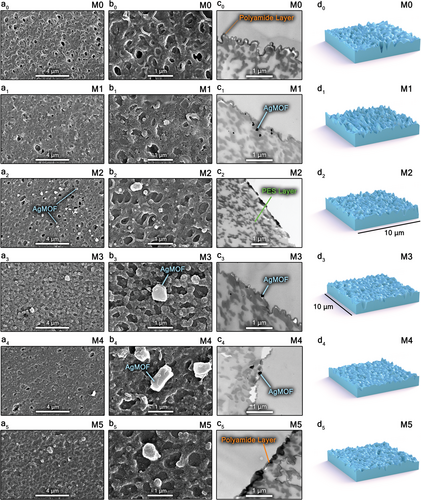
Figure 5c0-c5 show cross-sectional TEM images of the membranes, displaying a relatively thick PA layer (<200 nm) on the PES substrate across all membranes. The Ag-MOFs are embedded within or underneath the PA layer in the modified membranes. A thinner PA layer with less strip-shaped morphology was observed for M1 membrane, which could be due to the interactions between interlayered Ag-MOFs and piperazine molecules. These interactions may restrict the diffusion of amine monomers to the organic solution interface during the IP reaction. The thinner PA layer contributes to improved water flux, as demonstrated by the M1 membrane (65.6 LMH).[49] The contrast between Ag-MOFs and the PA layer is clearly visible in the incorporated (M3) and interlayered membranes (M1 and M4).
The surface hydrophilicity of the membranes was also investigated by measuring their water contact angles. The integration of Ag-MOFs resulted in a reduction of the water contact angle in all modified membranes compared to the pristine PA layer (Table 2), indicating enhanced surface hydrophilicity. Ag-MOFs typically contain hydrophilic functional groups,[10] which improve surface wettability, facilitate water permeation, and potentially mitigate fouling.[50] Variations in water contact angles among the modified membranes reflect the major impact of each incorporation technique on the surface properties of the modified TFN membranes. Notably, dispersion of Ag-MOFs in the aqueous monomer solution (i.e., M3 membrane) resulted in the lowest water contact angle (29.5°) among all membranes, which proved effectiveness of particle incorporation in the interfacial polymerization solution for increasing surface hydrophilicity. The enhanced water flux of the M3 membrane (64.0 LMH), during Na2SO4 filtration tests, is likely due to this elevated surface hydrophilicity.[51] Despite the highly dense PA network of the M5 membrane, its flux remains high (Figure 3a). The enhanced water flux of the M5 membrane (57.4 LMH), compared to the pristine PA membrane (50.9 LMH), can be attributed to its increased hydrophilicity, as inferred from the water contact angle values in Table 2.
| Membrane | Average Roughness [nm] | Root Mean Square Roughness [nm] | Water Contact Angle [°] | Zeta Potential at pH = 7 [mV] |
|---|---|---|---|---|
| M0 | 58.6 | 41.8 | 49.7 | −23.82 |
| M1 | 40.8 | 32.2 | 39.1 | −23.57 |
| M2 | 65.9 | 48.7 | 42.7 | −24.5 |
| M3 | 72.8 | 51.9 | 29.5 | −30.85 |
| M4 | 58.1 | 44.0 | 42.9 | −26.5 |
| M5 | 52.8 | 37.4 | 37.2 | −31 |
Bacterial adhesion, a primary cause of biofouling in NF membranes, is generally facilitated on rougher surfaces due to more available sites for cell attachment. The surface roughness of the membranes, measured by AFM analysis, followed the order M3>M2>M0>M4>M5>M1 (Figure 5d0-d5 and Table 2). Notably, in situ ultrasonically interlayered Ag-MOFs (M1 membrane) resulted in a substantially reduced surface roughness, likely due to restricted PIP diffusion during IP.[18] As previously shown (Figure 3c,d), the M1 membrane achieved the highest FRR in both fouling (94.1%) and biofouling (94.1%) filtration tests, which can be attributed to its smooth (Ra = 40.8 nm) and hydrophilic surface (water contact angle of 39.1°). Conversely, the M3 membrane exhibited the lowest antifouling and anti-biofouling performances, with a FRR of 83.3% and 80.7%, respectively, possibly due to its higher surface roughness (Ra = 72.8 nm), rendering it more prone to adhesion of biofilms. Additionally, the M2 membrane achieved a 93.8% FRR despite its high surface roughness (Ra = 65.9 nm), likely due to its strong bactericidal properties, which will be discussed further in the next section.
Moreover, the electron-donor properties of the membrane surface play a key role in anti-biofouling performance.[52] In situ ultrasonically fabricated membranes (M1 and M2) demonstrated excellent charge storage capacities, indicated by their higher areal capacitance (Figure 4c). The formation of a strong hydration layer on the membrane surface, through interactions with water molecules electron acceptor sites, potentially improves the anti-biofouling performance by restricting the membrane-biofoulant interactions.
3.6 Antibacterial Properties of Ag-MOFs and Membranes
The antibacterial properties of Ag-MOF NPs were examined via minimum bactericidal concentration (MBC) experiments and disc inhibition zone test. The antibacterial effectiveness of the synthesized Ag-MOFs was validated by obtaining a Minimum Bactericidal Concentration (MBC) of 0.1 mg L−1, while forming an inhibition zone around a filter coupon previously coated with Ag-MOFs via vacuum filtration (Figure S18, Supporting Information). Ag-MOFs are known to pose antibacterial properties via multiple pathways, mainly governed by direct physical damage to cell envelope and disruption in cellular functions through reactive oxygen species (ROS) generation.[53] The released ions can break down the cellular ion channels by disrupting the ion balance surrounding the cell envelope.[54] Ag+ ions can further disrupt the integrity and permeability of cell membrane by inactivating essential enzymes through interaction with proteins thiol groups.[55] Ag-MOFs are also reported to penetrate bacterial cells via interaction with lipotropic acid, hydroxyl groups of the peptidoglycan membrane, and phosphate groups of the phospholipid membrane.[56] Additionally, the functional groups of organic ligands in Ag-MOFs can bind to intracellular cations (e.g., Ca2⁺ and Mg2⁺), leading to ROS generation within the cytoplasm, which causes DNA modifications and fragmentation.[57] Effective integration of Ag-MOFs into PA membranes can confer antibacterial properties through the described mechanisms. Figure 6a demonstrates the proposed antibacterial action mode of the modified membranes, which aligns with findings from several related studies.[58]
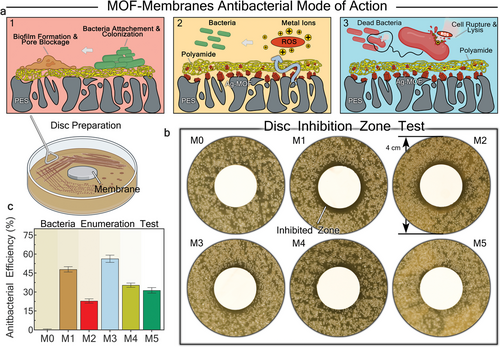
The antibacterial properties of pristine and modified membranes were further assessed by disc inhibition zone test and CFU enumeration test under static suspension conditions with initial bacterial concentrations of ≈106 CFU mL−1 and 103 CFU mL−1, respectively. Consistent circular inhibition zones were formed around M1 and M2 membrane coupons (Figure 6b), whereas other modified membranes demonstrated only partial inhibition zones. In contrast, the pristine PA membrane (M0) did not exhibit any inhibition zone, indicating its susceptibility to biofilm formation.[59] The original images of the agar plates obtained from disc inhibition zone test are shown in Figure S19 (Supporting Information). The CFU enumeration results revealed that the M3 membrane achieved the highest inhibition ratio (IR) of 56.3% relative to M0. The M1 membrane ranked second in effectiveness (IR of 47.9%), followed by the M5, M4, and M2 membranes. The larger inhibition zones in the M1 and M2 membranes can be attributed to higher concentrations of Ag-MOFs within their structures. More specifically, the in situ ultrasonically integrated Ag-MOFs contain additional complexes with Ag+ ions and organic BTC, which can bolster their antibacterial effectiveness via the mentioned pathways. The high IR (%) achieved by the M3 membrane is partially attributed to the strong electrostatic repulsion between the membrane surface and gram-negative model bacteria (E. Coli),[60] which prevents bacterial adhesion during short-term static tests.[32, 61]
As previously discussed, dynamic biofouling filtration tests were also conducted using E. Coli as the biofoulant. With cell sizes ranging from 1 to 2 µm, E. Coli cells are substantially larger than the average pore size of NF membranes, making them prone to capture and proliferate on the membrane surface during dynamic biofouling filtration tests. Therefore, the bactericidal properties of the membranes surface play a crucial role in enhancing their anti-biofouling performance. Consequently, the M1 and M2 membranes achieved the highest FRR (%) in dynamic biofouling filtration tests (Figure 3d), consistent with the results from the disc inhibition zone tests. Overall, it can be inferred that disc inhibition zone results were better aligned with the antibacterial properties of the membrane surface during dynamic biofouling tests, compared to the CFU enumeration test.
3.7 Chemical Robustness of the Membranes
Thermogravimetric analysis (TGA) was employed to investigate the impact of incorporated Ag-MOFs on the thermal stability of TFN membranes in comparison to pristine PA membranes. TGA curves of all fabricated membranes consist of three degradation stages (Figure 7a). The initial stage, ranging from ≈100 °C to ≈440 °C, involves the evaporation of residual solvent from the polymer network. M3 exhibited the highest weight loss of ≈3.0% during this phase, indicating an excess of residual solvent compared to other fabrication methods. The second stage, spanning 440 °C to ≈590 °C, pertains to the decomposition of the PA layer. M2 displayed the lowest weight loss (≈45.6%) among all fabricated membranes, which could be due to elevated thermal stability by robust interactions between ultrasonically incorporated Ag-MOFs and the PA network. Conversely, M3 exhibited the highest weight loss (roughly 49.1%) during the membrane decomposition stage, possibly because of lower concentrations of MOFs and fewer interactions with the PA layer. The final carbonization stage, occurring at temperatures above 600 °C, resulted in the decomposition of the entire membrane structure. In conclusion, all modified membranes demonstrated exceptional thermal stability, maintaining their structural integrity even at temperatures as high as 440 °C.
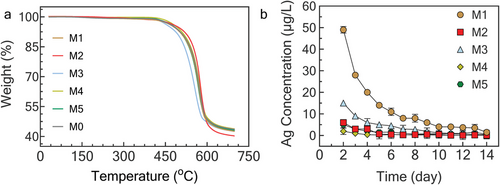
Silver poses toxicity to aquatic life, soil microorganisms, and mammalian species by disrupting cellular functions and reproduction.[62] Silver ions can leach into water bodies and soils during or after a product's lifespan, potentially disturbing ecosystems. However, the transformation, fate, and toxicity of both natural and anthropogenic silver inputs to soil and aquatic ecosystems remain largely unknown.[63] According to the World Health Organization (WHO) and the Environmental Protection Agency (EPA), the maximum permissible concentration of silver in drinking water is 100 µg L−1.[64] Therefore, assessing Ag ion release is essential for evaluating the chemical stability, environmental safety, and antibacterial effectiveness of Ag-MOF-modified membranes. M1 and M3 membranes showed higher leaching concentrations of Ag+ (Figure 7b) compared to other membranes, with a sharp release profile in the first 4 days followed by a more controlled and stable ion release profile. This agrees with their superior antibacterial performance (Figure 6). The ion release from M2 and M5 membranes was more controlled and stable over time with a slightly sharp release profile in the first 3 days. In contrast, the M4 membrane exhibited a reduced ion release concentration compared to other membranes, indicating a potentially lower quantity of loosely integrated Ag-MOFs within the structure of the modified membrane. Overall, the stable and controlled release of Ag+ ions from the modified membranes suggests their sustainable performance over long-term applications for biofouling mitigation. A comparison between the fabricated membranes (M1-M5) and similar MOF-modified NF membranes with anti-biofouling performance is further provided in Table S9 (Supporting Information).
4 Key Findings
4.1 In Situ Ultrasonically Interlayered Ag-MOFs
The M1 membrane showed strong chemical interactions between Ag-MOFs and monomers during the IP reaction, leading to a loose PA layer with the largest average pore size (dp = 14 Å ± 0.1). This feature enabled the M1 membrane to achieve the highest water flux (65.6 LMH) among all membranes. It also demonstrated excellent fouling resistance with a 94.1% FRR, attributed to its smooth and hydrophilic surface.
4.2 Anti-Biofouling Performance
All modified PA membranes showed improved anti-biofouling performance compared to the pristine PA membrane. The order of performance was M1>M2>M5>M4>M3>M0, with M1 and M2 achieving FRR values of 94.1% and 93.8%, respectively. The superior antibacterial properties of M1 and M2, validated by disc inhibition zone tests, are partly attributed to the presence of Ag ions and organic ligands (BTC).
4.3 Incorporation Technique (M3 Membrane)
This method increased the surface hydrophilicity, resulting in an enhanced water flux of 64.0 LMH compared to the pristine PA membrane (50.9 LMH). However, the increased surface roughness (Ra = 72.8 nm) made the M3 membrane more vulnerable to fouling and biofouling, with the lowest antifouling and anti-biofouling performance among the modified TFN membranes with FRR values of 83.9% and 80.7%, respectively.
4.4 Surface-Grafted Dip-Coated Ag-MOFs (M5 Membrane)
Morphological characterizations and MWCO measurements revealed a thick selective layer with a compact PA network and narrow pores (dp = 10 Å ± 0.1), leading to the highest separation performance. Conversely, the dip-coated interlayered Ag-MOFs (M4 membrane) failed to effectively integrate Ag-MOFs, leading to reduced performance metrics, such as water flux.
4.5 Salt Filtration Experiments
Single and mixed salt filtration tests revealed that both electrostatic exclusion and steric hindrance play crucial roles in the selectivity of the modified membranes. Analysis of charge characteristics (zeta potential and carboxylic group density) and solute transport properties (MWCO and mixed salt filtrations) highlighted the importance of electrostatic exclusion in M1 and steric hindrance in M5 membranes.
4.6 Areal Capacitance
The fabricated membrane's areal capacitance showcased the impacts of Ag-MOFs and the ultrasonication process on membrane charge characteristics. The elevated areal capacity of the in situ ultrasonically fabricated membranes (M1 and M2) contributed to the formation of a strong, stable hydration layer on the membrane surface, enhancing both water flux and anti-biofouling properties.
5 Conclusion
This work was a comprehensive study in comparing different fabrication techniques for MOF-integrated PA membranes. Moreover, the ultrasonication process was optimized for the in situ growth and incorporation of small, uniformly distributed Ag-MOFs into PA membranes. Other techniques, including incorporation (M3) and dip-coating (M4 and M5), were also explored. The surface characteristics and filtration performance of all modified membranes were thoroughly compared with the pristine PA membrane (M0). The results demonstrated that each incorporation technique uniquely influences surface morphology, charge characteristics, physiochemical properties, bactericidal features, and ion transport properties. It also illustrated the impact of the integration technique on interactions between Ag-MOFs and the PA layer, resulting in unique filtration performances. Overall, this study provides practical insights into tailoring TFN membranes for specific water purification processes by selecting appropriate incorporation techniques. Based on the findings, future research can explore the impact of incorporating different MOFs synthesized with precise spatiotemporal control over size and distribution, which may enhance filtration performance. Additionally, it is recommended that the sustainability of these modified membranes be investigated through long-term filtration tests to evaluate their durability and real-world applicability. Further studies could also study the environmental impact of the synthesis processes of these membranes.
Acknowledgements
This research benefitted greatly from funding provided by USDATAT-RWTS 00–69526, USEPA Cooperative Agreement MX-00D87019, The Richard Lounsbery Foundation, and the Transforming Wastewater Infrastructure in the United States project of Columbia World Projects. USDA or other agencies have not formally reviewed this paper, and the views expressed in this document are solely those of the authors and do not necessarily reflect those of the agencies.
Conflict of Interest
The authors declare no conflict of interest
Open Research
Data Availability Statement
The data that support the findings of this study are available from the corresponding author upon reasonable request.


