Enhanced Electrochemical Performance of Polyaniline-Boron Doped Diamond Electrode for Supercapacitor Applications
Abstract
Understanding how to tune the properties of electroactive materials is a key parameter for their applications in energy storage systems. This work presents a comprehensive study in tailoring polyaniline (PANI) suspensions by acid-assisted polymerization method and their subsequent deposition on boron-doped diamond (BDD) supports with low/high B concentrations. The porous or densely packed morphology of PANI is successfully controlled by varying the monomer-to-initiator ratio. The interaction between PANI and BDDs leads to the shift in oxidation and reduction potentials, and the high B doping resulted in the reduction of the oxidation potentials. Notably, the highest specific capacitance of 958 F g−1, which represents 90% of the theoretical capacitance, is recorded for the support with relatively low B content. Moreover, PANI obtained by slow kinetic has a stronger interaction with the B-doped diamond support, which is confirmed by electrochemical impedance spectroscopy. This study provides valuable insights for optimizing PANI suspension preparation methods and selecting appropriate boron doping concentrations in nanodiamond supports for composite electrodes in energy storage applications.
1 Introduction
The energy storage devices can be identified as batteries, fuel cells, and electrochemical capacitors. Batteries and fuel cells exhibit high energy density, making them suitable for applications requiring continuous power, such as portable electronic devices and electric vehicles.[1, 2] Complementary to these is the electrochemical energy storage device known as a supercapacitor, also called an electrochemical capacitor. Supercapacitors are increasingly in demand due to their higher energy density, quicker charging and discharging, longer cycle life than rechargeable batteries, and safety.[3] Supercapacitors are typically classified into pseudocapacitors and electrical double-layer capacitors (EDLC).
Pseudocapacitors store energy through reversible and surface-controlled redox reactions of species immobilized on the electrodes. In contrast, EDLC stores charge via electrostatic charge accumulation/adsorption at the electrode-electrolyte interfaces.[4] Due to screening-affected electrostatic absorption, EDLCs have low energy density on one hand but demonstrate good cyclic stability on the other (due to the lack of redox reactions at the interface).
The two most important performance measures of supercapacitors are energy and power density. While EDLCs, such as activated carbon or graphene, typically have an energy density of ≈5–10 Wh kg−1, pseudocapacitors, based on materials like conducting polymer and transition metal oxides, often exhibit a significantly higher energy density, surpassing 100 Wh kg−1. However, they frequently demonstrate lower power densities and reduced stability.[5-10] Although EDLCs are still considered for high-power, small-scale applications, pseudocapacitors are increasingly preferred over EDLCs in the larger field of supercapacitor research due to their greater energy density. Optimal energy and power densities in electrode materials require high porosity, stability, conductivity, and a large specific surface area.[11]
Semiconducting conjugated polymers have been investigated for electrochemical energy storage and conversion due to the fast-redox conversion on the surface. Among semiconducting polymers–polyaniline (PANI) has been widely investigated because of its high conductivity, electrochemical activity, low cost, and easy preparation.[12] A fundamental understanding of the effects of molecular structure on material characteristics and physicochemical properties in conducting polymers requires the preparation of materials with very well-defined chemical structures. There is no doubt that the preparation process is of vital importance for the morphological, electrical, and mechanical properties of the final polymer and, consequently, its application.
Various methods, including chemical processes, can achieve the polymerization of PANI,[13, 14] electrochemical synthesis,[15] interfacial polymerization,[16] vapor phase polymerization,[17] and others. These methods have drawbacks, such as forming insoluble powder (chemical synthesis) or only a thin layer of PANI film obtained on the current collector (electrochemical synthesis). PANI is an active oxidative material in supercapacitors, so its content must be kept at high loading.
There are two methods to improve the mass loading of PANI and its electrochemical performance: 1) developing a new synthetic method of PANI and its subsequent deposition, and 2) utilizing an advanced electrode surface as a current collector. Recently, our group has introduced a new synthetic route, acid-assisted polymerization, where the use of the simplest organic acid (formic acid) induces the ion-electron transfer reaction between monomers and formic acid with the formation of a stable suspension of polymers, such as poly(3,4-ethylene dioxythiophene), polypyrrole or polyaniline.[18-20] A stable PANI suspension is formed from the concentrated formic acid at room temperature. However, the length of the polymer chains, the deposited mass of PANI, and its final morphology depend on the initiator added at the beginning of the reaction.
Furthermore, the electrochemical performance of PANI (participating in the bulk of deposited polymer) is directly influenced by the applied electrolyte and the current collector used. The electrochemical window of an electrode is ascertained by measuring the changes in the current flowing through it (polarization curve) over a wide range of potential at which the electrolyte breaks down at the electrode under both cathodic and anodic conditions.[21] In aqueous electrolytes, the potential window of standard supercapacitor materials like activated carbon is limited to roughly 1.2 V (−0.4 to +0.8 V vs standard hydrogen electrode (SHE) at pH = 7).[22] Exceeding this voltage leads to oxygen and hydrogen evolution reactions, changing the electrolyte's composition and causing the electrode material to corrode.[11, 23] As previously reported, a high molar concentration of dissolved ions can extend the potential window of the aqueous electrolytes.[24] The proton-consisting electrolyte is ideal for PANI electrochemical investigation, which is why a 5 m concentration of ortho-phosphoric acid is chosen in the present work.
The selection of an appropriate current collector for redox polymer is the next critical factor in maximizing the electrochemical performance of the deposited polymer. In the literature, various collectors for PANI have been studied: carbon nanotubes–multiwall or single wall,[25-28] various carbon clothes,[29, 30] fluorine-doped glass substrates,[31, 32] reduced graphene oxide,[33-35] graphite paper,[36] 3D-graphene-carbon,[37] exfoliated graphene,[38] graphene[39] and diamond.[40, 41] Most of these investigated supports contain carbon atoms in their structure.
Diamonds, especially conductive diamonds doped with boron or nitrogen, have been seen favorably as a material for supercapacitor electrodes mainly because they can operate in broad potential windows up to 3.5 V in aqueous electrolyte, allowing for higher operation voltages.[42-44] Heteroatoms or dopants (such as phosphorous, nitrogen, or boron) are frequently added to diamond lattices to create conductive diamond films. The type and amount (or density) of added dopants influence their conductivity. In addition to flat diamond electrodes, various diamond electrodes with enhanced electrochemical capabilities have been developed. The methods for creating these diamond electrodes include the fabrication of diamond nanostructures, blending diamond (sp3 carbon) with sp2 carbon materials, and using pseudocapacitive materials.[3]
In this work, we investigate the interaction of PANI with low-boron-doped and high-boron-doped diamond supports (grown on Si substrate) to enhance the electrochemical performance of composite materials. The synthesis of PANI using a novel acid-assisted polymerization technique and the synthesis of BDD (low doping–3000 ppm and high doping–10000 ppm) are briefly described. The effects of boron-doping in diamond support, together with PANI suspension preparation and deposition, are studied using cyclic voltammetry (CV) and compared with PANI deposited on glassy carbon (GC) and fluorine-doped tin oxide electrodes.
PANI1 suspension deposited on low-doped BDD support possesses a specific capacitance approaching the theoretical one at a scan rate of 0.01 V s−1. The 958 F g−1 was calculated for the three-electrode cell configuration, and this capacitance value only decreased by 19%, with the scan rates increasing to 0.1 V s−1. The high doping of BDD support improves the maintenance of the specific capacitance vs scan rate for PANI1 and PANI2. However, the total value of specific capacitance is lower for this support.
2 Results and Discussion
2.1 Raman Spectroscopy and SEM of BDD
Raman spectroscopy was employed to analyze sp2 and sp3 C atom hybridization, level of B doping, and the presence of structural defects (by recording the shift, width, and asymmetry of peaks). The Raman spectra were measured with the laser 442 nm, which is more sensitive to carbon phases in diamond structures, and the results are presented in Figure 1.

A sharp silicon peak at 520.7 cm−1 and a less intensive broad band ≈950 cm−1, shown in Figure 1, originated from the substrate. The diamond single phonon peak is typically at 1332 cm−1.[44] During the boron doping, the diamond line undergoes a Fano resonance, leading to a peak shift toward lower wavenumbers, in our case, down to 1329 and 1325 cm−1 for the L-BDD and H-BDD films, respectively. For the sample H-BDD, this effect is also connected with pronouncing two boron-related wide bands at ≈508 and 1205 cm−1 (B1 and B2 bands).[45, 46] These can be assigned to boron-dimer pairs and clusters vibrations and symmetry breaking of the diamond lattice, possibly due to boron-carbon complexes.[47] Additional bands were observed ≈1396 cm−1 (L-BDD) to 1440 cm−1 (H-BDD) as a result of the presence of sp2 amorphous carbon phase (trans-polyacetylene segments on grain boundaries and surface)[48, 49] and the G-band (≈1593–1611 cm−1) assigned to sp2-graphitic carbon phases. The intensity of the peaks is directly related to the B doping level (see Figure 1).
The surface morphology of the supports (L-BDD and H-BDD) was investigated using SEM, and the results are presented as the inserts in Figure 1. Comparison of the SEM images of the films taken at 5 and 10 µm scales, respectively (see Figure S1, Supporting Information), reveals that the L-BDD crystal average area (1725 nm2) is larger than the H-BDD crystal average size (1524 nm2). The B doping level, the presence of sp2 C atoms, and the size of the crystals of diamonds will affect the electrochemical performance of the support, particularly the value of the charge-transfer resistance (between the support and PANI), which will be described below.
2.2 Synthesis of PANI1 and PANI2
The polymerization of aniline monomer was performed in the presence of concentrated formic acid, which possesses the ability to form intermolecular forces, with the addition of a low content of initiator (the ratio of aniline to APS for PANI1 is 10:1, and for PANI2 is 5:1). The concentrated formic acid plays a key role in the formation of PANI suspension. If the reaction proceeds in an aqueous organic/inorganic acid solution (diluted condition)–there is no formation of PANI when the ratio of aniline to APS is 10:1 or 5:1.[50] In the current work, aniline polymerization took place in concentrated formic acid: in such conditions, no dissociation of formic acid is present that could protonate aniline monomer and affect charge transfer between aniline and initiator. The transfer of electrons from aniline (oxidation of C─H bond to C─C bond) could be explained by Marcu's theory, which postulated that “electron transfer must occur when fluctuations reorganize the solvent (molecular environment)”.[51] In our case, concentrated formic acid helps to transfer electrons between the monomer and initiator molecules. The reaction rate is slower for the ratio 10:1 (PANI1) than 5:1 (PANI2).
2.2.1 Raman Measurement of PANI1 and PANI2
Several methods were applied to confirm PANI formation. The chemical structures of PANI1 and PANI2 were studied by Raman spectroscopy with an excitation laser of 785 nm, and the most pronounced peaks are presented in Figure 2. The Raman spectrum of PANI1 and PANI2 contains main peaks at ≈1600 and 1500 cm−1 that correspond to the C─C stretching vibrations of semiquinonoid rings and the ─C═N─ stretching vibration and C═C stretching of imine sites, respectively.[44, 52] The peaks in the region 1334–1380 cm−1 correspond to C─N+ stretching vibrations in highly localized polarons and semiquinone cation radicals in delocalized polaronic structures.[53] The relatively high intensity was previously ascribed to the formation of charge transfer between PANI and supports.[53] The peak at ≈1180 cm−1 is assigned to the in-plane C─H bending in quinoid units.[54] For a discussion of the additional peaks, see Table S1 (Supporting Information). Additionally to Raman spectroscopy, infrared spectroscopy (IR) was applied to PANI1 and PANI2 films and the results are presented in Figure S2 (Supporting Information). The IR spectra of PANI1 and PANI2 are similar. Based on the Raman and IR spectra for both polymers, it is concluded that PANI1 and PANI2 have similar chemical structures.

2.2.2 MALDI-ToF, SEM and TEM
The molecular weight of PANI1 and PANI2 were analyzed by MALDI ToF mass spectrometry, and the results are presented in Figure S3 (Supporting Information). Similar molecular weight oligomers were detected in both cases, with the distribution from 6 to 10 aniline units in the chains. These chains are supramolecularly assembled into nano-objects, confirmed by TEM analyses (Figures 2g,h). TEM images reveal that PANI1 has thinner nanofibrils than PANI2, which the reaction kinetics can explain. The polymerization of PANI1 proceeds slower compared to PANI2. From a chemical structure point of view and the size of the chains, the PANI1 and PANI2 are similar. However, the faster formation of PANI2 results in less organized morphology of PANI chains into nano-objects. Based on these results, it is concluded that PANI1 and PANI2 should exhibit different electrochemical performances, which will be studied in detail below. The surface morphology of the PANI1 film differs from that of the PANI2 film, as presented in Figures 2c–f. The SEM images (top views, 0°) of PANI1 films on L-BDD and H-BDD exhibit comparable morphology at varying scales (20 and 5 µm), displaying porous and nanofibril-like features, respectively. This result correlates with the data obtained from TEM images. In contrast, the SEM images of PANI2 deposited on L-BDD and H-BDD exhibit a different morphology, which is compact and less porous, as presented in Figures 2c–f. This finding also correlates with the data from TEM images shown in Figures 2g,h. The TEM images of PANI1 and PANI2 suspensions with a scale bar of 200 nm are presented in Figure S4 (Supporting Information).
2.3 Electrochemical Performance
Using diamond materials as capacitor electrodes has been recognized as a promising approach.[55] A supercapacitor based on a carbon nano grass/BDD composite has exhibited a large specific capacitance (0.4 F cm−2) and good stability (95% capacitance retention even after 10000 charge/discharge cycles), owing to the combination of sp2 carbon and the excellent electrochemical stability of BDD.[56]
2.3.1 CV Measurements of BDD
The CV measurements of BDD (low or high doping level) were recorded to investigate and compare the electrochemical performance of individual supports. The data are presented in Figure 3. The CV curves for L-BDD have a lower current than the H-BDD when measured in three-electrode cell configurations with scan rates ranging from 10 to 100 mV s−1 (see Figure 3). The potential window of the CV scan has been chosen from −0.2 to 0.8 V vs the Ag/AgCl reference electrode because this range represents the stable potential window for PANI investigated in aqueous solutions.[57] The higher current values for H-BDD electrodes were due to higher electrical conductivity from higher boron concentration. The CV curves illustrate the double-layer capacitance nature of BDD supports, as evidenced by the rectangular shape. The dependence of the current values vs scan rates further confirms this characteristic.

2.3.2 CV Measurements of PANI on BDD
The PANI1 and PANI2 suspensions were deposited on the low L-BDD or high H-BDD boron doping electrodes to investigate the electrochemical performance of the resulting composites. Details of the deposition and given names of the electrodes are described in the Experimental Section (see Table 4). Notably, this study represents the first report on composite preparation based on PANI, obtained by acid-assisted polymerization and BDD. The CV curves of PANI1@L2, PANI1@L4, and PANI1@L6 are presented in Figure 4. With the increase in the mass loading of PANI1, the current values also increase. Moreover, as the scan rates increase from 10 to 100 mV s−1, the oxidation potential shifts from 0.3 to 0.5 V for PANI1@L2 and PANI1@L4. For the composite electrode PANI1@L6, the oxidation potential shifts from 0.35 to ≈0.7 V for the scan rates of 10 and 70 mV s−1, respectively. The oxidation potential for PANI1@L6 at a scan rate of 100 mV s−1 could not be observed due to the faradaic processes being slower than the applied scan rate.

It must be emphasized that the CV curves exhibit only one oxidation and one reduction peak (faradaic process) combined with the rectangular shape characteristic of the double-layer component from the BDD support and/or PANI porous structure. The values for oxidation and reduction peaks and their corresponding currents are summarized in Tables S2–S4 (Supporting Information). The number of oxidation and reduction peaks and their positions for PANI are directly influenced by the polymer synthesis method, the electrolytes applied, and the support used. Zhao and co-workers reported the electrochemical deposition of PANI on diamond powder[41] with CV characterization of the PANI showing the first oxidation peak located at 0.195 V vs Ag/AgCl and a current value of 1 000 smaller compared to our composite electrode PANI1/L2 (see Figure 4). Mieko da Silva et al. deposited PANI by chemical oxidation on BDD and studied the electrochemical performance of the composite electrodes by CV.[40] Several oxidation/reduction peaks were recorded, and their position was explained by their association with the various oxidation states of PANI. Based on the literature data and our experimental results, we propose that the position and quantity of oxidation/reduction peaks depend on the PANI synthesis method and the support used. The interaction of the support sp2 carbon with PANI, which will be proved below, is particularly interesting.
The enhanced electrochemical performance of PANI1 is achieved by deposition on high-dopped BDD, as evidenced by CV curves of PANI1@H2, PANI1@H4, and PANI1@H6 (see Figure 4). The composite electrode PANI1@H6 exhibits well-resolved oxidation and reduction peaks recorded for different scan rates. The oxidation potential shift is from 0.3 to 0.4 V vs the Ag/AgCl reference electrode (see Figure 4).
Moreover, the PANI1@H6 shows a higher current connected with the double-layer capacitance than PANI1@L6. Such improved electrochemical performance is explained by the high doping level of BDD, which has a smaller crystal size on the one hand and higher double-layer capacitance on the other hand, as confirmed by CV measurements. The B doping concentration in the diamond support affects the difference between ΔE = Eox-Ered, which is characteristic of the reversibility of the redox process. For the low B doping, the ΔE ranges from 210 mV at 10 mV s−1 to 616 mV at 100 mV s−1 scan rate. In contrast, high B doping results in ΔE ranging from 70 to 346 mV for the same scan rates. It proves that the high B content in diamonds improves the reversibility of the PANI redox process (Tables S2–S7, Supporting Information). It must be emphasized that with the increase of the PANI mass loading, the reversibility of the redox processes has not deteriorated, which fulfills our purpose to apply such materials in energy-saving applications where a high content of electroactive materials is a must.
The PANI2 suspension deposited on a low-dopped BDD electrode exhibits inferior electrochemical performance compared to PANI1 (see Figure 4). This finding may be assigned to a specific PANI2 synthesis and a different amount of deposited polymer, even if the same suspension volume is applied. The PANI2 suspension synthesized faster than the PANI1, and the supramolecular assembly of the short oligomers does not lead to a well-organized structure. Moreover, it is observed that a slightly higher mass loading of PANI is deposited for PANI2 vs PANI1; see Figure S5 (Supporting Information). The CV curves for the PANI2@L2 electrode show oxidation peaks ranging from 330 to 610 mV vs Ag/AgCl reference for scan rates from 10 to 100 mV s−1 (see Figure 4). At high scan rates (70 and 100 mV s−1), the reduction peaks were not observed, meaning that reducing the PANI was impossible at these scan rates. This observation is supported by calculating ΔE values (see Tables S8–S13, Supporting Information). The ΔE is calculated only for PANI2@L2, which is ≈323 mV. The ΔE was 521 mV for PANI2@L4 and 484 mV for PANI2@L6, calculated only for 10 mV s−1 scan rate. The improvement of the electrochemical performance of PANI2 was recorded on H-BDD for electrodes PANI2@H2, PANI2@H4, and PANI2@H6 (see Figure 4). Well-resolved oxidation/reduction peaks are observed for all PANI mass loading. PANI2, with the highest mass loading (PANI2@H6), exhibits the highest current density and the ΔE values ranging from 142 mV (10 mV s−1 scan rate) to 366 mV (100 mV s−1 scan rate). These results indicate that high B doping of diamond has improved the electrochemical performance of PANI2 even at higher mass loading of the polymer.
2.3.3 CV Measurements of PANI on Other Support
Further, to study the effect of the support on the electrochemical performance of PANI obtained by acid-assisted polymerization, both suspensions (20 µL) were deposited on the FTO electrode or GC electrodes (keeping similar surface areas). CV measurements for PANI1@FTO, PANI1@GC, PANI2@FTO, and PANI2@GC are presented in Figure 5. The FTO was selected because the film does not have sp2-carbon atoms in its structure. On the other hand, GC has a high concentration of sp2-carbon atoms in its structure.[58]

The experimental data indicate that the support plays a key role in the position of the oxidation and reduction peaks. PANI1 and PANI2 deposited at FTO electrodes have quasi-reversible electrochemical processes with the ΔE value of 200 mV, even at the lowest scan rate of 10 mV s−1. In contrast, the PANI1 and PANI2 suspensions deposited on GC electrodes have oxidation peaks at lower potentials than the PANI1@H2 or PANI2@H2 electrodes. The lower oxidation of PANI on GC is attributed to the physical-chemical properties of GC, and such a low value of the oxidation potential is a drawback for energy-storage materials.
A comparison of data obtained at 10 mV s−1 scan rate data for different supports and both PANI suspensions (20 µL) are summarized in Figures 5e,f.
The highest value of the oxidation potential for PANI was recorded for PANI1/L2 and PANI2/L2, which also exhibited the highest double-layer current (the position of the oxidation potential is marked by the red arrow in Figure 5e). The positions of the oxidation potentials for other supports are marked with corresponding dashed lines and are lined in the following order for PANI1 as PANI1@GC < PANI1@FTO < PANI1@H2 < PANI1@L2 and for PANI2 as PANI2@GC < PANI2@FTO < PANI2@H2 < PANI2@L2. Based on the summarized data in Figure 5f, it is concluded that the position of oxidation potential depends on two factors: 1) the nature of the support and 2) PANI morphology given by the synthesis.
2.4 Electrochemical Impedance Spectroscopy Measurements
EIS was applied further to understand the interaction between PANI, L-BDD, and H-BDD supports. EIS is a powerful tool that can be used to investigate the internal resistance of the studied composite.[59] First, EIS was measured at open circuit potential, and the impedance modulus (Z) and the phase angle (φ) vs frequency are presented for individual supports (L-BDD and H-BDD, FTO and GC for comparison) in Figure 6.

The electrochemical properties of an electrode are significantly influenced by its resistance, which in turn is dependent on several factors. The conductivity of a diamond electrode is determined by the amount of boron used in the growth of the diamond layer. The H-BDD electrode exhibits a low electrical resistivity (50 mΩcm) and is considered an ideal replacement for the commonly used metal/carbon electrode configuration in electrochemistry. Reducing the boron doping during diamond film growth increases the resistivity of the prepared electrode. This decrease in electrical conductivity gradually causes the BDD layer to transition from a metallic-like conductor to a semiconductor. The L-BDD electrode exhibits higher electrical resistivity than metal/carbon electrodes and already displays semiconductor-like behavior, confirmed by EIS and shown in Figure 6a. The FTO electrode exhibits a similar impedance to H-BDD. The lowest impedance was recorded for the GC electrode due to its chemical structure. However, the phase angle (φ) of the GC electrode is the lowest among all support electrodes (Figure 6d). The phase angle φ ranging from 0° to −90° demonstrates non-ideal performance: this behavior is associated with the electrode morphology (roughness and porous structure). The GC electrode has a smooth surface, which leads to the lowest value of φ compared to L-BDD, H-BDD, and FTO electrodes. The “best performance” of electrodes with the highest capacitance values is typically determined from cyclic voltammetry measurements at specific scan rates (Figure 4) or by galvanostatic charge-discharge measurements at a specific current density (not performed in the current work). However, the capacitance values are generally frequency-dependent for porous materials (PANI) and can be studied by EIS (see Figure 6). The capacitance and resistance behavior in the 1 Hz–1 kHz frequency range was recorded for PANI1@L2, PANI1@H2, PANI2@L2, and PANI2@H2. The results are presented in Figure 6. The intermediate frequency range was chosen to study the charge-transfer resistance between PANI and support.[60] The EIS of PANI1@FTO, PANI1@GC, PANI2@FTO, and PANI2@GC are measured for comparison and shown in the same figure. The modulus of impedances vs frequency for PANI1@L2 and PANI2@L2 exhibits a plateau of almost constant values in the chosen frequency range, with the corresponding low phase values (φ -ranging from 10° to −15°). These observations suggest that PANI1@L2 and PANI2@L2 measured at open circuit potentials represent resistive behavior.
On the other hand, PANI1@H2 and PANI2@H2 have an impedance modulus lower than L-BDD support, with a simultaneous increase of φ values to ≈−40° (Figure 6). This observation directly correlates with the impedance measured for individual support (Figure 6). and provides direct evidence of the B-doping effect on the interaction of PANI with the support, leading to a shift from resistive to capacitive behavior when measured at open circuit potential. The smallest impedance modules were measured for PANI1@GC and PANI2@GC (see Figure 6), which also correlates with the CV data: both electrodes have the lowest measured oxidation potentials (Figure 5). The EIS for PANI1 or PANI2 deposited at FTO shows a similar dependence as polymers deposited at H-BDD. The FTO electrode does not have sp2/sp3 hybridization of C atoms and possesses a rough surface.
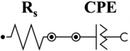
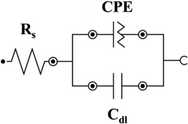
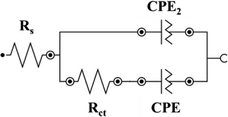
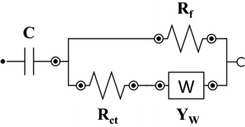
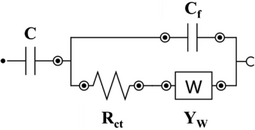
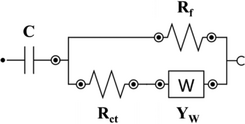
To understand and extract meaningful information from EIS data, it must be fit to an equivalent circuit model that combines fundamental elements such as resistors, capacitors, inductors, constant phase elements, and diffusion elements.[61] Rs (the solution resistance) is the equivalent series resistance, generally describing the electrolyte's and the electrode's internal resistance.[62, 63] CPE is the constant phase element representing double-layer capacitance, which occurs at the interface between solids and ionic solutions due to the separation of ionic and/or electronic charges. W is the Warburg element, which represents the diffusion of ions into the porous electrode in the intermediate frequency region and is a result of the frequency dependence of this diffusion.[62] Cdl and Cf are the capacitance of a double-layer or faradaic component.
The representative scheme of the developed composite electrode with the corresponding ideal elements is shown below for PANI deposited at BDD: (Scheme 1)

The circuit models for individual supports are summarized in Table 3, and the suggested models demonstrate a good fit to the impedance responses of the different supports in the chosen frequency range, with the chi-square goodness of fit for different impedance behaviors in the range from 6 × 10⁻² to 6 × 10⁻³.
In Table 1, a CPE is chosen in all models to describe the non-ideal capacitive behavior of the interfaces. The origin of CPE has been widely attributed to the surface roughness of the electrode, which causes an uneven distribution of various properties across the electrode surface. The CPE is defined as 1/(Yo (jω)N), where N is a constant associated with the roughness of the electrode surfaces.[64, 65] The N values differed from 1, indicating that the electrode interface is not an ideal capacitor: L-BDD–0.938, H-BDD–0.89, FTO–0.52, and GC–0.79. According to the fitted data, the L-BDD electrode has the α value approaching 1, meaning the electrode with the highest roughness, which makes this electrode favorable as a support electrode. This fitting confirms the data presented for the surface morphology in Figure 1 inserts (i.e., larger grains and higher roughness). Moreover, the L-BDD support could be fitted with the simplest equivalent circuit model.
| Name | Circuit model | Rs [Ω] | Cdl [µF] | Rct [kΩ] | CPE [µMho s) | chi-square [χ2] |
|---|---|---|---|---|---|---|
| L-BDD |
 |
71.5 | – | – |
Y0 = 6.5 N = 0.94 |
0.023 |
| H-BDD |
 |
31.5 | 3.27 | – |
Y0 = 10.4 N = 0.89 |
0.006 |
| FTO | 25.2 | 8.32 | – |
Y0 = 3.4 N = 0.52 |
0.01 | |
| GC |
 |
4.8 |
CPE2 (µMho s) Y0 = 13.6 N = 0.87 |
2.13 |
Y0 = 11.8 N = 0.79 |
0.064 |
A limitation of using complex equivalent circuits is that plausible fits can be achieved to EIS data using a range of different circuit element values:[60] the more complicated the equivalent circuit, the greater the uncertainty in determining fitted parameters. That is why applying the simplest equivalent circuit to characterize the system is preferable.
The equivalent circuit models suggested for the PANI1 and PANI2 films deposited at different supports with the corresponding values for the ideal elements are summarized in Table 2.
| Name | Circuit model | C [mF] | Rct [Ω] | YW [mMho.s] | Rf/Cf | chi-square [χ2] |
|---|---|---|---|---|---|---|
| PANI1@L2 |
 |
6.04 | 867 | 0.194 |
Rf: 143 Ω |
0.001 |
| PANI2@L2 |
 |
14 | 139 | 52.2 |
Cf: 12.9 nF |
0.0007 |
| PANI1@H2 | 4.8 | 54.1 | 86.9 |
Cf: 17.1 nF |
0.001 | |
| PANI2@H2 |
 |
9.34 | 353 | 0.486 |
Rf: 28.5 Ω |
0.001 |
The EIS data for PANI1 deposited at L-BDD support could be fitted with the modified Randles equivalent circuit: the presence of charge-transfer resistance (Rct) between PANI and the support, and the Warburg impedance (W) expresses the diffusion processes at the electrolyte/electrode surface.[60] The low value of Warburg impedance of 0.194 mMho.s for PANI1@L2 confirms that diffusion of ions through the electrode/electrolyte interface is facile. When the same PANI volume was deposited on H-BDD support (PANI1@H2), the Warburg impedance increased from 0.194 to 86.9 mMho.s, proving the role of the support in the electrochemical behavior of PANI1. The H-BDD has a smaller crystal size than the L-BDD, as confirmed by SEM (see Figure 1). Based on this data, it can be concluded that PANI1 forms a less porous film on H-BDD compared to L-BDD. The charge-transfer resistance (Rct) of PANI1@L2 is 867 Ω, which is 16 times higher compared to PANI1@H2 (54.1 Ω). The decrease of the Rct for the H-BDD electrode is associated with the high B doping level of the support, as shown in Figure 6. The fitted EIS data for PANI2 deposited at L-BDD support (PANI2@L2) shows a lower value of Rct compared to PANI1@L2 and a slightly higher value of W impedance value compared to PANI1@L2 due to poor interaction between PANI and support. The increase of the B doping of the support did not improve the interaction of PANI with the support. The PANI2@H2 has an Rct of 353 Ω, which is 3 times higher compared to PANI2@L2. Based on the EIS data measured and fitted parameters for both polymer suspensions, it is concluded that PANI1 has a stronger interaction with the B-doped diamond support compared to PANI2.
The results of the fitting models of EIS measurements for PANI1 and PANI2 deposited at FTO or GC are presented in Table S15 and Figure S6 (Supporting Information). The GC support has lower resistance than diamond electrodes, reflected in the fitted values for the Rct; see Table S15 (Supporting Information). PANI1@GC and PANI2@GC have low Rct values compared to PANI1@FTO and PANI2@FTO electrodes, which is in correlation with the measured impedance data for individual supports. However, the fitted values for the Warburg impedance are much higher for FTO and GC compared to BDD supports, indicating limited diffusional processes in these films. It must be emphasized that the experimental data did not record a typical semicircle represented by ideal Rct.[60] A general conclusion from the fitting of EIS data for different supports and two PANI suspensions is that the BDD electrodes demonstrate stronger interaction with the PANI, particularly the PANI1@L2 electrode, which has simultaneously low Warburg impedance and high capacitance.
A key parameter in electrochemical energy-saving materials is capacitance. This study investigated a new synthesis method of stable PANI suspension with further deposition on different supports. The specific capacitance values were calculated from CV curves according to Equation (1) for individual supports, and PANI1 or PANI2 deposited at various supports (presented in Figure 7 and with details in Table S14, Supporting Information). The literature data (combining PANI and diamonds) are presented for comparison (Figure 7a). The theoretical capacitance was calculated according to the Faradaic Equation (2), where the number of electrons participating in the oxidation/reduction process is 1 with the working potential window of 1 V. Many publications claim a high theoretical value of PANI capacitance in a narrow potential window[66] or present an overestimated value for double-layer capacitance combined with faradaic capacitance.[66-68] In this study, the highest specific capacitance of PANI1, measured in three-electrode cell configuration in 5 M H3PO4, and a potential window of 1 V, was calculated to be 958 F g−1 for the electrode PANI1@L2, see Figure 7 and Table S14 (Supporting Information). This value represents 90% of the theoretical capacitance calculated by Equation (2). The measured specific capacitance for other investigated electrodes is lower (see Figure 7). This difference is attributed to the method of PANI suspension synthesis and applied support (L-BDD vs H-BDD). The layer-by-layer deposition method was applied in the current study. The first deposited layer (PANI1@L2, PANI1@H2, PANI2@L2, PANI2@H2) has one interface between the BDD support and the polymer. PANI1 and PANI2 deposited at L-BDD have the highest specific capacitance for the scan rate of 0.01 V s−1. The increase of the scan rate from 0.01 to 0.1 V s−1 leads to decreased specific capacitance–19% for PANI1@L2 and 43% for PANI2@L2 (Figures 7b,d). The PANI1 suspension retains its electrochemical performance even at higher scan rates than the PANI2 suspension. The H-BDD support improved the specific capacitance performance ≈10%–20% of the original value is lost with the increase of the scan rates for both PANI1 and PANI2, but the total value is lower compared to the L-BDD supports (Figures 7c,e). The composites where two or three layers were deposited have additional interfaces between polymer layers, which decreased the electrochemical performance of these electrodes–with the increase of the scan rates, the decrease of the specific capacitance by 48% for PANI1 and 65%–71% for PANI2 were recorded. Further investigation and improvements to the PANI suspension deposition method must be made. In conclusion, the composite electrode obtained from L-BDD and PANI1 suspension has the position of oxidation peak ranging from 291 mV (measured at 10 mV s−1) to 530 mV vs Ag/AgCl reference electrode, exhibits high double-layer current and very low Warburg impedance. The PANI1@L2 suspension, combined with high specific capacitance, possesses the optimal ratio of PANI mass loading to support surface area. The specific energy density of PANI1@L2 was calculated and the value of 266 Wh kg−1 was obtained (calculated according to Equation 3).

Further research is necessary to determine an optimal mass loading of PANI and B doping levels of diamonds. From the measured data, it is suggested to 1) modify the acid-assisted polymerization of PANI by further slowing the synthesis reaction (particularly decreasing the amount of initiator); 2) perform PANI deposition in a single step to avoid the interfaces between polymer layers; 3) implement direct deposition of the PANI during the in-situ synthesis. From our point of view, the decrease in the kinetic of the reaction is the most important key parameter that will lead to improved PANI morphology and enhanced electrochemical performance of the composite electrodes.
3 Conclusion
This study investigated the optimization of polyaniline and boron-doped diamond composite electrodes for supercapacitor applications, revealing several key findings. The boron doping level in the diamond support significantly influences its interaction with the PANI film, consequently affecting the electrochemical performance. The interaction and performance were determined to depend on the crystal size, electrical resistivity, and sp2 carbon content of the BDD support. Larger BDD crystals facilitated better deposition of PANI films. However, lower-doped BDD exhibited higher impedance compared to highly-doped BDD, indicating a trade-off between crystal size and electrical conductivity in optimizing electrode performance.
The acid-assisted polymerization synthesis with reduced initiator concentration (APS) resulted in stable PANI suspensions. PANI1, synthesized with a 10:1 (aniline:APS) ratio, formed smaller fibrils and less dense films, leading to improved electrochemical performance compared to PANI2 (5:1 ratio). The PANI2 film was more conductive than PANI1 but less porous, limiting this polymer for the application of energy-storage materials. These findings highlight the importance of controlling the polymerization kinetics in achieving optimal PANI morphology and electrochemical properties. The BDD supports demonstrated the best electrochemical performance compared to the fluorine-doped tin oxide or glassy carbon supports.
The study also revealed that the deposition method significantly impacted the electrochemical properties of PANI films. The chosen method, “layer-by-layer deposition,” might not be the best one. Further methodological approaches must be tested to find the optimal way to obtain the high-mass leading of the PANI electrode.
A notable correlation between Warburg impedance and capacitance values was established through calculated EIS and CV measurements. The EIS confirmed that B doping level plays a crucial role in the interaction of PANI and BDD support. The PANI2 film had a Warburg impedance value 200 times higher than that of PANI1. However, its lower porosity limited its potential for supercapacitor applications. In contrast, the PANI1@L2 electrode approached the theoretical capacitance value, demonstrating its potential for high-performance supercapacitor applications.
These findings provide valuable insights for further optimization of PANI-BDD composite electrodes and pave the way for advancements in supercapacitor technology. The optimization of B doping levels, PANI synthesis, and deposition methods hold promise for enhancing energy storage capabilities and overall supercapacitor performance. Further research in these areas could lead to the development of more efficient and high-capacity energy storage devices for various applications.
4 Experimental Section
Materials
Aniline (99%, analytic grade Lach-ner, Czech Republic, p.a.), ammonium persulfate (99%, Lach-ner, Czech Republic), concentrated formic acid 99.8% (Sigma–Aldrich, Czech Republic), ethanol (99.8%, Sigma–Aldrich, Czech Republic), ortho-phosphoric acid (85%, Merck, Czech Republic). Fluorine-doped tin oxide-coated glass slides (FTO, SnO2/F, Sigma–Aldrich, 10 × 20 × 2.2 mm3, surface resistivity 7 Ω sq−1) were placed in an ultrasonic bath with acetone for 10 min, then with ethanol for 10 min and with water for 10 min before use. Glassy Carbon (GC) (5 mm diameter, Metrohm Czech Republic) was cleaned with a cleaning kit.
Synthesis of PANI1 and PANI2
Synthesis of PANI suspension was carried out in two monomers: ammonium persulfate rations: 1) 0.2 mL (0.3 m) of aniline was dissolved in 1 mL of ethanol, and 4.7 mL of concentrated formic acid was mixed with 0.047 g (0.03 m) of ammonium persulfate (APS) dissolved in 1 mL of deionized water. The solution was labeled PANI1, and 2) 0.2 mL (0.3 m) of aniline was dissolved in 1 mL of ethanol, and 4.7 mL of concentrated formic acid was mixed with 0.094 g (0.06 m) of APS dissolved in 1 mL of deionized water. The solution was labeled PANI2. The rate of reaction polymerization proceeded faster in PANI2 compared to PANI1.
Synthesis of BDD
BDD was deposited on commercially available silicon (single-side polished; p-type; <100>) 10×10 mm2 substrates. The deposition process could be summarized in two steps: i) seeding and ii) microwave plasma-enhanced chemical vapor deposition. Before seeding, the substrates were cleaned in acetone and isopropanol, followed by deionized water in an ultrasonic bath. The seeding was performed using an ultrasound bath in water-based nanodiamond powder suspension (NanoAmando, with an average particle size of 5 nm) for 40 min according to the procedure described elsewhere.[70] BDD depositions were done using a 2.45 GHz microwave plasma-enhanced chemical vapor deposition system (SEKI SDS6K, Cornes Technologies, Ltd.). The flow of gases, growth conditions, and grown thicknesses are shown in Table 3.
| sample | CH4 [sccm]a) | TMB [sccm] | H2 [sccm] | Ts [°C]b) | B/C ratio [ppm]c) | PMW [kW]d) | p [Torr]e) | t [h]f) | Thickness [µm] |
|---|---|---|---|---|---|---|---|---|---|
| L-BDD | 10 | 15 | 475 | 900 | 3 000 | 3 | 60 | 3 | 1.01 |
| H-BDD | 10 | 50 | 440 | 850 | 10 000 | 3 | 60 | 3 | 1.24 |
- a) sccm–standard cubic centimeters per min;
- b) Ts–substrate temperature;
- c) ppm–parts per million;
- d) PMW–provided microwave power;
- e) p–gas mixture pressure;
- f) t–deposition duration.
Deposition of PANI1 and PANI2 at L-BDD or H-BDD Electrodes
The PANI1 or PANI2 suspensions were drop-casted by the following steps: 20 µL of the suspension was placed equally on top of the L-BDD or H-BDD electrodes with the formation of a thin layer (the electrodes were called “2”). To increase the mass loading of PANI, a second drop with a volume of 20 µL was added, bringing the total volume to 40 µL. The electrodes were then referred to as “4”. The three-layered electrodes were prepared by dropping three times 20 µL (the total volume is 60 µL, and the electrodes are called “6”). The electrodes were dried in an oven at 40 °C before each layer deposition. Due to the hydrogen termination of the diamond, when the PANI solution was dropped on the surface of the electrode, the contact angle was greater than 90°, which was a characteristic of hydrophobicity. The final electrodes underwent overnight (12–15 h) drying at 40 °C. A non-conducting tape (Kapton tape, Dupont) was applied on the back side and edges of the electrode (Si-wafer). The procedure was done to prevent interaction between the electrolyte and the Si-wafer (Table 4).
| Type of suspension | Type of BDD | Deposited volume, µL | Names |
|---|---|---|---|
| PANI1 | L-BDD | 20 | PANI1@L2 |
| 40 | PANI1@L4 | ||
| 60 | PANI1@L6 | ||
| PANI1 | H-BDD | 20 | PANI1@H2 |
| 40 | PANI1@H4 | ||
| 60 | PANI1@H6 | ||
| L-BDD | 20 | PANI2@L2 | |
| 40 | PANI2@L4 | ||
| 60 | PANI2@L6 | ||
| PANI2 | H-BDD | 20 | PANI2@H2 |
| 40 | PANI2@H4 | ||
| 60 | PANI2@H6 |
Material Characterization
Raman spectra of PANI dried droplets were collected using Renishaw in Via Reflex Raman microscope (Renishaw, UK) equipped with Peltier cooled CCD detector and 442 nm (Dual Wavelength He-Cd laser, model IK5651R-G, Kimmon Koha) and 785 nm lasers for excitation (Diode laser, Renishaw HPNIR785 Laser Source). The scattered light was collected through Leica objective 100× with NA 0.9 (50×/0.5 LWD) in confocal mode and analyzed by the spectrograph with holographic gratings 2400 and 1200 lines mm−1, respectively, for used excitations. Each sample was measured at 3 different positions, where each of them was exposed by a continuous wave laser (the power of 1.1 mW) focused to a spot of 1 µm for 10 s, and spectra were sampled 8 times. This combination of parameters prevents sample damage and light-induced changes in the material. After that, average spectra were calculated, the baseline was subtracted from collected spectra (asymmetric least squares method), and Gaussian functions were used for peak analysis.
All SEM images of PANI and BDD films were acquired at 10 kV under 0° (top-view) in the regime of secondary electrons (MAIA 3, Tescan).
All electrochemical measurements were carried out using a Metrohm AUTOLAB Potentiostat/Galvanostat PGSTAT302N with a frequency analyzer FRA32 M module controlled by the software NOVA 2.1.4. Three-electrode cell configurations were used for all electrochemical measurements: working electrodes (BDD), counter-electrode (Pt), and reference electrode Ag/AgCl, 3 m KCl. Cyclic voltammetry (CV) was measured in the potential window from −0.2 to 0.8 V vs the Ag/AgCl reference electrode with the scan rate from 10 to 100 mV s−1. 5 M H3PO4 was chosen as an aqueous electrolyte for all measurements. Electrochemical impedance spectroscopy (EIS) was performed with a 10 mV amplitude in the range of 1000–1 Hz at the potential of the open circuit point of the system. The equivalent circuit analysis was made, and the chi-square (χ2) value points out the divergent regions between the fitted and measured data.
MALDI-ToF mass spectra were acquired using the UltrafleXtreme TOF–ToF mass spectrometer (Bruker Daltonics, Germany) with a 2000 Hz smart beam-II laser (355 nm) using the positive ion reflectron mode. Panoramic pulsed ion extraction and external calibration were used for molecular weight assignment. The dried droplet method was used in which the solutions of the sample in concentrated HCOOH and matrix DHB (2,5-Dihydroxybenzoic acid; Sigma–Aldrich, 98%, 20 mg mL−1) in H2O are mixed in the volume ratio 4:20. 1 mL of the mixture was deposited on the ground-steel target.
TEM observations were performed through a Tecnai G2 Spirit Twin 12 (FEI, Czech Republic), using a bright field imaging mode at an accelerating voltage of 120 kV. 3 µL of the solutions were dropped onto a copper TEM grid (300 mesh), coated with thin, electron-transparent carbon film. The excess solution was removed by touching the bottom of the grid with filtering paper. This fast solution removal was performed after 2 min of sedimentation to minimize oversaturation during drying. The sample was left to dry completely at ambient temperature before observation.
Calculations
The mass loading of PANI was determined by calculating the content of PANI in a specific volume of a suspension. The measurements were repeated three times for each volume. The specific volume of PANI suspension was placed on the evaporating glass, and the glass was measured before PANI suspension deposition. Then, the suspension was dried in an oven at 40 °C to maintain the constant weight. The evaporating glass was weighed. After that, the PANI film was washed with 5 m HCOOH to remove residual from the initiator and dried again. The final PANI film was weighed again. The loading of PANI was determined by extracting the weight of the evaporating glass. The METTLER TOLEDO analytical balance with 1 µg accuracy was used.
The fitting of the EIS data was performed using NOVA software.
Acknowledgements
E.T. and S.B. contributed equally to this work. This work was supported by the Czech Academy of Sciences within the Strategy AV21 framework (VP26-Breakthrough Technologies for the Future) and by the MEYS OP JAC project SENDISO (no. CZ.02.01.01/00/22_008/0004596), used the infrastructure of the CzechNanoLab (no. LM2023051), and was partially supported by the CTU university project no. SGS24/132/OHK4/3T/13. O.S. and R.P. thank the Mobility project between the Czech and Polish Academy of Sciences (PAN-24-20). The authors kindly acknowledge R. Jackivová for SEM measurements.
Open access publishing facilitated by Ustav makromolekularni chemie Akademie ved Ceske republiky, as part of the Wiley - CzechELib agreement.
Conflict of Interest
The authors declare no conflict of interest.
Open Research
Data Availability Statement
The data that support the findings of this study are openly available in Zenodo at https://doi.org/10.5281/zenodo.13149199, reference number 13149199.