Unlocking Single-Particle Multiparametric Sensing: Decoupling Temperature and Viscosity Readouts through Upconverting Polarized Spectroscopy
Abstract
Upconverting particles (UCPs), renowned for their capability to convert infrared to visible light, serve as invaluable imaging probes. Furthermore, their responsiveness to diverse external stimuli holds promise for leveraging UCPs as remote multiparametric sensors, capable of characterizing medium properties in a single assessment. However, the utility of UCPs in multiparametric sensing is impeded by crosstalk, wherein distinct external stimuli induce identical alterations in UCP luminescence, hindering accurate interpretation, and yielding erroneous outputs. Overcoming crosstalk requires alternative strategies in upconverting luminescence analysis. In this study, it is shown how a single spinning NaYF4:Er3+, Yb3+ upconverting particle enables simultaneous and independent readings of temperature and viscosity. This is achieved by decoupling thermal and rehological measurements—employing the luminescence of thermally-coupled energy levels of Er3+ ions for thermal sensing, while leveraging the polarization of luminescence from non-thermally coupled levels of Er3+ ions to determine viscosity. Through simple proof-of-concept experiments, the study validates the capability of a single spinning UCP to perform unbiased, simultaneous temperature, and viscosity sensing, thereby opening new avenues for advanced sensing in microenvironments.
1 Introduction
In biological systems, the interplay between temperature and viscosity is pivotal. For instance, fluctuations in intracellular viscosity can arise from alterations in cytoskeletal structure or changes in local temperature: two phenomena occurring concomitantly during cell development.[1, 2] Hence, a comprehensive understanding of the dynamics within biological microenvironments requires that both temperature and viscosity are monitored simultaneously and in a remote way, thus minimizing perturbations to the investigated system (e.g., a cell).
Individual luminescent particles have emerged as prime probes for remote and high-resolution sensing, offering unprecedented insights into the behaviors of binary mixtures,[3] chemical reactions, complex liquids,[4] and cytoplasm.[5] Among these luminescent particles, erbium-doped upconverting particles (UCPs) stand out due to their sensitivity to temperature,[6-10] and mechanical pressure.[11-13] Notably, the temperature-sensing capability of erbium-doped UCPs is well established, relying on spectral analysis of their green emission stemming from two thermally coupled states.[14-18] Furthermore, UCPs can be utilized for remote viscosity sensing through the analysis of the rotation dynamics of a single UCP within an optical trap.[19, 20] Rotation dynamics can be extracted from examining the fluctuation in the polarization state of upconverting luminescence and its correlation with particle orientation.[21, 22] Consequently, the analysis of the luminescence from a single UCP holds promise for simultaneous determination of viscosity and temperature. Previous experiments using UCPs for intracellular sensing have separately reported on temperature or viscosity, but never on the simultaneous readout of these two parameters.[23] This is because of challenges posed by crosstalk: a phenomenon where different external stimuli – herein temperature and viscosity – induce similar or indistinguishable changes in luminescence, thus yielding faulty readouts.[24] A strategy to effectively separate the response to temperature and medium viscosity via luminescence sensing is thus required to achieve accurate readouts of these parameters of great biological relevance.
This study showcases the feasibility of decoupling temperature and viscosity readouts through multiband analysis of luminescence from a single UCP. We present reliable, crosstalk-free multiparametric sensing using a single UCP rotating within an optical trap, leveraging analysis of its visible anti-Stokes emission spectrum. The green luminescence from thermally-coupled states of Er3+ ions provides the thermal readout, while real-time analysis of red luminescence polarization enables determination of spinning speed and, consequently, medium viscosity.
2 Results and Discussion
2.1 Single Particle Polarized Spectroscopy
Birefringent upconverting NaYF4 microparticles doped with Er3+ and Yb+3 ions were synthesized by a hydrothermal method, as described elsewhere.[25] These particles present a hexagonal disk-shaped morphology (see Figure 1a) with average thickness and diameter of 1.4 ± 0.2 µm and 4.4 ± 0.3 µm, respectively (see Figure 1b and data included in Synthesis section of Experimental Section). The hexagonal β-phase crystal structure of the UCPs was confirmed by X-ray diffraction analysis (see Section S1 and Figure S1, Supporting Information) A single-beam optical tweezers setup is used for the isolation of a single UCP. Optical trapping is achieved by focusing an 808 nm laser beam into the chamber containing an aqueous UCP suspension. The optical torque orientates the UCP within the trap with its hexagonal face parallel to the wavevector of the 808 nm radiation. If the 808 nm laser radiation is linearly polarized, then the UCP reaches a fixed position with its hexagonal face parallel to the laser polarization (Figure 1c). On the other hand, when the 808 nm laser radiation is circularly polarized, the transfer of angular momentum results in a continuous rotation of the UCP (Figure 1d).[26] The polar plots of the 808 nm trapping radiation when it is linearly and circularly polarized are included in Figure S2 (Supporting Information).
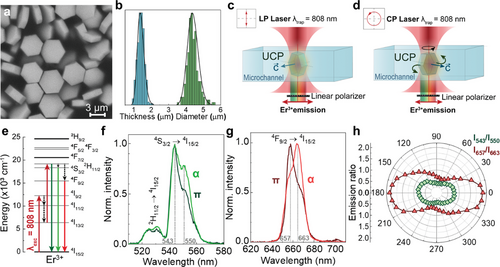
The presence of both Er3+ and Yb3+ ions within the UCP allows optical excitation of visible emission under either 808 or 980 nm illumination. Due to the water absorption band at 980 nm and to avoid undesirable laser heating, in this work experiments were performed under 808 nm excitation.[27] Under direct Er3+ excitation at 808 nm, the Er3+ ions in the NaYF4 crystal are directly excited up to high energy levels via sequential absorption of pump photons (Figure 1e), thus resulting in a visible emission from Er3+ ions. This visible emission is constituted by three bands, centered at 530, 550, and 660 nm, corresponding to the 2H11/2,4S3/2 → 4I15/2 (green bands) and to the 4F9/2 → 4I15/2 (red band) transitions, respectively.[28-30] Because of the anisotropic crystal field of NaYF4 UCPs, both the green and red bands are polarized, and the shape of the emission spectra depends on the relative orientation between the electric field of the emitted radiation () and the optical axis of the NaYF4 UCP ( axis, that aligns perpendicularly to the hexagonal face of the UCP).[22] To assess the polarized emission of an individual UCP in water, a single UCP was optically trapped with a linearly polarized 808 nm laser beam that resulted in its fixed orientation within the trap. The polarization properties of the visible emission were recorded using a rotating linear polarizer located in the emission pathway. Figure 1f,g show the green and red emission spectra from a single, optically trapped, NaYF4 UCP as obtained when (α configuration) and when (π configuration). The dashed lines in Figure 1f,g indicate the specific wavelengths where the polarization dependence of luminescence becomes more evident. The obtained polar diagrams of the ratio between these intensities (Figure 1h) reveal that both green and red bands are polarized, although the red band exhibits a significantly larger degree of polarization dependence. Indeed, the degree of polarization calculated for the I543/I550 (green) and I667/I663 (red) intensity ratios were determined to be 0.28 and 0.44, respectively.
2.2 Single Particle Polarized Luminescence Thermometry
2.3 Luminescence-Based Velocimetry for Viscosity Sensing
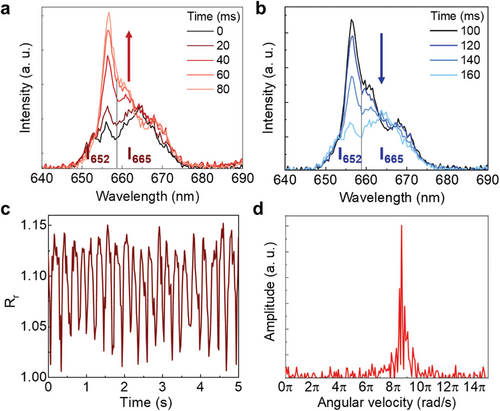
It is important to remark here that the measured viscosity corresponds to the viscosity of the medium in physical contact with the rotating UCP, i.e., at the local temperature Tl that is here assumed to be equal to the temperature of the UCP. We have also explored the possible temperature dependence of Rr (see Section S5 and Figure S4, Supporting Information) concluding that it is, within experimental error, a temperature-independent intensity ratio. This was, indeed, expected as this red band is not generated by thermally coupled states. Thus, we conclude how a proper analysis of the shape fluctuations of the red band provides us with a reliable reading of the rotation speed.
2.4 Real-Time, Decoupled Temperature and Viscosity Sensing
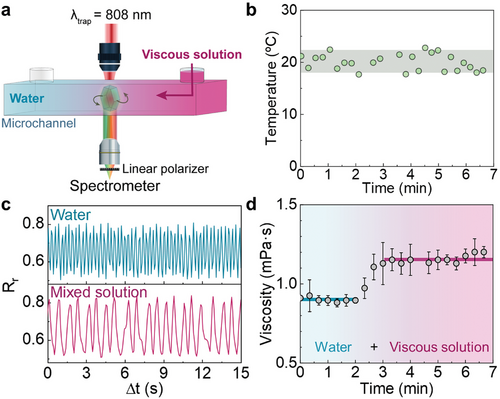
Sections 2.2 and 2.3 revealed how multiband ratiometric analysis of the luminescence generated by a rotating UCP opens the possibility of decoupled readout of temperature and viscosity. To demonstrate this, we conducted a proof-of-concept experiment in which the rotating UCP is used for simultaneous sensing of viscosity and temperature during fluid mixing (Figure 4a). A single UCP is optically trapped and rotated within a microchamber by a circularly polarized 808 nm laser beam. The microchamber is placed on a stage at a constant temperature of 20 °C. The absence of any relevant laser-induced heating has been confirmed from the analysis of both the Er3+ luminescence and the rotation dynamics, as described in Section S6 (Supporting Information) (Figure S5, Supporting Information). Initially, the microchamber was filled with water. At a specific timepoint, a second liquid – consisting of a viscous solution of polyacrylamide (PAM) in water with a viscosity of 1.88 mPa·s also at a temperature of 20 °C – was injected into the chamber through one of its inlets. Details about the injection procedure and solution properties can be found in the Experimental Section, and the emission spectra of the rotating UCP is shown in Section S7 (Supporting Information) (Figure S6, Supporting Information). Time evolution of local temperature and viscosity before, during, and after the diffusion of the viscous solution was determined from the ratiometric analysis of both green and red bands, respectively, as explained in Sections 2.2 and 2.3. The time evolution of the local temperature (Figure 4b) reveals an average temperature of 19.9 °C, in very good agreement with the temperature set externally in the microchamber (20 °C). Statistical analysis of experimental data reveals a temperature uncertainty, estimated from the standard deviation of temperature readouts, of ±1.5 °C. Note that the diffusion of the viscous PAM solution does not lead to any noticeable change in the temperature sensed by the particle within the abovementioned uncertainty. This was, indeed, expected as the injected viscous medium was at the same temperature as the water initially filling the microchamber. Figure 4b reveals that any change in local viscosity cannot be correlated with temperature and, thus, should be caused by the diffusion of the viscous medium through the chamber. Figure 4c includes the time fluctuation of the intensity ratio Rr before (blue) and after (pink) the viscous medium has fully mixed with the water within the chamber. When the viscous liquid diffuses along the chamber there is a slow-down of the particle spinning, indicating an increment in local viscosity. The time evolution of local viscosity was determined from the Fourier analysis of the Rr versus time (Figure 4d) at different time points after the injection of viscous liquid. This analysis showed an initial viscosity between 0.9 and 1.0 mPa·s (expected for pure water), followed by a rapid increase to an average value of 1.2 mPa·s upon intermixing of water with the PAM solution. As expected, the latter value is lower than the one of the PAM solution (1.88 mPa·s), due to the dilution of the polymer solution in pure water.
Once the ability of a rotating UCP for decoupled measurement of temperature and viscosity has been demonstrated, we applied this method to determine the temperature dependence of viscosity of an aqueous solution of PAM using the set-up represented in Figure 5a. An individual UCP was optically trapped and rotated within a microchamber by using a focused 808 nm laser beam. The microchamber was filled with a polyacrylamide (PAM) solution whose viscosity versus temperature curve is unknown. The (negligible) effect of PAM on the spectroscopic properties of our UCP are discussed in Supporting Information (Section S8 and Figure S7, Supporting Information). The polarized luminescence generated by this UCP was registered to achieve simultaneous reading of both temperature and viscosity. Local temperature was varied by using an additional single-mode diode laser operating at 1450 nm (radiation highly absorbed by water) that is coupled to the experimental system and that overlaps with the 808 nm trapping laser. The laser beam radius at the focus of the 808 and 1450 nm radiation within the chamber were estimated to be 0.7 and 1.1 µm, respectively. The power of the 808 nm laser was kept constant (70 mW, corresponding to 4.5 MW cm−2) during the experiment to ensure a constant optical torque. On the other hand, the 1450 nm laser power was varied between 0 and 30 mW (from 0 to 0.8 MW cm−2) to change the local temperature of the fluid. For each value of the 1450 nm laser power, we analyzed the green and red bands luminescence to determine the local temperature and viscosity, respectively (see Figure 5b). As expected, and in agreement with previous works, the local temperature increases linearly with the 1450 nm laser power while the local viscosity decreases due to the local heating. Combining the data shown in Figure 5b, we obtained the temperature-induced reduction in the local viscosity of the polyacrylamide solution (Figure 5c). The experimental data can be compared with previous reports on the temperature dependence of the viscosity of similar solutions.[43] A reasonably good agreement between our data and those obtained by rheological measurements using a viscometer (solid line in Figure 5c) is observed, which clearly confirms the validity of our approach for simultaneous measurement of the temperature and the viscosity.

3 Conclusion
In summary, in this work, we have introduced a novel strategy to achieve uncoupled and simultaneous readouts of local viscosity and temperature. The readout of these two parameters, unaffected by cross-talk, is achieved by analyzing the luminescence generated by an optically trapped NaYF4: Er3+, Yb3+ rotating microparticle. Real-time analysis of the green emission of erbium ions, generated by thermally coupled levels, provides the thermal readout. At the same time, the highly polarized red emission of erbium ions allows extracting the UCP rotating speed, from which the local viscosity is determined. Since temperature and viscosity readouts are based on different physical phenomena and are obtained from the analysis of different emission bands, they are decoupled. The ability of the NaYF4: Er3+, Yb3+ rotating microparticle to provide reliable, simultaneous, and decoupled readouts of viscosity and temperature has been used in two proof-of-concept experiments. Therein, we were able to individually monitor temperature and viscosity during the mixing of two liquids and during local heating of a liquid medium.
The results presented here pave the way for the development of fast and miniaturized systems for local characterization of biological media at the microscale that could overcome the current limitations of luminescent sensors. For example, this study could enable further analysis of different biosystems or temperature-changing events such as in situ monitoring of reaction processes and other complex mechanisms.
4 Experimental Section
Synthesis
Yttrium oxide (99.99%), ytterbium oxide (99.99%), erbium oxide (99.99%), and sodium fluoride were purchased from ALDRICH Chemistry. Lanthanide nitrates were obtained by reacting a stoichiometric amount of lanthanide oxides with nitric acid. Ethanol (96% pure p.a.), sodium citrate (pure p.a.), and nitric acid (pure p.a.) were purchased from Avantor (Poland).
The NaYF4 microparticles doped with 20 mol.% Yb3+ and 2 mol.% Er3+ ions were prepared using the hydrothermal method. Aqueous solutions of sodium citrate (9.31 mL; 0.3 m) and Ln(NO3)3 (14 mL; 0.2 m; Ln = Y, Er) were mixed under vigorous stirring to form a milky suspension. Then an aqueous solution of NaF (44.8 mL; 0.5 m) was added to the beaker to form a transparent solution. The mixture was transferred to a 100-mL Teflon vessel and heated to 220 °C for 12 h. After being cooled to room temperature, the reaction product was isolated by centrifugation and washed with ethanol. Finally, the prepared particles were dispersed in water.
Setup Design
Single NaYF4 microparticles were optically trapped using a homemade single-beam optical tweezers setup. A linearly-polarized single-mode fiber-coupled 808-nm laser diode was used as laser radiation. The optical system is schematically represented in Figures 1, 6.
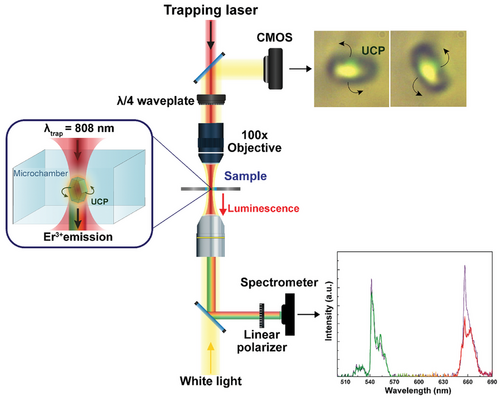
A drop of a colloid of UCPs in water, previously stirred to avoid clusters, was pipetted into a IBIDI micro-chamber and placed in the optical tweezers' setup. The light beam provided by the diode laser was focused into the chamber containing the UCPs by using a LCPLN 100x IR Olympus microscope objective with a Numerical Aperture of 0.85. To induce the UCPs’ rotation, a quarter-wave plate was placed before the focusing objective to convert the linearly polarized light into circularly polarized light by inducing a relative phase shift Δφ of 90°. In these experimental conditions, a single UCP can be simultaneously optically trapped, excited, and rotated. Real time optical imaging of the particle was achieved by coupling a white LED, focused on the sample by an objective lens with low numerical aperture, and using a CMOS camera incorporated into the system together with a spectral filter used to remove the laser light. In Figure 6 two optical images are shown, where the upconversion luminescence of the trapped UCP can be observed. The lower objective lens is used as a light condenser, but it also serves as a collector lens to focus the UC luminescence into a costume-made Ocean Optics QE65000 High-Sensitivity Fiber Optic Spectrometer, with a wavelength range of detection of 400–700 nm and a spectral resolution of one nanometer. Therefore, the upper part of the experimental setup allows the optical trapping of a single microparticle and its rotation, while the lower section of the setup allows the detection of the luminescent particle.
Injection Procedure
A colloidal of UCPs in water was introduced in an IBIDI µ-Slide microchamber and a single UCP was trapped and rotated. Then a solution of 1.88 mg·mL−1 of polyacrylamide in water was injected in the microchamber by one of its inlets. This solution was mixed with 0.3 mg mL−1 of Rhodamine B, a tracer dye that allows the visualization of the liquid flow inside the microchamber. The presence of Rhodamine B, although its absorption overlaps with the erbium emission, does not hinder the reliability to the thermal measurements as explained in Section S9 (Supporting Information) (Figure S8, Supporting Information).
Acknowledgements
This work was supported by grants PID2019-106211RB-I00 (NANONERV) funded by MCIN/AEI/10.13039/501100011033 and by grant TED2021-129937B-I00, CNS2022-135495, and PID2023-151078OB-I00 funded by MCIN/AEI/10.13039/501100011033 and by the “European Union NextGenerationEU/PRTR”. E.O.R acknowledges the financial support provided by the Spanish Ministerio de Universidades, (FPU19/04803). A.B. and K.P. acknowledge statutory funds of the Institute of Low Temperature and Structure Research, Polish Academy of Sciences in Wroclaw. R.M. is grateful to the Spanish Ministerio de Ciencia, Innovación y Universidades for support to research through a Ramón y Cajal Fellowship (RYC2021-032913-I) and Projects PID2022-14210NA-I00 (NAMSTEPS) funded by MICIU/AEI/10.13039/501100011033 and by FEDER, EU, and PID2023-146775OB-I00 (INCLINA) by MCIU/ AEI / 10.13039/501100011033 / FEDER, UE.
Conflict of Interest
The authors declare no conflict of interest.
Open Research
Data Availability Statement
The data that support the findings of this study are available from the corresponding author upon reasonable request.


